Download to read offline
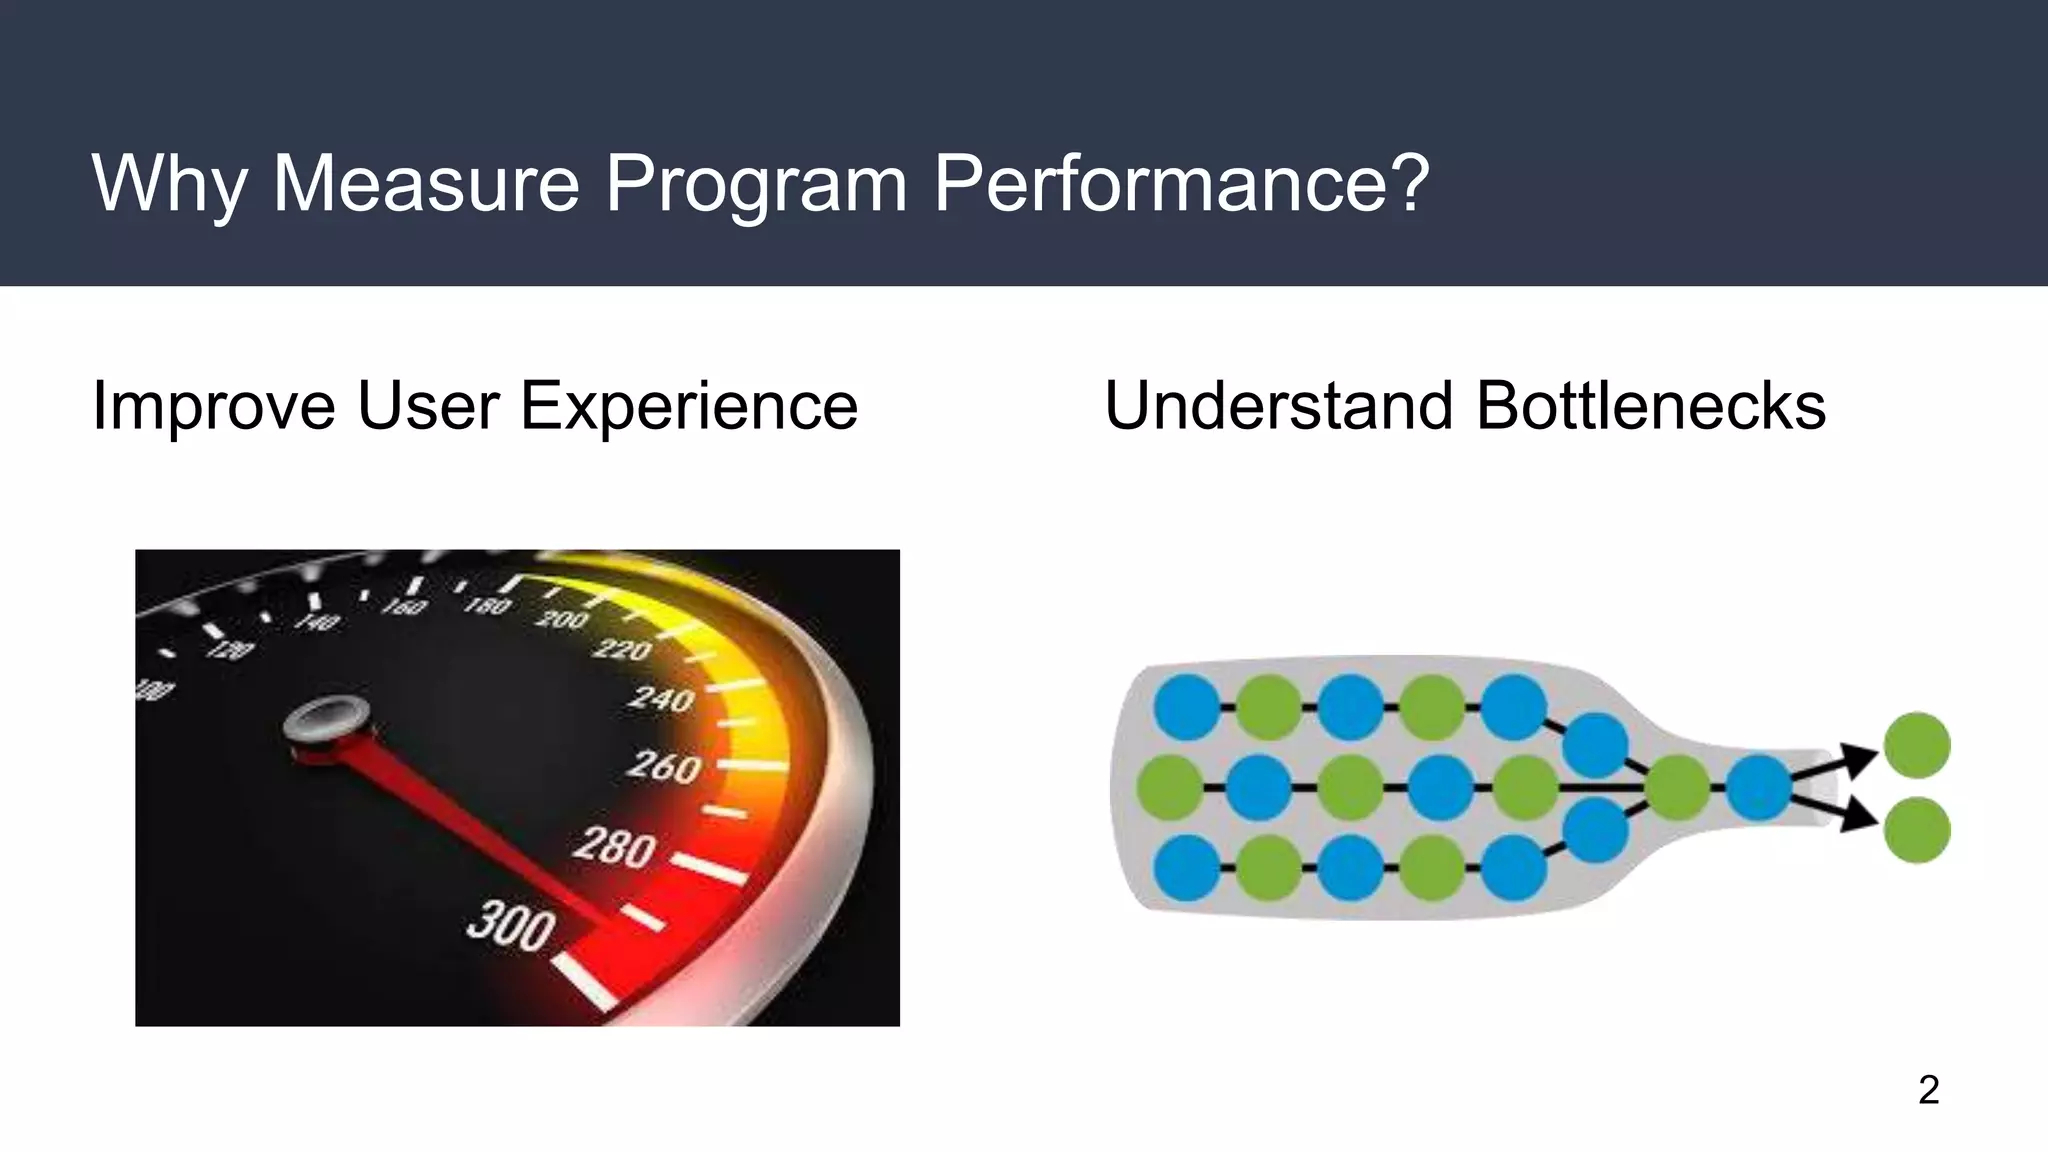
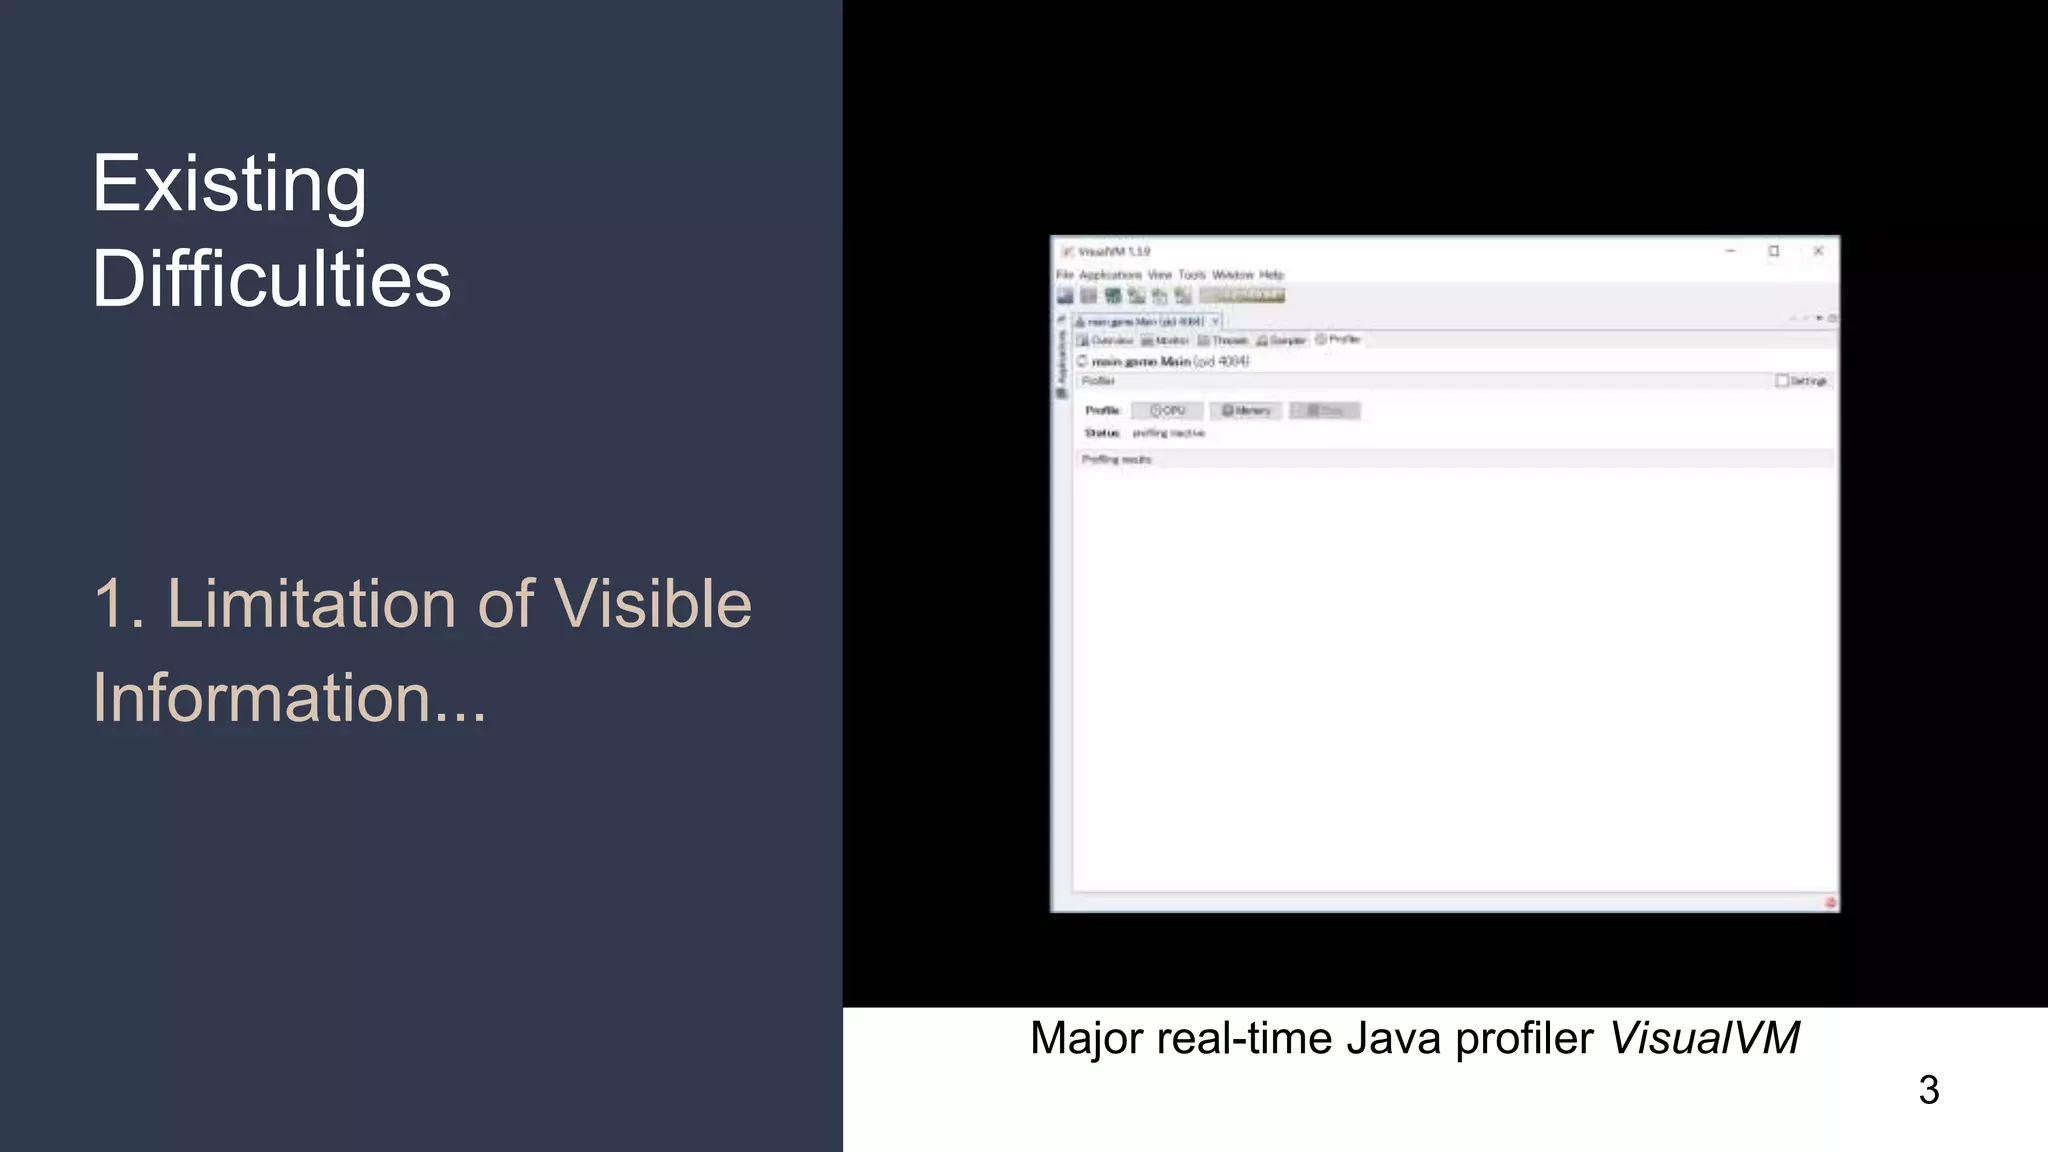
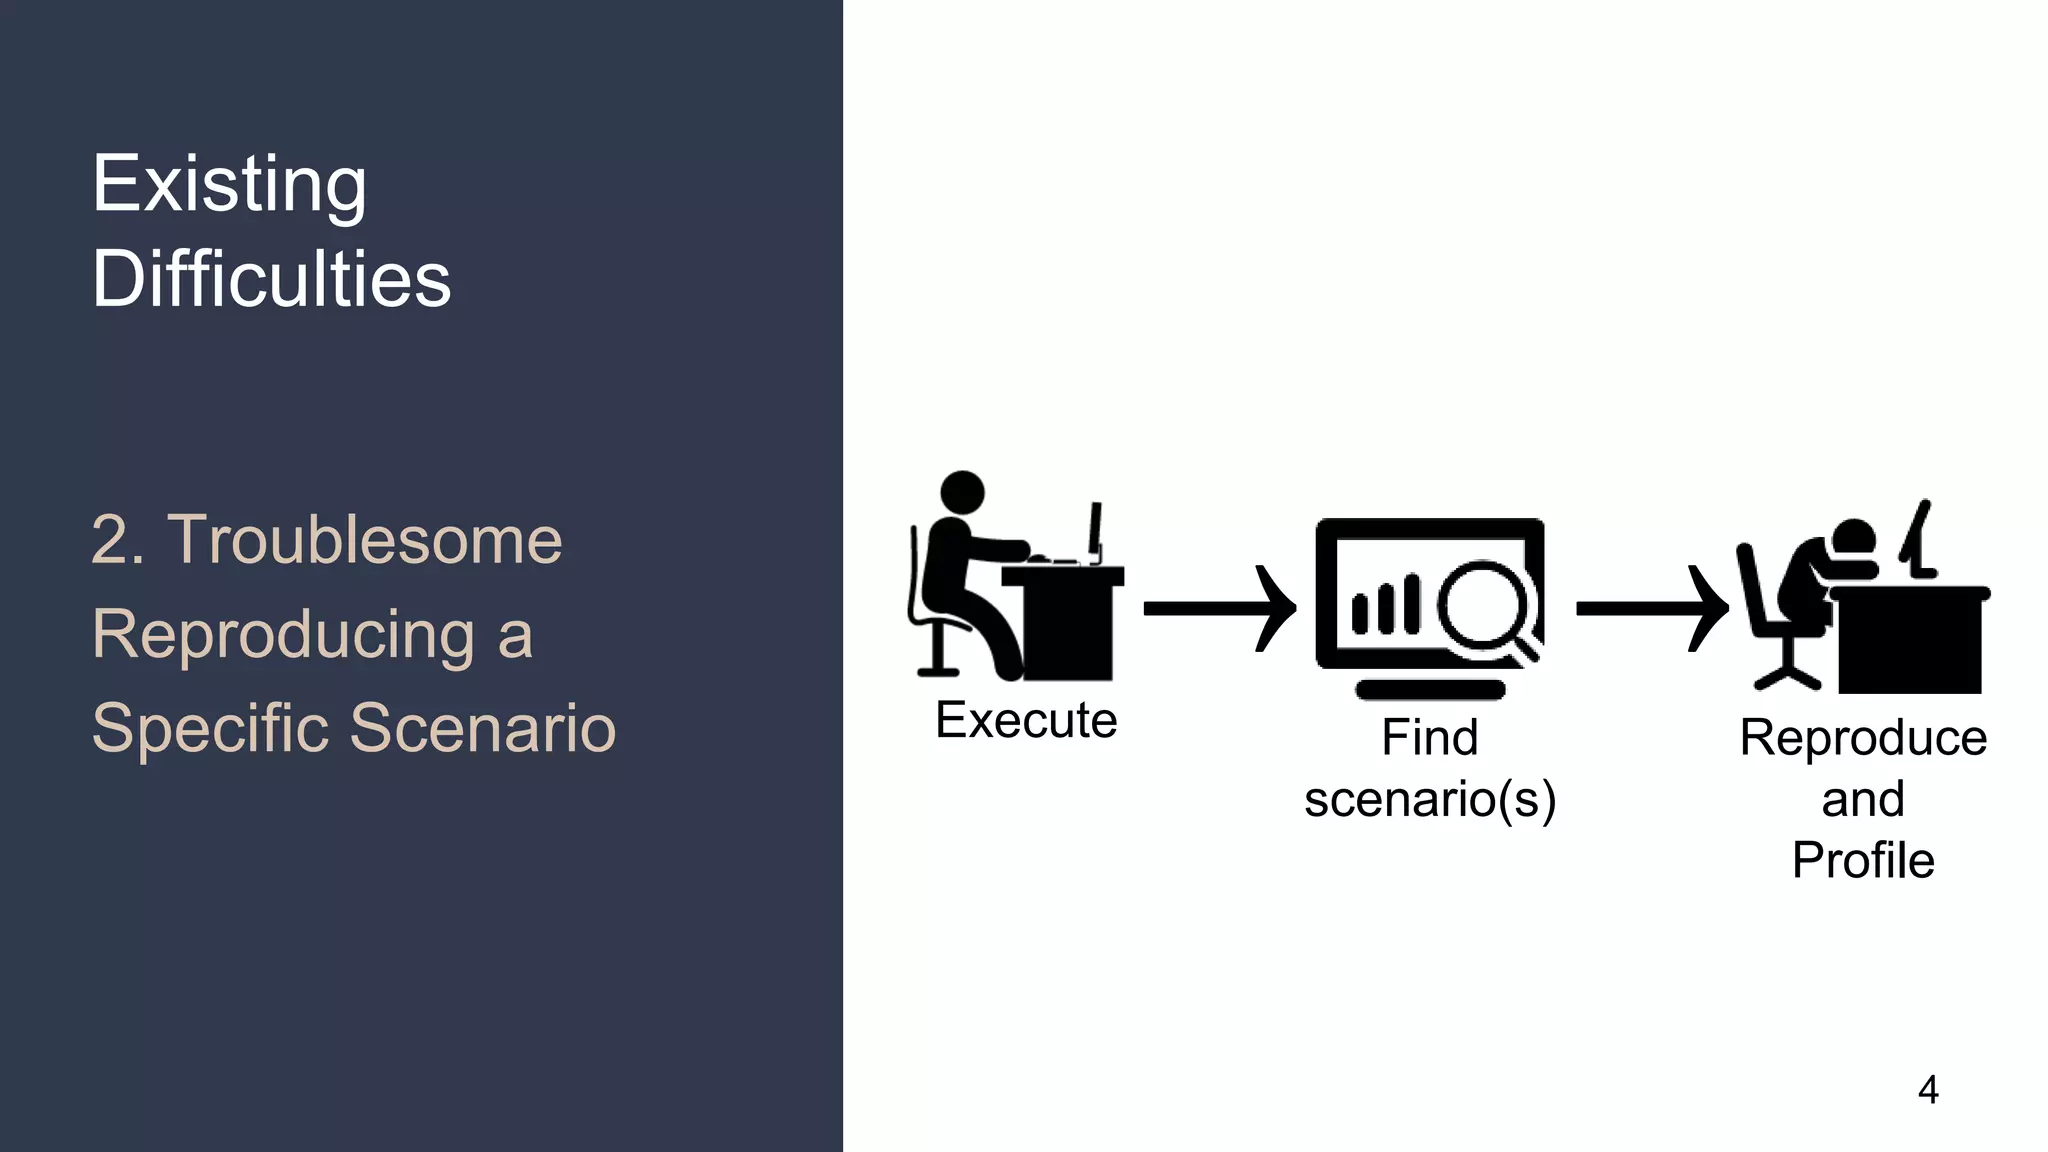
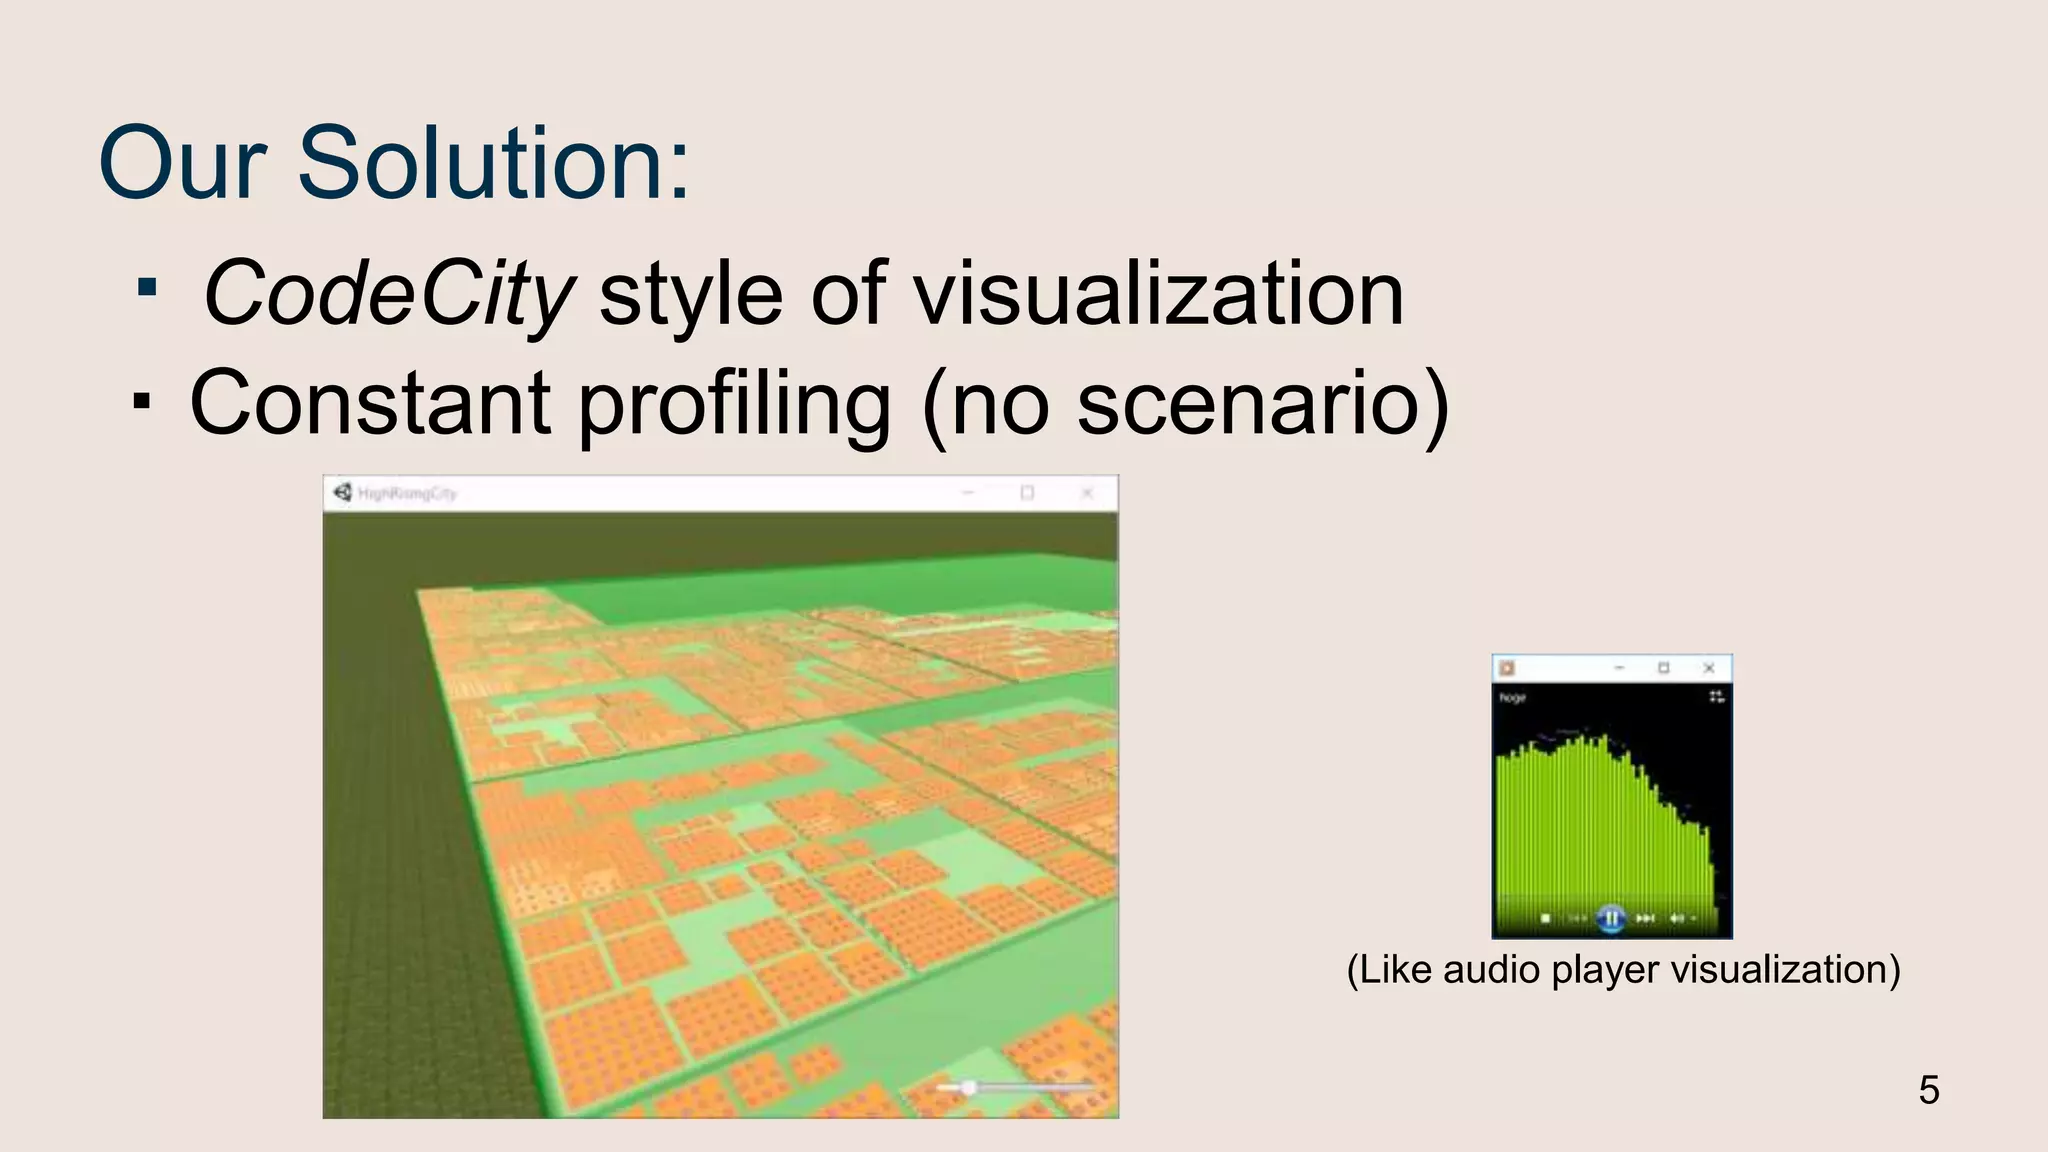

The document discusses a technical paper that proposes using high-rising city visualizations to monitor program performance in real-time. It addresses challenges in profiling applications, specifically the limitations of existing tools and the difficulties in reproducing scenarios, and showcases a solution that provides constant profiling and an innovative visual format. The tool aims to enhance user experience by identifying bottlenecks and uncovering unreproducible performance bugs.


