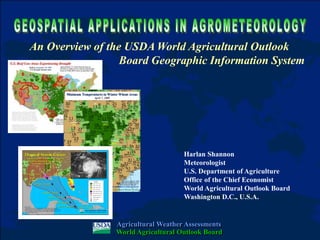
SlideShare a Scribd company logo
1 of 35
Harlan Shannon
Meteorologist
U.S. Department of Agriculture
Office of the Chief Economist
World Agricultural Outlook Board
Washington D.C., U.S.A.
An Overview of the USDA World Agricultural Outlook
Board Geographic Information System
Agricultural Weather Assessments
World Agricultural Outlook Board
โ€ข Several analytical techniques can be
used to assess agricultural weather
โ€“ time series analyses
โ€“ analog comparisons
โ€“ maps
โ€ข Historically, many maps were static &
depicted just one variable, making it
difficult to:
โ€“ overlay data sets
โ€“ visualize and evaluate relationships
โ€“ easily assess crop weather conditions
โ€ข Geographic Information Systems (GIS)
have helped overcome these obstacles
0
25
50
75
100
125
83 84 85 86 87 88 89 90 91 92 93 94 95 96 97 98 99 00 01 02
5 - WESTERN CORN BELT
Percent of Normal Precipitation: May 1 to Dec 31
Introduction
Agricultural Weather Assessments
World Agricultural Outlook Board
INDIAN
OC EAN
Tasmania
Victoria
New South W ales
Queensland
S. Australia
N. Territory
W. Australia
Precipitation (m m)
0 - 1
1 - 10
10 - 25
25 - 50
50 - 100
100 - 200
200 - 400
400 - 1000
1000 +
Precipitation (m m)
0 - 1
1 - 10
10 - 25
25 - 50
50 - 100
100 - 200
200 - 400
400 - 1000
1000 +
USDA World Agricultural Outlook Board
Australia
Total Precipitation (mm)
March 4, 2010 - March 10, 2010
โ€ข GIS defined: integrated system for
organizing, displaying, and analyzing
spatial data using computers and
compatible technologies
โ€ข GIS incorporates quantitative data
directly into the system, helping users:
โ€“ overlay multiple data sets
โ€“ create precise maps
โ€“ statistically evaluate relationships
โ€ข Numerous organizations use GIS to
study, monitor, and model agricultural
and meteorological processes
GIS Described
Simple GIS
Robust GIS
Agricultural Weather Assessments
World Agricultural Outlook Board
โ€ข Software
โ€“ ArcView 3.x โ€“ older software still used
to run some operational applications
โ€“ ArcGIS 9.x โ€“ majority of operations
transitioned to this newer software
โ€ข Hardware
โ€“ Pentium D desktop computers
โ€ข 3.4 GHz processing speed
โ€ข 2 GB RAM
โ€ข Windows XP operating system
โ€“ PCs connected via local area network
โ€“ Oracle 11g database
WAOB Geographic Information System
Agricultural Weather Assessments
World Agricultural Outlook Board
1. Manually generate maps of
important agricultural &
meteorological variables
2. Automate product creation to
maximum extent possible
3. Overlay & analyze
agrometeorological data sets,
establish relationships, & determine
impacts where applicable
GIS Activities
CA
AZ
NM
TX LA
AR
MS AL
FL
Ver.
Puebla
Zacatecas
Sinaloa
Colima
Tab.
Campeche
Quintana
Roo
Yucatan
Chiapas
Oaxaca
Guerrero
Mich.
Jalisco
Nayarit
San Luis
Potosi
Tamaulipas
Nuevo
Leon
Baja
Sur
B aja
Norte
Coahuila
Durango
Chihuahua
Sonora
PACIFIC
OC EAN
GULF
OF
MEXICO
GU AT.
BELIZE
HONDURAS
EL SAL.
NICARAGU A
Percent of N orm al
< 25 %
25 - 50 %
50 - 75 %
75 - 100 %
100 - 150 %
150 - 200 %
200 - 400 %
> 400 %
Precip. = 0
Percent of N orm al
< 25 %
25 - 50 %
50 - 75 %
75 - 100 %
100 - 150 %
150 - 200 %
200 - 400 %
> 400 %
Precip. = 0 USDA World Agricultural Outlook Board
Mexico
Percent of Normal Precipitation
May 1, 2002 - December 31, 2002
1
5.8
1.78
0.44
1.69
0.83
0.16
4.36
0.73
1.05
4.26
0.23
0.4
0.9
0.32
1.02
0.43
0.37
0.01
0.43
2.23
0.43
1.87
2.57
3.55
0.85
5.73
0.43
3.38
0.43 0.43
3.22
5.97
0.37
0.13
0.43
2.37
0.43
0.02
0.48
2.78
2.46
0.79
0.89
0.43
0
0
0
0.2
0.37
0.12
1.59
0.37
0.37
0.43
0.37
0.37
0.44
2.44
0.37
0.37
0.15
0.22
2.07
0.37
0.37
0.43
0.06
0.43
0.37
0.77
0.43
0.02
0.43
0.37
10.62
1.51
0.43
Tropical Storm Gaston
Rainfall in Mid-Atlantic Cotton Growing Areas
World Agricultural Outlook Board
Joint Agricultural Weather Facility
Virginia
North
Carolina
South
Carolina
Atlantic
Ocean
Cotton Percent Bolls Opening
North Carolina
South Carolina
34%
20%
Data obtained from NASS weekly Crop Progress
report (released August 30, 2004)
Virginia 54%
#
Charleston
Raleigh
Wilmington
Richmond
Norfolk
8 PM, Saturday, Aug 29 - 8 AM, Tuesday, Aug 31
(Rainfall reported in inches)
Legend
Major Growing Areas
Minor Growing Areas
Storm Track (general)
Agricultural Weather Assessments
World Agricultural Outlook Board
manual laborโ€ฆ
Agricultural Weather Assessments
World Agricultural Outlook Board
GIS Activities
Crop Production Data โ€“ Internet
NASS crop production data
posted on the Internet
Agricultural Weather Assessments
World Agricultural Outlook Board
Crop Production Data โ€“ Excel
Data can be converted into a
GIS-compatible format using
a spreadsheet
Agricultural Weather Assessments
World Agricultural Outlook Board
Crop Production Data โ€“ ArcView
Agricultural data can then be
imported into GIS and mapped
Agricultural Weather Assessments
World Agricultural Outlook Board
Crop Maps โ€“ United States
Agricultural Weather Assessments
World Agricultural Outlook Board
Crop Maps โ€“ United States
Agricultural Weather Assessments
World Agricultural Outlook Board
Crop Maps โ€“ Brazil
Agricultural Weather Assessments
World Agricultural Outlook Board
Crop Maps โ€“ Russia
Russia: Wheat
JOINT AGRICULTURAL WEATHER FACILITY (JAWF)
Major growing areas
Minor growing areas
Legend
Percentages indicate each region's contribution
to total national production. Regions not numbered
contribute less than 1% to the national total.
22
8
26
28
15
Siberia
Region
Urals
Region
Northern
Region
Volga
Region
Central
Region
Southern
Region
Russia
Ukraine
Belarus
Kazakhstan
Area depicted in map above
Lakes
FEB MAR
Wheat crop calendar for most of Russia
JAN MAY
MAR APR DEC
AUG
JUN JUL SEP OCT NOV
PLANT
PLANT
HEAD
HEAD
HARVEST HARVEST
#
#
Major and minor growing areas combined account for
99% of total national production
Major growing areas combined account for 75% of total
national production
Major and minor growing areas and country production
percentages based upon averaged oblast-level data from
1996-2000.
#
Source: Sovecon Agrokhleb Bulletin Statistics and Forecasts
February 18, 2003 Issue No.4 (41), 2002.
Pink = spring wheat
Blue = winter w heat
Agricultural Weather Assessments
World Agricultural Outlook Board
โ€ข Crop production areas shift slowly
over time, thus maps of major crop
areas are updated infrequently
โ€“ automated updates not necessary
โ€ข In contrast, crop progress & conditions
vary on much shorter time scales,
requiring more frequent map updates
โ€“ manual map production can be time
consuming and tedious if a large
number of products are required
โ€ข Automation is necessary to effectively
and efficiently produce such products
Automating Applications
Agricultural Weather Assessments
World Agricultural Outlook Board
5
27
24
12
46 75
4
3
47
13
75
12
6
13
7
67
75
0
National Progress
Since last week
Versus 5-yr average
Behind the 5-yr average by at least 15 percentage points
Ahead of the 5-yr average by at least 15 percentage points
#
#
Joint Agricultural Weather Facility (JAWF)
U.S. Corn Progress
U.S. Corn Progress
Portion of Crop Mature
September 2, 2001
September 2, 2001
Mature
Mature 20
20
+8
+8
+4
+4
Crop Progress & Condition Maps
Crop progress and condition
maps previously prepared
by hand
Agricultural Weather Assessments
World Agricultural Outlook Board
VBA Macros
โ€ข Object-oriented programming
language, enables users to automate
various tasks associated with mapping
โ€ข Examples of automation:
โ€“ importing data
โ€“ spatial analysis (e.g., contouring)
โ€“ defining map scale/extent
โ€“ annotation
โ€“ creating a map legend
โ€“ exporting/printing a map
Agricultural Weather Assessments
World Agricultural Outlook Board
Crop Progress & Condition Maps
Programming significantly
reduces product generation
time and ensures product
consistency from run-to-run
Agricultural Weather Assessments
World Agricultural Outlook Board
Crop Progress & Condition Maps
Once initial programming
accomplished, often little
additional code needed to
expand/enhance suite of
products
Agricultural Weather Assessments
World Agricultural Outlook Board
Crop Progress & Condition Maps
Agricultural Weather Assessments
World Agricultural Outlook Board
Crop Progress & Condition Maps
Agricultural Weather Assessments
World Agricultural Outlook Board
same principles apply to automating
weather analysesโ€ฆ
Automating More Applications
Agricultural Weather Assessments
World Agricultural Outlook Board
Maps of Daily Data
Blue number = minimum temperature
Red number = maximum temperature
Green number = precipitation
Agricultural Weather Assessments
World Agricultural Outlook Board
Color Contour Maps
Agricultural Weather Assessments
World Agricultural Outlook Board
CA
AZ
NM
TX LA
AR
MS AL
FL
Ver.
Puebla
Zacatecas
Sinaloa
Colima
Tab.
Campeche
Quintana
Roo
Yucatan
Chiapas
Oaxaca
Guerrero
Mich.
Jalisco
Nayarit
San Luis
Potosi
Tamaulipas
Nuevo
Leon
Baja
Sur
B aja
Norte
Coahuila
Durango
Chihuahua
Sonora
PACIFIC
OC EAN
GULF
OF
MEXICO
GU AT.
BELIZE
HONDURAS
EL SAL.
NICARAGU A
Precipitation (m m )
0 - 1
1 - 10
10 - 25
25 - 50
50 - 100
100 - 200
200 - 400
400 - 1000
1000 +
Precipitation (m m )
0 - 1
1 - 10
10 - 25
25 - 50
50 - 100
100 - 200
200 - 400
400 - 1000
1000 +
USDA World Agricultural Outlook Board
Mexico
Total Precipitation (mm )
October 11, 2009 - October 17, 2009
Color Contour Maps
Agricultural Weather Assessments
World Agricultural Outlook Board
Western
Australia
Northern
Territory
South
Australia
Queensland
New South
Wales
Victoria
Tas.
Java
INDONESIA
Coral
Sea
Gulf
of
Carpentaria
Timor
Sea
INDIAN
OCEAN
INDIAN
OCEAN Australia
Total Precipitation (mm)
August 30, 2010 - September 5, 2010
25 to 50
75 to 100
125 to 150
200 to 225
250 to 275
50 to 75
100 to 125
175 to 200
225 to 250
275 to 300
150 to 175
300 to 350
400 to 450
500 to 600
350 to 400
450 to 500
600 to 800
Above 800
Precipitation (mm)
0 to 1
5 to 10
1 to 5
10 to 25
Agricultural Weather Assessments
World Agricultural Outlook Board
Data Source: Supplemental
Crop Moisture Index
Agricultural Weather Assessments
World Agricultural Outlook Board
MODIS Crop Condition Analyses
Western Australia
September 3, 2007
Western Australia
September 2, 2008
Agricultural Weather Assessments
World Agricultural Outlook Board
MODIS Winterkill Analyses
Agricultural Weather Assessments
World Agricultural Outlook Board
real power in GIS is ability to
overlay and analyze multiple data setsโ€ฆ
Overlaying & Analyzing Data
Agricultural Weather Assessments
World Agricultural Outlook Board
Percent of Cotton Bolls
Open by Sep 26
Open by Sep 26
TOP ## = Percent Bolls Open
[BOTTOM ##] = Change from
[BOTTOM ##] = Change from
5-yr average
5-yr average
Data Sources:
- Rainfall estimates obtained from the National Weather Service
- Agricultural areas are delineated using NASS county-level crop data
84
84
[+10]
[+10]
92
92
[+22]
[+22]
81
81
[+8]
[+8]
91
91
[+8]
[+8]
71
71
[-14]
[-14]
95
95
[+12]
[+12]
Major Cotton Areas
Minor Cotton Areas
8 AM EDT Sep 25, 2010 - 8 AM EDT Oct 2, 2010
Remnants of Nicole combine with
a front to soak East Coast cotton
Rainfall (inches)
0.1 - 1.0
1.0 - 2.0
2.0 - 4.0
4.0 - 6.0
10.0 - 16.0
6.0 - 8.0
8.0 - 10.0
More than 16.0
Agricultural Weather Assessments
World Agricultural Outlook Board
Thank You !
Agricultural Weather Assessments
World Agricultural Outlook Board

More Related Content

Similar to USDA-GIS-101117_ENVIRONMENT*******************

Crow.IGARSS.talk.pptx
Crow.IGARSS.talk.pptxCrow.IGARSS.talk.pptx
Crow.IGARSS.talk.pptx
grssieee
ย 
Development and application of core attributes, A first approximation nation...
Development and application of core attributes,  A first approximation nation...Development and application of core attributes,  A first approximation nation...
Development and application of core attributes, A first approximation nation...
Richard Thackway
ย 
Beyond Routine Forecast Services, Gregory Waller
Beyond Routine Forecast Services, Gregory WallerBeyond Routine Forecast Services, Gregory Waller
Beyond Routine Forecast Services, Gregory Waller
TWCA
ย 
Knudsen_FMSAS_for_ESI_Workshop
Knudsen_FMSAS_for_ESI_WorkshopKnudsen_FMSAS_for_ESI_Workshop
Knudsen_FMSAS_for_ESI_Workshop
Richard Knudsen
ย 
Landscape Capacity Analysis For Ventura County
Landscape Capacity Analysis For Ventura CountyLandscape Capacity Analysis For Ventura County
Landscape Capacity Analysis For Ventura County
Ecotrust
ย 

Similar to USDA-GIS-101117_ENVIRONMENT******************* (20)

Climate and crop modeling by Gummadi Sridhar,Gizachew Legesse,Pauline Chiveng...
Climate and crop modeling by Gummadi Sridhar,Gizachew Legesse,Pauline Chiveng...Climate and crop modeling by Gummadi Sridhar,Gizachew Legesse,Pauline Chiveng...
Climate and crop modeling by Gummadi Sridhar,Gizachew Legesse,Pauline Chiveng...
ย 
Comparison of wepp and apex runoff
Comparison of wepp and apex runoffComparison of wepp and apex runoff
Comparison of wepp and apex runoff
ย 
Crop monitoring for Agri Consultants
Crop monitoring for Agri Consultants Crop monitoring for Agri Consultants
Crop monitoring for Agri Consultants
ย 
Crow.IGARSS.talk.pptx
Crow.IGARSS.talk.pptxCrow.IGARSS.talk.pptx
Crow.IGARSS.talk.pptx
ย 
The CCAFS Regional Agricultural Forecasting Tool Box (CRAFT)
The CCAFS Regional Agricultural Forecasting Tool Box (CRAFT)The CCAFS Regional Agricultural Forecasting Tool Box (CRAFT)
The CCAFS Regional Agricultural Forecasting Tool Box (CRAFT)
ย 
Precision Management - Nicole Rabe and Sarah Lepp - 12
Precision Management - Nicole Rabe and Sarah Lepp - 12Precision Management - Nicole Rabe and Sarah Lepp - 12
Precision Management - Nicole Rabe and Sarah Lepp - 12
ย 
DSD-INT 2016 Chautauqua; the Alberta groundwater information system using Del...
DSD-INT 2016 Chautauqua; the Alberta groundwater information system using Del...DSD-INT 2016 Chautauqua; the Alberta groundwater information system using Del...
DSD-INT 2016 Chautauqua; the Alberta groundwater information system using Del...
ย 
WEPP Model Enhancements for NRCS Use
WEPP Model Enhancements for NRCS UseWEPP Model Enhancements for NRCS Use
WEPP Model Enhancements for NRCS Use
ย 
IRJET- Rainfall-Runoff Analysis of the Watershed for River AIE
IRJET-  	  Rainfall-Runoff Analysis of the Watershed for River AIEIRJET-  	  Rainfall-Runoff Analysis of the Watershed for River AIE
IRJET- Rainfall-Runoff Analysis of the Watershed for River AIE
ย 
Radarโ€™s Potential to Estimate Crop Bio-Physical Parameters & Beyond
Radarโ€™s Potential to Estimate Crop Bio-Physical Parameters & BeyondRadarโ€™s Potential to Estimate Crop Bio-Physical Parameters & Beyond
Radarโ€™s Potential to Estimate Crop Bio-Physical Parameters & Beyond
ย 
23 - NRSC - Remote Satellite Imgae - Hydrology and Water Management-Sep-17
23 - NRSC - Remote Satellite Imgae - Hydrology and Water Management-Sep-1723 - NRSC - Remote Satellite Imgae - Hydrology and Water Management-Sep-17
23 - NRSC - Remote Satellite Imgae - Hydrology and Water Management-Sep-17
ย 
The CCAFS Regional Agricultural Forecasting Tool Box (CRAFT)
The CCAFS Regional Agricultural Forecasting Tool Box (CRAFT)The CCAFS Regional Agricultural Forecasting Tool Box (CRAFT)
The CCAFS Regional Agricultural Forecasting Tool Box (CRAFT)
ย 
CCAFS Regional Agricultural Forecasting Toolbox (CRAFT)
CCAFS Regional Agricultural Forecasting Toolbox (CRAFT)CCAFS Regional Agricultural Forecasting Toolbox (CRAFT)
CCAFS Regional Agricultural Forecasting Toolbox (CRAFT)
ย 
Development and application of core attributes, A first approximation nation...
Development and application of core attributes,  A first approximation nation...Development and application of core attributes,  A first approximation nation...
Development and application of core attributes, A first approximation nation...
ย 
July 29-330-Mike Kucera
July 29-330-Mike KuceraJuly 29-330-Mike Kucera
July 29-330-Mike Kucera
ย 
EcoTas13 Hutchinson e-MAST ANU
EcoTas13 Hutchinson e-MAST ANUEcoTas13 Hutchinson e-MAST ANU
EcoTas13 Hutchinson e-MAST ANU
ย 
Beyond Routine Forecast Services, Gregory Waller
Beyond Routine Forecast Services, Gregory WallerBeyond Routine Forecast Services, Gregory Waller
Beyond Routine Forecast Services, Gregory Waller
ย 
Knudsen_FMSAS_for_ESI_Workshop
Knudsen_FMSAS_for_ESI_WorkshopKnudsen_FMSAS_for_ESI_Workshop
Knudsen_FMSAS_for_ESI_Workshop
ย 
Landscape Capacity Analysis For Ventura County
Landscape Capacity Analysis For Ventura CountyLandscape Capacity Analysis For Ventura County
Landscape Capacity Analysis For Ventura County
ย 
Regional impact assessment modelling
Regional impact assessment modellingRegional impact assessment modelling
Regional impact assessment modelling
ย 

More from ArmandTanougong1

RwandaSession_remote sensing and agriculture
RwandaSession_remote sensing and agricultureRwandaSession_remote sensing and agriculture
RwandaSession_remote sensing and agriculture
ArmandTanougong1
ย 
Application-of-Remote-Sen.7uuuuuuuuuuu536913.pptx
Application-of-Remote-Sen.7uuuuuuuuuuu536913.pptxApplication-of-Remote-Sen.7uuuuuuuuuuu536913.pptx
Application-of-Remote-Sen.7uuuuuuuuuuu536913.pptx
ArmandTanougong1
ย 
Remote sensing and agriculture using hight data
Remote sensing and agriculture using hight dataRemote sensing and agriculture using hight data
Remote sensing and agriculture using hight data
ArmandTanougong1
ย 
SmartFarmingTechniquesandEffectsofCropManagementPPT.pptx
SmartFarmingTechniquesandEffectsofCropManagementPPT.pptxSmartFarmingTechniquesandEffectsofCropManagementPPT.pptx
SmartFarmingTechniquesandEffectsofCropManagementPPT.pptx
ArmandTanougong1
ย 
Introduction-a-la-tetedetection-et-agriculture-digitale.pptx
Introduction-a-la-tetedetection-et-agriculture-digitale.pptxIntroduction-a-la-tetedetection-et-agriculture-digitale.pptx
Introduction-a-la-tetedetection-et-agriculture-digitale.pptx
ArmandTanougong1
ย 
renforcement de la rรฉsilience des petits agriculteurs par les techniques de l...
renforcement de la rรฉsilience des petits agriculteurs par les techniques de l...renforcement de la rรฉsilience des petits agriculteurs par les techniques de l...
renforcement de la rรฉsilience des petits agriculteurs par les techniques de l...
ArmandTanougong1
ย 

More from ArmandTanougong1 (6)

RwandaSession_remote sensing and agriculture
RwandaSession_remote sensing and agricultureRwandaSession_remote sensing and agriculture
RwandaSession_remote sensing and agriculture
ย 
Application-of-Remote-Sen.7uuuuuuuuuuu536913.pptx
Application-of-Remote-Sen.7uuuuuuuuuuu536913.pptxApplication-of-Remote-Sen.7uuuuuuuuuuu536913.pptx
Application-of-Remote-Sen.7uuuuuuuuuuu536913.pptx
ย 
Remote sensing and agriculture using hight data
Remote sensing and agriculture using hight dataRemote sensing and agriculture using hight data
Remote sensing and agriculture using hight data
ย 
SmartFarmingTechniquesandEffectsofCropManagementPPT.pptx
SmartFarmingTechniquesandEffectsofCropManagementPPT.pptxSmartFarmingTechniquesandEffectsofCropManagementPPT.pptx
SmartFarmingTechniquesandEffectsofCropManagementPPT.pptx
ย 
Introduction-a-la-tetedetection-et-agriculture-digitale.pptx
Introduction-a-la-tetedetection-et-agriculture-digitale.pptxIntroduction-a-la-tetedetection-et-agriculture-digitale.pptx
Introduction-a-la-tetedetection-et-agriculture-digitale.pptx
ย 
renforcement de la rรฉsilience des petits agriculteurs par les techniques de l...
renforcement de la rรฉsilience des petits agriculteurs par les techniques de l...renforcement de la rรฉsilience des petits agriculteurs par les techniques de l...
renforcement de la rรฉsilience des petits agriculteurs par les techniques de l...
ย 

Recently uploaded

Get Premium Attur Layout Call Girls (8005736733) 24x7 Rate 15999 with A/c Roo...
Get Premium Attur Layout Call Girls (8005736733) 24x7 Rate 15999 with A/c Roo...Get Premium Attur Layout Call Girls (8005736733) 24x7 Rate 15999 with A/c Roo...
Get Premium Attur Layout Call Girls (8005736733) 24x7 Rate 15999 with A/c Roo...
MOHANI PANDEY
ย 
Get Premium Hoskote Call Girls (8005736733) 24x7 Rate 15999 with A/c Room Cas...
Get Premium Hoskote Call Girls (8005736733) 24x7 Rate 15999 with A/c Room Cas...Get Premium Hoskote Call Girls (8005736733) 24x7 Rate 15999 with A/c Room Cas...
Get Premium Hoskote Call Girls (8005736733) 24x7 Rate 15999 with A/c Room Cas...
MOHANI PANDEY
ย 
Environmental Science - Nuclear Hazards and Us.pptx
Environmental Science - Nuclear Hazards and Us.pptxEnvironmental Science - Nuclear Hazards and Us.pptx
Environmental Science - Nuclear Hazards and Us.pptx
hossanmdjobayer103
ย 
celebrity ๐Ÿ’‹ Kanpur Escorts Just Dail 8250092165 service available anytime 24 ...
celebrity ๐Ÿ’‹ Kanpur Escorts Just Dail 8250092165 service available anytime 24 ...celebrity ๐Ÿ’‹ Kanpur Escorts Just Dail 8250092165 service available anytime 24 ...
celebrity ๐Ÿ’‹ Kanpur Escorts Just Dail 8250092165 service available anytime 24 ...
Call Girls in Nagpur High Profile
ย 
Call Now โ˜Ž๏ธ๐Ÿ” 9332606886 ๐Ÿ”ย Call Girls โค Service In Muzaffarpur Female Escorts ...
Call Now โ˜Ž๏ธ๐Ÿ” 9332606886 ๐Ÿ”ย Call Girls โค Service In Muzaffarpur Female Escorts ...Call Now โ˜Ž๏ธ๐Ÿ” 9332606886 ๐Ÿ”ย Call Girls โค Service In Muzaffarpur Female Escorts ...
Call Now โ˜Ž๏ธ๐Ÿ” 9332606886 ๐Ÿ”ย Call Girls โค Service In Muzaffarpur Female Escorts ...
Anamikakaur10
ย 
VVIP Pune Call Girls Vishal Nagar WhatSapp Number 8005736733 With Elite Staff...
VVIP Pune Call Girls Vishal Nagar WhatSapp Number 8005736733 With Elite Staff...VVIP Pune Call Girls Vishal Nagar WhatSapp Number 8005736733 With Elite Staff...
VVIP Pune Call Girls Vishal Nagar WhatSapp Number 8005736733 With Elite Staff...
SUHANI PANDEY
ย 
VIP Model Call Girls Chakan ( Pune ) Call ON 8005736733 Starting From 5K to 2...
VIP Model Call Girls Chakan ( Pune ) Call ON 8005736733 Starting From 5K to 2...VIP Model Call Girls Chakan ( Pune ) Call ON 8005736733 Starting From 5K to 2...
VIP Model Call Girls Chakan ( Pune ) Call ON 8005736733 Starting From 5K to 2...
SUHANI PANDEY
ย 
Call Girls Service Pune โ‚น7.5k Pick Up & Drop With Cash Payment 8005736733 Cal...
Call Girls Service Pune โ‚น7.5k Pick Up & Drop With Cash Payment 8005736733 Cal...Call Girls Service Pune โ‚น7.5k Pick Up & Drop With Cash Payment 8005736733 Cal...
Call Girls Service Pune โ‚น7.5k Pick Up & Drop With Cash Payment 8005736733 Cal...
SUHANI PANDEY
ย 
VIP Call Girls Valsad 7001035870 Whatsapp Number, 24/07 Booking
VIP Call Girls Valsad 7001035870 Whatsapp Number, 24/07 BookingVIP Call Girls Valsad 7001035870 Whatsapp Number, 24/07 Booking
VIP Call Girls Valsad 7001035870 Whatsapp Number, 24/07 Booking
dharasingh5698
ย 
VIP Model Call Girls Viman Nagar ( Pune ) Call ON 8005736733 Starting From 5K...
VIP Model Call Girls Viman Nagar ( Pune ) Call ON 8005736733 Starting From 5K...VIP Model Call Girls Viman Nagar ( Pune ) Call ON 8005736733 Starting From 5K...
VIP Model Call Girls Viman Nagar ( Pune ) Call ON 8005736733 Starting From 5K...
SUHANI PANDEY
ย 
VIP Model Call Girls Charholi Budruk ( Pune ) Call ON 8005736733 Starting Fro...
VIP Model Call Girls Charholi Budruk ( Pune ) Call ON 8005736733 Starting Fro...VIP Model Call Girls Charholi Budruk ( Pune ) Call ON 8005736733 Starting Fro...
VIP Model Call Girls Charholi Budruk ( Pune ) Call ON 8005736733 Starting Fro...
SUHANI PANDEY
ย 

Recently uploaded (20)

Get Premium Attur Layout Call Girls (8005736733) 24x7 Rate 15999 with A/c Roo...
Get Premium Attur Layout Call Girls (8005736733) 24x7 Rate 15999 with A/c Roo...Get Premium Attur Layout Call Girls (8005736733) 24x7 Rate 15999 with A/c Roo...
Get Premium Attur Layout Call Girls (8005736733) 24x7 Rate 15999 with A/c Roo...
ย 
Get Premium Hoskote Call Girls (8005736733) 24x7 Rate 15999 with A/c Room Cas...
Get Premium Hoskote Call Girls (8005736733) 24x7 Rate 15999 with A/c Room Cas...Get Premium Hoskote Call Girls (8005736733) 24x7 Rate 15999 with A/c Room Cas...
Get Premium Hoskote Call Girls (8005736733) 24x7 Rate 15999 with A/c Room Cas...
ย 
Enhancing forest data transparency for climate action
Enhancing forest data transparency for climate actionEnhancing forest data transparency for climate action
Enhancing forest data transparency for climate action
ย 
Environmental Science - Nuclear Hazards and Us.pptx
Environmental Science - Nuclear Hazards and Us.pptxEnvironmental Science - Nuclear Hazards and Us.pptx
Environmental Science - Nuclear Hazards and Us.pptx
ย 
Deforestation
DeforestationDeforestation
Deforestation
ย 
Call Girls Ramtek Call Me 7737669865 Budget Friendly No Advance Booking
Call Girls Ramtek Call Me 7737669865 Budget Friendly No Advance BookingCall Girls Ramtek Call Me 7737669865 Budget Friendly No Advance Booking
Call Girls Ramtek Call Me 7737669865 Budget Friendly No Advance Booking
ย 
Call Girls Talegaon Dabhade Call Me 7737669865 Budget Friendly No Advance Boo...
Call Girls Talegaon Dabhade Call Me 7737669865 Budget Friendly No Advance Boo...Call Girls Talegaon Dabhade Call Me 7737669865 Budget Friendly No Advance Boo...
Call Girls Talegaon Dabhade Call Me 7737669865 Budget Friendly No Advance Boo...
ย 
Proposed Amendments to Chapter 15, Article X: Wetland Conservation Areas
Proposed Amendments to Chapter 15, Article X: Wetland Conservation AreasProposed Amendments to Chapter 15, Article X: Wetland Conservation Areas
Proposed Amendments to Chapter 15, Article X: Wetland Conservation Areas
ย 
celebrity ๐Ÿ’‹ Kanpur Escorts Just Dail 8250092165 service available anytime 24 ...
celebrity ๐Ÿ’‹ Kanpur Escorts Just Dail 8250092165 service available anytime 24 ...celebrity ๐Ÿ’‹ Kanpur Escorts Just Dail 8250092165 service available anytime 24 ...
celebrity ๐Ÿ’‹ Kanpur Escorts Just Dail 8250092165 service available anytime 24 ...
ย 
Call Now โ˜Ž๏ธ๐Ÿ” 9332606886 ๐Ÿ”ย Call Girls โค Service In Muzaffarpur Female Escorts ...
Call Now โ˜Ž๏ธ๐Ÿ” 9332606886 ๐Ÿ”ย Call Girls โค Service In Muzaffarpur Female Escorts ...Call Now โ˜Ž๏ธ๐Ÿ” 9332606886 ๐Ÿ”ย Call Girls โค Service In Muzaffarpur Female Escorts ...
Call Now โ˜Ž๏ธ๐Ÿ” 9332606886 ๐Ÿ”ย Call Girls โค Service In Muzaffarpur Female Escorts ...
ย 
VVIP Pune Call Girls Vishal Nagar WhatSapp Number 8005736733 With Elite Staff...
VVIP Pune Call Girls Vishal Nagar WhatSapp Number 8005736733 With Elite Staff...VVIP Pune Call Girls Vishal Nagar WhatSapp Number 8005736733 With Elite Staff...
VVIP Pune Call Girls Vishal Nagar WhatSapp Number 8005736733 With Elite Staff...
ย 
VIP Model Call Girls Chakan ( Pune ) Call ON 8005736733 Starting From 5K to 2...
VIP Model Call Girls Chakan ( Pune ) Call ON 8005736733 Starting From 5K to 2...VIP Model Call Girls Chakan ( Pune ) Call ON 8005736733 Starting From 5K to 2...
VIP Model Call Girls Chakan ( Pune ) Call ON 8005736733 Starting From 5K to 2...
ย 
Call Girls Service Pune โ‚น7.5k Pick Up & Drop With Cash Payment 8005736733 Cal...
Call Girls Service Pune โ‚น7.5k Pick Up & Drop With Cash Payment 8005736733 Cal...Call Girls Service Pune โ‚น7.5k Pick Up & Drop With Cash Payment 8005736733 Cal...
Call Girls Service Pune โ‚น7.5k Pick Up & Drop With Cash Payment 8005736733 Cal...
ย 
VIP Call Girls Valsad 7001035870 Whatsapp Number, 24/07 Booking
VIP Call Girls Valsad 7001035870 Whatsapp Number, 24/07 BookingVIP Call Girls Valsad 7001035870 Whatsapp Number, 24/07 Booking
VIP Call Girls Valsad 7001035870 Whatsapp Number, 24/07 Booking
ย 
VIP Model Call Girls Viman Nagar ( Pune ) Call ON 8005736733 Starting From 5K...
VIP Model Call Girls Viman Nagar ( Pune ) Call ON 8005736733 Starting From 5K...VIP Model Call Girls Viman Nagar ( Pune ) Call ON 8005736733 Starting From 5K...
VIP Model Call Girls Viman Nagar ( Pune ) Call ON 8005736733 Starting From 5K...
ย 
Sector 18, Noida Call girls :8448380779 Model Escorts | 100% verified
Sector 18, Noida Call girls :8448380779 Model Escorts | 100% verifiedSector 18, Noida Call girls :8448380779 Model Escorts | 100% verified
Sector 18, Noida Call girls :8448380779 Model Escorts | 100% verified
ย 
Water Pollution
Water Pollution Water Pollution
Water Pollution
ย 
DENR EPR Law Compliance Updates April 2024
DENR EPR Law Compliance Updates April 2024DENR EPR Law Compliance Updates April 2024
DENR EPR Law Compliance Updates April 2024
ย 
VIP Model Call Girls Charholi Budruk ( Pune ) Call ON 8005736733 Starting Fro...
VIP Model Call Girls Charholi Budruk ( Pune ) Call ON 8005736733 Starting Fro...VIP Model Call Girls Charholi Budruk ( Pune ) Call ON 8005736733 Starting Fro...
VIP Model Call Girls Charholi Budruk ( Pune ) Call ON 8005736733 Starting Fro...
ย 
Green Marketing
Green MarketingGreen Marketing
Green Marketing
ย 

USDA-GIS-101117_ENVIRONMENT*******************

  • 1. Harlan Shannon Meteorologist U.S. Department of Agriculture Office of the Chief Economist World Agricultural Outlook Board Washington D.C., U.S.A. An Overview of the USDA World Agricultural Outlook Board Geographic Information System Agricultural Weather Assessments Agricultural Weather Assessments World Agricultural Outlook Board World Agricultural Outlook Board
  • 2. โ€ข Several analytical techniques can be used to assess agricultural weather โ€“ time series analyses โ€“ analog comparisons โ€“ maps โ€ข Historically, many maps were static & depicted just one variable, making it difficult to: โ€“ overlay data sets โ€“ visualize and evaluate relationships โ€“ easily assess crop weather conditions โ€ข Geographic Information Systems (GIS) have helped overcome these obstacles 0 25 50 75 100 125 83 84 85 86 87 88 89 90 91 92 93 94 95 96 97 98 99 00 01 02 5 - WESTERN CORN BELT Percent of Normal Precipitation: May 1 to Dec 31 Introduction Agricultural Weather Assessments Agricultural Weather Assessments World Agricultural Outlook Board World Agricultural Outlook Board INDIAN OC EAN Tasmania Victoria New South W ales Queensland S. Australia N. Territory W. Australia Precipitation (m m) 0 - 1 1 - 10 10 - 25 25 - 50 50 - 100 100 - 200 200 - 400 400 - 1000 1000 + Precipitation (m m) 0 - 1 1 - 10 10 - 25 25 - 50 50 - 100 100 - 200 200 - 400 400 - 1000 1000 + USDA World Agricultural Outlook Board Australia Total Precipitation (mm) March 4, 2010 - March 10, 2010
  • 3. โ€ข GIS defined: integrated system for organizing, displaying, and analyzing spatial data using computers and compatible technologies โ€ข GIS incorporates quantitative data directly into the system, helping users: โ€“ overlay multiple data sets โ€“ create precise maps โ€“ statistically evaluate relationships โ€ข Numerous organizations use GIS to study, monitor, and model agricultural and meteorological processes GIS Described Simple GIS Robust GIS Agricultural Weather Assessments Agricultural Weather Assessments World Agricultural Outlook Board World Agricultural Outlook Board
  • 4. โ€ข Software โ€“ ArcView 3.x โ€“ older software still used to run some operational applications โ€“ ArcGIS 9.x โ€“ majority of operations transitioned to this newer software โ€ข Hardware โ€“ Pentium D desktop computers โ€ข 3.4 GHz processing speed โ€ข 2 GB RAM โ€ข Windows XP operating system โ€“ PCs connected via local area network โ€“ Oracle 11g database WAOB Geographic Information System Agricultural Weather Assessments Agricultural Weather Assessments World Agricultural Outlook Board World Agricultural Outlook Board
  • 5. 1. Manually generate maps of important agricultural & meteorological variables 2. Automate product creation to maximum extent possible 3. Overlay & analyze agrometeorological data sets, establish relationships, & determine impacts where applicable GIS Activities CA AZ NM TX LA AR MS AL FL Ver. Puebla Zacatecas Sinaloa Colima Tab. Campeche Quintana Roo Yucatan Chiapas Oaxaca Guerrero Mich. Jalisco Nayarit San Luis Potosi Tamaulipas Nuevo Leon Baja Sur B aja Norte Coahuila Durango Chihuahua Sonora PACIFIC OC EAN GULF OF MEXICO GU AT. BELIZE HONDURAS EL SAL. NICARAGU A Percent of N orm al < 25 % 25 - 50 % 50 - 75 % 75 - 100 % 100 - 150 % 150 - 200 % 200 - 400 % > 400 % Precip. = 0 Percent of N orm al < 25 % 25 - 50 % 50 - 75 % 75 - 100 % 100 - 150 % 150 - 200 % 200 - 400 % > 400 % Precip. = 0 USDA World Agricultural Outlook Board Mexico Percent of Normal Precipitation May 1, 2002 - December 31, 2002 1 5.8 1.78 0.44 1.69 0.83 0.16 4.36 0.73 1.05 4.26 0.23 0.4 0.9 0.32 1.02 0.43 0.37 0.01 0.43 2.23 0.43 1.87 2.57 3.55 0.85 5.73 0.43 3.38 0.43 0.43 3.22 5.97 0.37 0.13 0.43 2.37 0.43 0.02 0.48 2.78 2.46 0.79 0.89 0.43 0 0 0 0.2 0.37 0.12 1.59 0.37 0.37 0.43 0.37 0.37 0.44 2.44 0.37 0.37 0.15 0.22 2.07 0.37 0.37 0.43 0.06 0.43 0.37 0.77 0.43 0.02 0.43 0.37 10.62 1.51 0.43 Tropical Storm Gaston Rainfall in Mid-Atlantic Cotton Growing Areas World Agricultural Outlook Board Joint Agricultural Weather Facility Virginia North Carolina South Carolina Atlantic Ocean Cotton Percent Bolls Opening North Carolina South Carolina 34% 20% Data obtained from NASS weekly Crop Progress report (released August 30, 2004) Virginia 54% # Charleston Raleigh Wilmington Richmond Norfolk 8 PM, Saturday, Aug 29 - 8 AM, Tuesday, Aug 31 (Rainfall reported in inches) Legend Major Growing Areas Minor Growing Areas Storm Track (general) Agricultural Weather Assessments Agricultural Weather Assessments World Agricultural Outlook Board World Agricultural Outlook Board
  • 6. manual laborโ€ฆ Agricultural Weather Assessments Agricultural Weather Assessments World Agricultural Outlook Board World Agricultural Outlook Board GIS Activities
  • 7. Crop Production Data โ€“ Internet NASS crop production data posted on the Internet Agricultural Weather Assessments Agricultural Weather Assessments World Agricultural Outlook Board World Agricultural Outlook Board
  • 8. Crop Production Data โ€“ Excel Data can be converted into a GIS-compatible format using a spreadsheet Agricultural Weather Assessments Agricultural Weather Assessments World Agricultural Outlook Board World Agricultural Outlook Board
  • 9. Crop Production Data โ€“ ArcView Agricultural data can then be imported into GIS and mapped Agricultural Weather Assessments Agricultural Weather Assessments World Agricultural Outlook Board World Agricultural Outlook Board
  • 10. Crop Maps โ€“ United States Agricultural Weather Assessments Agricultural Weather Assessments World Agricultural Outlook Board World Agricultural Outlook Board
  • 11. Crop Maps โ€“ United States Agricultural Weather Assessments Agricultural Weather Assessments World Agricultural Outlook Board World Agricultural Outlook Board
  • 12. Crop Maps โ€“ Brazil Agricultural Weather Assessments Agricultural Weather Assessments World Agricultural Outlook Board World Agricultural Outlook Board
  • 13. Crop Maps โ€“ Russia Russia: Wheat JOINT AGRICULTURAL WEATHER FACILITY (JAWF) Major growing areas Minor growing areas Legend Percentages indicate each region's contribution to total national production. Regions not numbered contribute less than 1% to the national total. 22 8 26 28 15 Siberia Region Urals Region Northern Region Volga Region Central Region Southern Region Russia Ukraine Belarus Kazakhstan Area depicted in map above Lakes FEB MAR Wheat crop calendar for most of Russia JAN MAY MAR APR DEC AUG JUN JUL SEP OCT NOV PLANT PLANT HEAD HEAD HARVEST HARVEST # # Major and minor growing areas combined account for 99% of total national production Major growing areas combined account for 75% of total national production Major and minor growing areas and country production percentages based upon averaged oblast-level data from 1996-2000. # Source: Sovecon Agrokhleb Bulletin Statistics and Forecasts February 18, 2003 Issue No.4 (41), 2002. Pink = spring wheat Blue = winter w heat Agricultural Weather Assessments Agricultural Weather Assessments World Agricultural Outlook Board World Agricultural Outlook Board
  • 14. โ€ข Crop production areas shift slowly over time, thus maps of major crop areas are updated infrequently โ€“ automated updates not necessary โ€ข In contrast, crop progress & conditions vary on much shorter time scales, requiring more frequent map updates โ€“ manual map production can be time consuming and tedious if a large number of products are required โ€ข Automation is necessary to effectively and efficiently produce such products Automating Applications Agricultural Weather Assessments Agricultural Weather Assessments World Agricultural Outlook Board World Agricultural Outlook Board
  • 15. 5 27 24 12 46 75 4 3 47 13 75 12 6 13 7 67 75 0 National Progress Since last week Versus 5-yr average Behind the 5-yr average by at least 15 percentage points Ahead of the 5-yr average by at least 15 percentage points # # Joint Agricultural Weather Facility (JAWF) U.S. Corn Progress U.S. Corn Progress Portion of Crop Mature Portion of Crop Mature September 2, 2001 September 2, 2001 Mature Mature 20 20 +8 +8 +4 +4 Crop Progress & Condition Maps Crop progress and condition maps previously prepared by hand Agricultural Weather Assessments Agricultural Weather Assessments World Agricultural Outlook Board World Agricultural Outlook Board
  • 16. VBA Macros โ€ข Object-oriented programming language, enables users to automate various tasks associated with mapping โ€ข Examples of automation: โ€“ importing data โ€“ spatial analysis (e.g., contouring) โ€“ defining map scale/extent โ€“ annotation โ€“ creating a map legend โ€“ exporting/printing a map Agricultural Weather Assessments Agricultural Weather Assessments World Agricultural Outlook Board World Agricultural Outlook Board
  • 17. Crop Progress & Condition Maps Programming significantly reduces product generation time and ensures product consistency from run-to-run Agricultural Weather Assessments Agricultural Weather Assessments World Agricultural Outlook Board World Agricultural Outlook Board
  • 18. Crop Progress & Condition Maps Once initial programming accomplished, often little additional code needed to expand/enhance suite of products Agricultural Weather Assessments Agricultural Weather Assessments World Agricultural Outlook Board World Agricultural Outlook Board
  • 19. Crop Progress & Condition Maps Agricultural Weather Assessments Agricultural Weather Assessments World Agricultural Outlook Board World Agricultural Outlook Board
  • 20. Crop Progress & Condition Maps Agricultural Weather Assessments Agricultural Weather Assessments World Agricultural Outlook Board World Agricultural Outlook Board
  • 21. same principles apply to automating weather analysesโ€ฆ Automating More Applications Agricultural Weather Assessments Agricultural Weather Assessments World Agricultural Outlook Board World Agricultural Outlook Board
  • 22. Maps of Daily Data Blue number = minimum temperature Red number = maximum temperature Green number = precipitation Agricultural Weather Assessments Agricultural Weather Assessments World Agricultural Outlook Board World Agricultural Outlook Board
  • 23. Color Contour Maps Agricultural Weather Assessments Agricultural Weather Assessments World Agricultural Outlook Board World Agricultural Outlook Board CA AZ NM TX LA AR MS AL FL Ver. Puebla Zacatecas Sinaloa Colima Tab. Campeche Quintana Roo Yucatan Chiapas Oaxaca Guerrero Mich. Jalisco Nayarit San Luis Potosi Tamaulipas Nuevo Leon Baja Sur B aja Norte Coahuila Durango Chihuahua Sonora PACIFIC OC EAN GULF OF MEXICO GU AT. BELIZE HONDURAS EL SAL. NICARAGU A Precipitation (m m ) 0 - 1 1 - 10 10 - 25 25 - 50 50 - 100 100 - 200 200 - 400 400 - 1000 1000 + Precipitation (m m ) 0 - 1 1 - 10 10 - 25 25 - 50 50 - 100 100 - 200 200 - 400 400 - 1000 1000 + USDA World Agricultural Outlook Board Mexico Total Precipitation (mm ) October 11, 2009 - October 17, 2009
  • 24. Color Contour Maps Agricultural Weather Assessments Agricultural Weather Assessments World Agricultural Outlook Board World Agricultural Outlook Board Western Australia Northern Territory South Australia Queensland New South Wales Victoria Tas. Java INDONESIA Coral Sea Gulf of Carpentaria Timor Sea INDIAN OCEAN INDIAN OCEAN Australia Total Precipitation (mm) August 30, 2010 - September 5, 2010 25 to 50 75 to 100 125 to 150 200 to 225 250 to 275 50 to 75 100 to 125 175 to 200 225 to 250 275 to 300 150 to 175 300 to 350 400 to 450 500 to 600 350 to 400 450 to 500 600 to 800 Above 800 Precipitation (mm) 0 to 1 5 to 10 1 to 5 10 to 25 Agricultural Weather Assessments World Agricultural Outlook Board Data Source: Supplemental
  • 25. Crop Moisture Index Agricultural Weather Assessments Agricultural Weather Assessments World Agricultural Outlook Board World Agricultural Outlook Board
  • 26. MODIS Crop Condition Analyses Western Australia September 3, 2007 Western Australia September 2, 2008 Agricultural Weather Assessments Agricultural Weather Assessments World Agricultural Outlook Board World Agricultural Outlook Board
  • 27. MODIS Winterkill Analyses Agricultural Weather Assessments Agricultural Weather Assessments World Agricultural Outlook Board World Agricultural Outlook Board
  • 28. real power in GIS is ability to overlay and analyze multiple data setsโ€ฆ Overlaying & Analyzing Data Agricultural Weather Assessments Agricultural Weather Assessments World Agricultural Outlook Board World Agricultural Outlook Board
  • 29.
  • 30.
  • 31.
  • 32. Percent of Cotton Bolls Percent of Cotton Bolls Open by Sep 26 Open by Sep 26 TOP ## = Percent Bolls Open TOP ## = Percent Bolls Open [BOTTOM ##] = Change from [BOTTOM ##] = Change from 5-yr average 5-yr average Data Sources: - Rainfall estimates obtained from the National Weather Service - Agricultural areas are delineated using NASS county-level crop data 84 84 [+10] [+10] 92 92 [+22] [+22] 81 81 [+8] [+8] 91 91 [+8] [+8] 71 71 [-14] [-14] 95 95 [+12] [+12] Major Cotton Areas Minor Cotton Areas 8 AM EDT Sep 25, 2010 - 8 AM EDT Oct 2, 2010 Remnants of Nicole combine with a front to soak East Coast cotton Rainfall (inches) 0.1 - 1.0 1.0 - 2.0 2.0 - 4.0 4.0 - 6.0 10.0 - 16.0 6.0 - 8.0 8.0 - 10.0 More than 16.0 Agricultural Weather Assessments Agricultural Weather Assessments World Agricultural Outlook Board World Agricultural Outlook Board
  • 33.
  • 34.
  • 35. Thank You ! Agricultural Weather Assessments Agricultural Weather Assessments World Agricultural Outlook Board World Agricultural Outlook Board