![Industry on the Move ,[object Object],[object Object]](data:image/gif;base64,R0lGODlhAQABAIAAAAAAAP///yH5BAEAAAAALAAAAAABAAEAAAIBRAA7)
Recommended
More Related Content
Similar to Usa-eu-kina-statistikk
Similar to Usa-eu-kina-statistikk (14)
Usa-eu-kina-statistikk
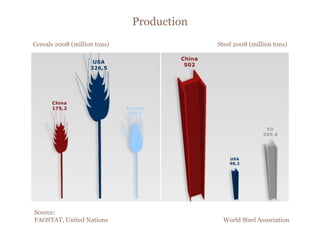
- 1. Production Cereals 2008 (million tons) Steel 2008 (million tons) Source: FAOSTAT, United Nations World Steel Association
- 3. High Tech Exports and Growth World market share in high tech exports in percent, 2006 Average annual growth rate of high tech exports 2001-2006 … in million Euros Source: Eurostat
- 4. Macro Eonomic Indicators (2009) GDP per person (in dollar) GDP (in dollar) Source: CIA World Factbook
- 5. Imports and Exports Imports in Billion Dollars (China, US: 2008; EU: 2007 including intra-EU trade) Chinese Imports from the US: 7.6 % US imports from China: 16.5 % Exports in Billion Dollars (China, US: 2008; EU: 2007, including intra-EU trade Chinese Exports to the US: 17.7 % US Exports to China: 5.5 % Source: CIA World Factbook
- 6. Source: The Economist (end 2010) Big-Mac-Index Price for a McDonald ‘ s Big Mac in Dollar By this yardstick and measured against the dollar the currency would be: Yuan: 49 % undervalued Euro: 29 % overvalued China USA Euro-zone
- 8. CO2 Emissions Annual emissions in million tons (world wide emission: 28.4) Portion of world wide emissions (in percent) per capita CO2 emissions in tons (2006) Source: United Nations
- 9. Military Budget in billion dollars (2008) Missiles (for the EU: France 300, UK 192) Soldiers Sources: SIPRI, European Council on Foreign relations Federation of American Scientists, The Guardian