
Recommended
Recommended
More Related Content
Similar to Comparative and Absolute AdvantageGermanyPopulation 8.docx
Similar to Comparative and Absolute AdvantageGermanyPopulation 8.docx (20)
More from janthony65
More from janthony65 (20)
Recently uploaded
Recently uploaded (20)
Comparative and Absolute AdvantageGermanyPopulation 8.docx
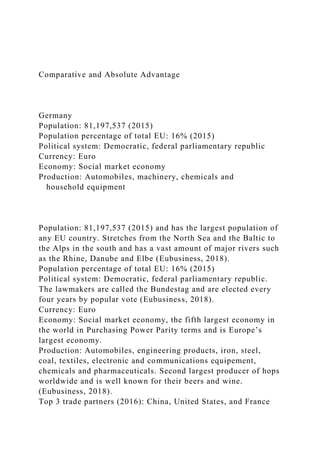
- 1. Comparative and Absolute Advantage Germany Population: 81,197,537 (2015) Population percentage of total EU: 16% (2015) Political system: Democratic, federal parliamentary republic Currency: Euro Economy: Social market economy Production: Automobiles, machinery, chemicals and household equipment Population: 81,197,537 (2015) and has the largest population of any EU country. Stretches from the North Sea and the Baltic to the Alps in the south and has a vast amount of major rivers such as the Rhine, Danube and Elbe (Eubusiness, 2018). Population percentage of total EU: 16% (2015) Political system: Democratic, federal parliamentary republic. The lawmakers are called the Bundestag and are elected every four years by popular vote (Eubusiness, 2018). Currency: Euro Economy: Social market economy, the fifth largest economy in the world in Purchasing Power Parity terms and is Europe’s largest economy. Production: Automobiles, engineering products, iron, steel, coal, textiles, electronic and communications equipement, chemicals and pharmaceuticals. Second largest producer of hops worldwide and is well known for their beers and wine. (Eubusiness, 2018). Top 3 trade partners (2016): China, United States, and France
- 2. (Eubusiness, 2018). 2 Germany’s Real GDP Real GDP first quarter 2018 739, 896.7 Millions of Chained 2010 Euros First quarter 2009 615,666.8 Millions of Chained 2010 Euros (Federal Reserve Bank of St. Louis, 2018) 3 Germany's Real GDP First Quarter 2009 Category 1 615666.80000000005 First Quarter 2018 Category 1 739896.7 Chained 2010 Euros Germany’s GDP Percentage Composition Agriculture- milk, pork, beef, cereals, potatoes, wheat. Southern and western Germany are known for their wine. Bavaria produces much of the countries beer production. Services- the construction industry, wholesale and retail,
- 3. logistics, consulting industry, financial services, the hotel and catering industry, real estate, health servides, creative industry, education and public services. Industry- machine tools, solar power and turbine wind power, electrical engineering, iron, steel, chemicals and optics. Manufacturing- automotive, household products (The World Bank Data, 2018) 4 Germany’s Consumer Price Index Germany CPI Annual 2009 98.90000 Index 2010=100 Annual 2017 109.27500 Index 2010=100 (FRED, 2018) 5 Germany's Annual CPI 2009 98.9 2017 109.27500000000001 INDEX 2010=100
- 4. Germany’s Real Exports Germany Real Exports 1st Quarter 2018 136.92659 Index 2010=100 Seasonally Adjusted 1st Quarter 2009 85.38521 Index 2010=100 Seasonally Adjusted (Federal Reserve Bank of St. Louis, 2018) Top ten exports in 2017 Vehicles: US$257.2 billion (17.8% of total exports) Machinery including computers: $245.4 billion (17%) Electrical machinery, equipment: $148.8 billion (10.3%) Pharmaceuticals: $84.1 billion (5.8%) Optical, technical, medical apparatus: $72.8 billion (5%) Plastics, plastic articles: $63.6 billion (4.4%) Aircraft, spacecraft: $41.8 billion (2.9%) Articles of iron or steel: $30.5 billion (2.1%) Mineral fuels including oil: $26.8 billion (1.9%) Iron, steel: $26.4 billion (1.8%) (Eubusiness, 2018) 6 Germany's Real Exports First Quarter 2009 85.385210000000001 First Quarter 2018 136.92659 Quarterly Index 2010=100 Seasonally Adjusted
- 5. Germany’s Real Imports Germany Real Imports of Goods and Services 1st Quarter 2018 133.67081 Index 2010=100 Seasonally Adjusted 1st Quarter 2009 90.34226 Index 2010=100 Seasonally Adjusted (The World Bank Data, 2018) Top 10 Imports of 2017 Machinery including computers: US$148.5 billion (12.7% of total imports) Electrical machinery, equipment: $145.7 billion (12.5%) Vehicles : $123.2 billion (10.5%) Mineral fuels including oil: $96.2 billion (8.2%) Pharmaceuticals: $53.6 billion (4.6%) Plastics, plastic articles: $44.4 billion (3.8%) Optical, technical, medical apparatus: $40.3 billion (3.4%) Organic chemicals: $34.1 billion (2.9%) Iron, steel: $29 billion (2.5%) Articles of iron or steel: $23.3 billion (2%) (Eubusiness, 2018) 7 Germany's Real Imports First Quarter 2009 Quarterly 90.342259999999996 First Quarter 2018 Quarterly 133.67080999999999 Index 2010=100 Seasonally Adjusted
- 6. Germany’s Unemployment Rate 2018 Unemployment Rate 5.3% 2009 Unemployment Rate 8.1% (Statista, 2018) 8 Germany's Unemployment Rate 2009 Year 8.1000000000000003E-2 2018 Year 5.2999999999999999E-2 Unemployment Percentages Germany’s Industrial Production Industrial Production May 2018 3.14% December 2009 -16.3% (CEIC Data, 2018) 9 Germany's Industrial Production
- 7. 2009 -0.16300000000000001 2018 3.1399999999999997E-2 Percentage of Production References CEIC Data. (2018). Germany Industrial Production. Retrieved from https://www.ceicdata.com/en/indicator/germany/industrial- production- index-growth Eubusiness. (2018). Germany: country overview. Retrieved from https://www.eubusiness.com/europe/germany Federal Reserve Bank of St. Louis. (2018). Real Gross Domestic Product for Germany. Retrieved from https://fred.stlouisfed.org/series/CLVMNACSCAB1GQDE Federal Reserve Bank of St. Louis. (2018). Exports of Goods and Services for Germany. Retrieved from https://fred.stlouisfed.org/series/NAEXKP06DEQ661S FRED. (2018). Consumer Price Index of All Items in Germany. Retrieved from https://fred.stlouisfed.org/series/DEUCPIALLMINMEI#0 Statista. (2018). Germany Unemployment Rate. Retrieved from https://www.statista.com/statistics/227005/unemployment- rate-in-germany/ The World Bank Data. (2018). Imports of Goods and Services Germany. Retrieved from https://data.worldbank.org/indicator/BM.GSR.TOTL.CD?lo cations=DE&view=chart
- 8. References Cont. CEIC. (2018). United Kingdom Industrial Production Index Growth. Retrieved from: https://www.ceicdata.com/en. Federal Reserve Bank of St. Louis. (2018). Economic Research, Consumer Price Index of all Items in the United Kingdom. Retrieved from: https:/fred/stlouisfed.org/series//GBRCPIALLMINMEI. FocusEconomics. (2018). Gross Domestic Product in United Kingdom. Retrieved from: McConnell, C.R., Brue, S.L., & Flynn, S.M. (2015) Economics: Principles, problems, and policies (20th ed). Boston, MA: McGraw- Hill/Irwin. Organization for Economic Co-operation and Development, Production of Total Industry in France [FRAPROINDQISMEI], retrieved from FRED, Federal Reserve Bank of St. Louis; https://fred.stlouisfed.org/series/FRAPROINDQISMEI, September 9, 2018. Organization for Economic Co-operation and Development, Unemployment Rate: Aged 15-74: All Persons for France [LRUN74TTFRQ156N], retrieved from FRED, Federal Reserve Bank of St. Louis; https://fred.stlouisfed.org/series/LRUN74TTFRQ156N, September 7, 2018. Statista. (2018). United Kingdom: Real Gross Domestic Product (GDP) growth rate from 2012 to 2022 (compared to previous year). Retrieved from: https: statista.com/statistics/263613/gross-domestic-product-gdp- growth-rate-in-the-united- kingdom/. Statist. (2018). United Kingdom: Unemployment Rate in the United Kingdom (UK) from 2000 to 2017. Retrieved from: https://www.statista.com/statistics/279898/unemployment- rate-in-the-united-kingdom-uk/. The World Bank. (2018). Exports of Goods and Services United Kingdom. The World Bank Data. (2018). Imports of Goods and Services
- 9. United Kingdom. Retrieved from https://data.worldbank.org/indicator/BM.GSR.TOTL.CD?lo cations=DE&view=chart 1 10Comparative and Absolute Advantage ECO/561 2017Comparative and Absolute Advantage Comparative and absolute advantage of products, help influence the national output for a nation. Understanding the difference between these and the type of advantage a nation has will help to show the overall economic growth of each country. Knowing where the nation falls in the business lifecycle can help to forecast future economic growth and what needs to be done in order to achieve that economic growth. This paper compares four countries and the GDP and lifecycle stages for those countries in order to show the economic growth for each nation. Measures of Economic Growth/Comparative and Absolute Advantage GDP 2016 data from Tradingeconomics.com, show the ranking of the following countries. Based on the 2016 numbers, only China and the United States (U.S.) show positive changes (increase) in GDP compared to previous measurements; whereas, the Democratic Republic of Congo and Saudi Arabia show a decrease. China’s continued growth since opening doors to economic reforms in 1978 “lifted 500 million Chinese out of poverty,”
- 10. and in 2012 the country hit a trade surplus of $319.92 million (Jain, 2014). Scholarly studies state China’s cheap labor continues to be its comparative advantage (Chun, 2014). China bases absolute power on low-cost manufacturing of products. In comparison, articles state the relative benefit of the U.S is the ability to attract higher paying jobs (Strosko, 2016); whereas absolute position is in the production of wheat. The Democratic Republic of Congo's natural resource is its comparative advantage, and its agricultural products are the country's absolute position. As far as Saudi Arabia, comparative and absolute advantage is the oil reserves. Economic, Political, and Cultural Development Research The U.S. has the most technologically powerful economy in the world, with a per capita GDP of $54,800. In the hierarchy, Congress makes the laws. As stated by the author Claude Fischer, “the United States cultural can be captured by the word more (Fischer, 2010).” Mr. Fischer further states that “Modern Americans have more of almost everything: more time on Earth, more wealth, more things, more information, more power, more acquaintances, and so many more choices (Fischer, 2010).” One could say that the American cultural has evolved at a high rate of speed over time. China currently is considered the largest exporter in the world. However, it became necessary for China to expand the private sector and develop a better banking system for international trade. Based on research in 2015, "China stood as the largest economy in the world, surpassing the U.S. for the first time in modern history. China's per capita income is below the global average (CIA.gov, 2017a)." As of 2015, the world average per capita income is 10,057.926 (World Bank, 2015). China's political and cultural development is based on socialism, where the government has control over the "free" market. As stated in part, by the staff writer at Independenceday.com, “China is a socialist country, directed by the people. The worker-peasant
- 11. union and practicing people's democratic centralism, is the primary system in the country (Independenceday.com 1999).” Saudi Arabia's economy has an abundance of oil. The country possesses about 16% of the world's proven petroleum reserves (CIA.gov, 2017b). Saudi Arabia is also currently the leading exporter of said oil. Saudi Arabia's political development is Islamic, "one nation, one ruler" monarchy. The leader sets social standards and rules all, including government. The Democratic Republic of Congo (DRC) is a nation possessing numerous natural resources. The DRC political development rests on a Republic government. As stated by the staff writer at Everyculture.com, "The government is what some have called a "kleptocratic" dictatorship, in which the constitution and separate executive, legislative, and judicial branches existed on paper only (Everyculture.com. 2017).” Comparison of Country Economic Data The gross domestic product is perhaps the best way to measure our national level earnings. It becomes a lot harder to account for every dollar spent, however some variables that indicate GDP growth are imports, exports, and wages. Having understood how the national output generates provides the bases for how the concept operates, and how products are produced and how each product is included and/or excluded. Some variables are wages and employment rate. This helps to account for the national output. Although the national growth is, for the most part, healthy since 2008, studies show that the GDP growth has decreased by two points when contrasted to other countries like Ireland. In addition, in past years the United States is in second place, and presently has declined by three percent. The U.S. GDP generated significant earnings in the past two years with substantial growth. However, if this was to be compared to prior years, the last few years show a large
- 12. decrease. When income is combined, this appears stable and China appears to be a great competitor, in the long run. China shows an exponential growth between 2009 and 2050. The United States will eventually become third in the long-term for their own Domestic Gross Products earnings due to regulatory measures by the Central and Federal reserve growth. Between 1972– 2015 data shows an increase from 4.2-15.4. With this projection the gross domestic is not being excluded individually. By compounding the data, there should be a better understanding of how complex data shows the GDP. Although most data growth since the year of 2008 until 2016 is, for the most part, the same; the sharpest increase was in the years of 2008 to 17 percent growth. This is 7 points above since 1990 which was 10.5. Reasons for Varied Economic Growth The United States’ current growth rate is 1.9% (U. S. Department of Commerce, BEA & Bureau of Economic Analysis, n.d.). It has recovered steadily from the 2009 recession. China’s continuous growth rate is 6.8%. This may give the perception of being the world’s leading economy; however, when GDP is compared, 2009 numbers show the U.S. GDP was $15 trillion and China was $5 trillion (Scissors, 2011). Despite having a population four times that of the U.S., growth rate depends on trade and the global market for manufactured products. Saudi Arabia, on the other hand, has seen a GDP decline to 11% according to 2016 numbers (U.S Bureau of Economic Analysis, n.d.). This may be due to the continuing decline in crude oil prices. With 73% of the government's budget dependent on crude oil prices, Saudi Arabia’s budget deficit increased (Grennes, Strazds, 2016). The Democratic Republic of Congo has the potential to become one of Africa's richest countries. Despite the comprehensive natural resources, continued political uncertainty has a direct effect on the economy. Also, the global economic recession saw a
- 13. decrease in the demand for Congo's minerals (Democratic Republic of Congo Overview, 2016). Economic Lifecycle Stages Economic lifecycle stages fall in four phases of economic growth and decline: contraction, trough, expansion, and peak. The economic life cycle of the U.S. is the expansion stage. As the U.S. is entering a phase where recession is over; and the country is entering a market of recovery based on the GDP, income and employment increases. Based on the GDP for Saudi Arabia, the economic lifecycle is expansion as the GDP is over 3%. However, as the GDP is showing a decline, the expansion phase could slowly result in a contraction and/or trough as the GDP declines. China’s economic lifecycle is at peak stage as the GDP is over 6% change. Finally, the Democratic Republic of the Congo is in the trough stage. The GDP is nonexistent for this country. Products with Comparative/Absolute Advantage The U.S. has an absolute advantage in trade with certain agricultural goods and textile products. The U.S. can produce agricultural products such as corn, for example, more efficiently than others because of vast land, prime soil and advanced industry technology. This results in enormous output and limited inputs, equaling absolute advantage (McConnell, Brue, & Flynn, 2015). The U.S. has attained comparative advantage in exporting products such as industry machinery, crude and refined petroleum, vehicles, and pharmaceuticals. The U.S. has an extensive list of products earning a solidified comparative advantage. The U.S. can manufacture large amounts while limiting opportunity costs because of organic materials, equipment, technology, etc. (Neary, 2003). China has earned full advantage with manufactured goods in
- 14. general when it comes to international trade. China also has comparative trade advantage with products such as electronics and vehicles. China has built a strong export business position primarily because of an extremely low cost of labor. The entire major manufacturing and production cost reduction has attracted countries from around the world to have products manufactured in China. "China's trade pattern is influenced not just by its overall comparative advantage in labor-intensive goods but also by geography" (Harrigan, & Deng, 2008, pg. 1). China uses its local for shipping and distribution of products worldwide to its maximum advantage. Saudi Arabia owns global trade absolute advantage in crude oil and gasoline products. Without a doubt, Saudi Arabia has a comparative advantage with the trading of polypropylene and various refined crude oil products. Saudi Arabia not only has an endless abundance of crude oil natural resources but can retrieve crude oil in mass quantities and expeditiously faster than anyone in the world. Saudi Arabia is also thoroughly proficient in refining crude oil into numerous petroleum based products for trade export. The country of Saudi Arabia is also becoming a serious contender and gaining competitive advantage in the transportation shipping industry (Jasimuddin, 2001). The Democratic Republic of Congo could but does not have an absolute advantage in any particular product for international trade. The Democratic Republic of Congo does have somewhat of a similar lead with trading products such as diamonds, copper, timber, and coffee. Although the Democratic Republic of Congo is plentiful in certain products, the country is in political turmoil and embellished within the internal conflict. The current state of corruption leaves the country as a whole struggling to establish infrastructure and evade common criticism. The harsh internal retaliation makes it almost impossible for economic development within the business cycle
- 15. or advancement within the global market (Eaton, & Kortum, 2002). Conclusion Based on the information provided on China, the U.S., Saudi Arabia, and the Democratic Republic of the Congo, the economic growth, comparative/absolute advantages, and lifecycle stages are identified. Comparisons are provided based on the information gleaned through research. The various information helps to further identify how the international economy fluctuates. References Central Intelligence Agency Library. (2017a). China’s economy. Retrieved from https://www.cia.gov/library/publications/resources/the-world- factbook/geos/ch.html Central Intelligence Agency Library. (2017b). Saudi Arabia economy. Retrieved from https://www.cia.gov/library/publications/resources/the-world- factbook/geos/sa.html Central Intelligence Agency Library. (2017c). United States economy. Retrieved from https://www.cia.gov/library/publications/the-world- factbook/geos/us.html Chun, Li. (2014). What is China's comparative advantage? The Chinese Economy, 36(2), 3-20. Retrieved from http://www.tandfonline.com/doi/abs/10.1080/10971475.2003.11 033463 Eaton, J., & Kortum, S. (2002). Technology, geography, and trade. Econometrica, 70(5), 1741-1779. Retrieved from https://search.proquest.com/docview/203877909?accountid=458
- 16. Everyculture.com. (2017). The Democratic Republic of Congo. Retrieved from http://www.everyculture.com/Bo- Co/Democratic-Republic-of-the-Congo.html Fischer, C. (2010). Made in America: A social history of American culture and character. Retrieved from http://press.uchicago.edu/Misc/Chicago/251431.html Grennes, T., & Strazds, A. (2016). The Saudi Arabia oil shock: Crisis and opportunity for economic reform. Roubini's: Economic Reform. Retrieved from http://www.economonitor.com/blog/2016/06/the-saudi-arabia- oil-shock-crisis-and-opportunity-for-economic-reform/ Harrigan, J., & Deng, H. (2008). China’s local comparative advantage. National Bureau of Economic Research, WP(13963), 1-32. Retrieved from http://www.nber.org/papers/w13963 Independenceday.com. (1999). Political system of China. Retrieved from http://www.123independenceday.com/china/political- system.html Jain, R. (2014). China’s march to consumption-based growth: Compulsion, measures, and constraints. Journal of Third World Studies, 31(1), 219-234. Retrieved from https://search.proquest.com/docview/1554318185?accountid=45 8 Jasimuddin, S. M. (2001). Analyzing the competitive advantages of Saudi Arabia with Porter’s model. Journal of Business & Industrial Marketing, 16(1), 59 - 68. doi:10.1108/08858620110365007 McConnell, C. R., Brue, S. L., & Flynn, S. M. (2015)
- 17. Economics: Principles, problems, and policies (20th ed.). Boston, MA: McGraw-Hill/Irwin. Neary, J. P. (2003). Competitive versus comparative advantage. World Economy, 26(4), 457-470. doi:10.1111/1467-9701.00532 Scissors, D. (2011). The United States vs. China - Which economy is bigger, which is better. Retrieved from http://www.heritage.org/report/the-united-states-vs-china- which-economy-bigger-which-better Strosko, S. (2016). The comparative advantage the U.S. economy. The Liberty Conservative. Retrieved from http://www.thelibertyconservative.com/comparative-advantage- u-s-economy/ Tradingeconomics.com. (n.d.). Chart. Retrieved from http://www.tradingeconomics.com/united-states/gdp-growth U. S. Bureau of Economic Analysis. (2017). United States GDP growth rate. Retrieved from http://www.tradingeconomics.com/united-states/gdp-growth U.S. Department of Commerce, BEA, Bureau of Economic Analysis. (n.d.). U.S. economy at a Glance: Perspective from the BEA accounts. Retrieved from https://www.bea.gov/newsreleases/glance.htm World Bank. (2016, October 24). The Democratic Republic of Congo Overview. Retrieved from https://www.worldbank.org/en/country/drc/overview World Bank. (2015). GDP per capita. Retrieved from http://data.worldbank.org/indicator/NY.GDP.PCAP.CD