APS College ofEngineering,
(Affiliated to Visvesvaraya Technological University and Approved by AICTE, NAAC Accredited)
Somanahalli, Kanakapura Main Road, Bengaluru-560116
Department of Electronics and Communication Engineering
Subject Name: Digital Image Processing
Subject Code: 21EC732
Semester : 8th
Academic Year: EVEN 2024-2025
Faculty Name: Dr. Naik D C
Assistant Professor,
Dept., of E&CE.
2.
Institute Vision
To educate,train and inspire all students to become competent technocrats and help them to emerge as leaders
in every field of engineering and to fill their hearts and minds with values of excellence in all their
professional pursuits.
Department Vision
To impart value-based quality technical education in Electronics and Communication Engineering by
empowering the students with research and teamwork capabilities and making them to work for Global needs.
Institute Mission
M1: To provide an excellent infrastructure and conducive ambience in the institute.
M2: To impart quality technical education combined with ethical values.
M3: To inculcate attitude for research and developmental activities
M4: To have a legacy for development of next level engineers and technologies.
Department Mission
M1: To provide superior learning experience with state of art laboratories, competent staff and industry driven
skill development thereby improving employability with agility.
M2: To keep abreast with latest technological advancements through innovations and research work, nurture
entrepreneurial and leadership skills.
M3: To inculcate professional ethics and responsible engineering practices to meet societal needs.
3.
Program Outcomes Suggestedby the NBA for Engineering Programs
PO1. Engineering knowledge: Apply the knowledge of mathematics, science, engineering fundamentals, and an engineering specialization to
the solution of complex engineering problems.
PO2. Problem analysis: Identify, formulate, research literature, and analyze complex engineering problems reaching substantiated conclusions
using first principles of mathematics, natural sciences, and engineering sciences.
PO3. Design/development of solutions: Design solutions for complex engineering problems and design system components or processes that
meet the specified needs with appropriate consideration for the public health and safety, and the cultural, societal, and environmental
considerations.
PO4. Conduct investigations of complex problems: Use research-based knowledge and research methods including design of experiments,
analysis and interpretation of data, and synthesis of the information to provide valid conclusions.
PO5. Modern tool usage: Create, select, and apply appropriate techniques, resources, and modern engineering and IT tools including prediction
and modeling to complex engineering activities with an understanding of the limitations.
PO6. The engineer and society: Apply reasoning informed by the contextual knowledge to assess societal, health, safety, legal and cultural
issues and the consequent responsibilities relevant to the professional engineering practice.
PO7. Environment and sustainability: Understand the impact of the professional engineering solutions in societal and environmental contexts,
and demonstrate the knowledge of, and need for sustainable development.
PO8. Ethics: Apply ethical principles and commit to professional ethics and responsibilities and norms of the engineering practice.
PO9. Individual and team work: Function effectively as an individual, and as member or leader in diverse teams, and in multidisciplinary
settings.
PO10. Communication: Communicate effectively on complex engineering activities with the engineering community and with the society at
large, such as, being able to comprehend and write effective reports and design documentation, make effective presentations, and give and
receive clear instructions.
PO11. Project management and finance: Demonstrate knowledge understanding of the engineering and management principles and apply
these to one’s own work, as a member and leader in a team, to manage projects and in multidisciplinary environments.
PO12. Life-long learning: Recognize the need for, and have the preparation and ability to engage in independent and life-long learning in the
broadest context of technological change.
4.
Course objectives:
CO1: Understandthe fundamentals of digital image processing.
CO2: Understand the image transform used in digital image processing.
CO3: Understand the image enhancement techniques in spatial domain used in
digital image processing.
CO4: Understand the Color Image Processing and frequency domain
enhancement techniques in digital image processing.
CO5: Understand the image restoration techniques and methods used in digital
image processing.
5.
Text Book:
1. DigitalImage Processing- Rafael C Gonzalez and Richard E.
Woods, PHI 3rd Edition, 2010.
2. Fundamentals of Digital Image Processing-A. K. Jain, Pearson
2004.
Reference Books:
3. Digital Image Processing- S. Jayaraman, S. Esakkirajan, T.
Veerakumar, Tata McGraw Hill 2014.
6.
Module 1
Digital ImageFundamentals: What is Digital Image Processing?,
Origins of Digital Image Processing, Examples of fields that use
DIP, Fundamental Steps in Digital Image Processing,
Components of an Image Processing System, Elements of Visual
Perception, Image Sensing and Acquisition, Image Sampling and
Quantization, Some Basic Relationships Between Pixels.
7.
What Is DigitalImage Processing?
• Image may be defined as a two-dimensional function, f(x, y) where x and y are
spatial (plane) coordinates.
• The amplitude of f at any pair of coordinates (x,y) is called the intensity or gray
level of the image at that point.
• When x, y and the intensity values of f are all finite, discrete quantities, we call
the image a digital image.
• The field of digital image processing refers to processing digital images by
means of a digital computer.
• Digital image is composed of a finite number of elements, each of which has a
particular location and value. These elements are called picture elements, image
elements, pels, and pixels.
8.
• Human Visionis limited to Visible Spectrum. Imaging Machines can cover almost the
entire EM spectrum, ranging from gamma to radio waves.
• They can operate on images generated by sources that humans are not accustomed to
associating with images.
• Eg . Ultrasound, electron microscopy, and computer-generated images.
• 3 types of computerized processes : low-, mid-, and high-level processes.
• Low-level processes- Primitive operations such as image pre-processing to reduce
noise, contrast enhancement, and image sharpening. Both its inputs and outputs are
images.
• Mid-level processes- Tasks such as segmentation (Partitioning), description,
classification (recognition) of individual objects. Inputs generally are images, but its
outputs are attributes extracted from those images (e.g., edges, contours, and the
identity of individual objects).
• Higher-level processing- “making sense” of an ensemble of recognized objects, as in
image analysis, and at the far end of the continuum, performing the cognitive functions
normally associated with vision.
9.
• One ofthe first applications of digital
images was in the newspaper industry.
• Pictures were first sent by submarine cable
between London and New York in the
early 1920s fast transmission.
• Specialized printing equipment coded
pictures for cable transmission and then
reconstructed them at the receiving end.
• Technique was abandoned toward the end
of 1921 in favor of a technique based on
photographic reproduction made from
tapes perforated at the telegraph receiving
terminal.
• The improvements are evident, both in
tonal quality and in resolution.
The Origins of Digital Image Processing
10.
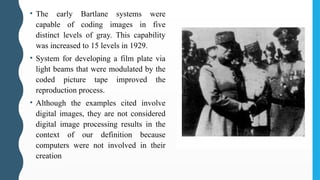
• The earlyBartlane systems were
capable of coding images in five
distinct levels of gray. This capability
was increased to 15 levels in 1929.
• System for developing a film plate via
light beams that were modulated by the
coded picture tape improved the
reproduction process.
• Although the examples cited involve
digital images, they are not considered
digital image processing results in the
context of our definition because
computers were not involved in their
creation
11.
• The firstcomputers powerful enough to carry
out meaningful image processing tasks
appeared in the early 1960s. •
• Work on using computer techniques for
improving images from a space probe began
at the Jet Propulsion Laboratory in 1964
• Pictures of the moon transmitted by Ranger 7
were processed by a computer to correct
various types of image distortion inherent in
the on-board television camera.
• The imaging lessons learned with Ranger 7
were used to enhance and restore images from
the Surveyor missions to the moon, the
Mariner series of flyby missions to Mars, the
Apollo manned flights to the moon, and
others.
12.
• Computer proceduresare used to enhance the contrast or code the intensity levels
into color for easier interpretation of X-rays and other images used in industry,
medicine, and the biological sciences.
• Geographers use the same or similar techniques to study pollution patterns from
aerial and satellite imagery.
• Image enhancement and restoration procedures are used to process degraded
images of unrecoverable objects or experimental results too expensive to
duplicate.
• In archaeology, image processing methods have successfully restored blurred
pictures that were the only available records of rare artefacts lost or damaged after
being photographed.
• In physics and related fields, computer techniques routinely enhance images of
experiments in areas such as high-energy plasmas and electron microscopy.
• Similarly successful applications of image processing concepts can be found in
astronomy, biology, nuclear medicine, law enforcement, defense, and industry.
13.
• The inventionof the transistor at Bell Laboratories in 1948;
• The development in the 1950s and 1960s of the high-level programming languages
COBOL (Common Business-Oriented Language) and FORTRAN (Formula
Translator);
• The invention of the integrated circuit (IC) at Texas Instruments in 1958;
• The development of operating systems in the early 1960s;
• The development of the microprocessor (a single chip consisting of the central
processing unit, memory, and input and output controls) by Intel in the early 1970s;
• Introduction by IBM of the personal computer in 1981; and
• Progressive miniaturization of components, starting with large scale integration (LI) in
the late 1970s, then very large scale integration (VLSI) in the 1980s, to the present use
of ultra large scale integration (ULSI).
14.
Fields that UseDigital Image Processing
• Almost all areas of technology now use DIP in some way or another.
• Oneof the simplest ways to develop a basic understanding of the
extent of image processing applications is to categorize images
according to their source (e.g., visual, X-ray, and so on).
• The principal energy source for images in use today is the
electromagnetic energy spectrum.
• Other important sources of energy include acoustic, ultrasonic, and
electronic (in the form of electron beams used in electron
microscopy).
• Synthetic images, used for modeling and visualization, are generated
by computer.
15.
EM Spectrum Imaging
•Electromagnetic waves - propagating sinusoidal waves of varying
wavelengths OR stream of massless particles, each traveling in a
wavelike pattern and moving at the speed of light.
• Each massless particle contains a certain amount (or bundle) of
energy. Each bundle of energy is called a photon.
• If spectral bands are grouped according to energy per photon, we
obtain the spectrum shown below, ranging from gamma rays (highest
energy) at one end to radio waves (lowest energy) at the other.
16.
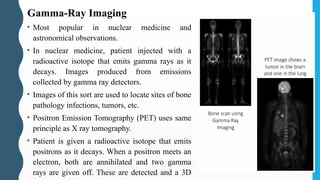
• Most popularin nuclear medicine and
astronomical observations.
• In nuclear medicine, patient injected with a
radioactive isotope that emits gamma rays as it
decays. Images produced from emissions
collected by gamma ray detectors.
• Images of this sort are used to locate sites of bone
pathology infections, tumors, etc.
• Positron Emission Tomography (PET) uses same
principle as X ray tomography.
• Patient is given a radioactive isotope that emits
positrons as it decays. When a positron meets an
electron, both are annihilated and two gamma
rays are given off. These are detected and a 3D
Gamma-Ray Imaging
17.
X-Ray Imaging
• Amongthe oldest sources of EM radiation used for imaging.
• Used in medical diagnostics, industry and other areas like astronomy.
• X-rays for medical and industrial imaging are generated using an X-ray
tube, which is a vacuum tube with a cathode and anode.
• Cathode is heated, causing free electrons to be released. These electrons
flow at high speed to the positively charged anode. When electrons
strike nucleus, energy is released in the form of X-ray radiation.
• The energy of X-rays controlled by anode voltage and by a current
applied to cathode filament.
• Object to be imaged is placed between X-ray source and X ray sensitive
film.
18.
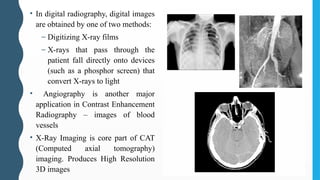
• In digitalradiography, digital images
are obtained by one of two methods:
– Digitizing X-ray films
– X-rays that pass through the
patient fall directly onto devices
(such as a phosphor screen) that
convert X-rays to light
• Angiography is another major
application in Contrast Enhancement
Radiography – images of blood
vessels
• X-Ray Imaging is core part of CAT
(Computed axial tomography)
imaging. Produces High Resolution
3D images
19.
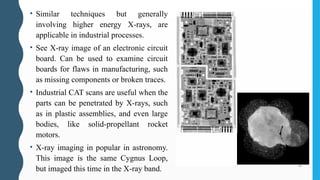
• Similar techniquesbut generally
involving higher energy X-rays, are
applicable in industrial processes.
• See X-ray image of an electronic circuit
board. Can be used to examine circuit
boards for flaws in manufacturing, such
as missing components or broken traces.
• Industrial CAT scans are useful when the
parts can be penetrated by X-rays, such
as in plastic assemblies, and even large
bodies, like solid-propellant rocket
motors.
• X-ray imaging in popular in astronomy.
This image is the same Cygnus Loop,
but imaged this time in the X-ray band.
20.
• Commonly usedin lithography, industrial
inspection, microscopy, lasers, biological
imaging, and observations.
• Fluorescence microscopy- use an
excitation light to irradiate a prepared
specimen. Then, separate the much weaker
radiating fluorescent light from the
brighter excitation light onto dark
background.
• Excellent method for studying materials
that can be made to fluoresce, either in
their natural form (primary fluorescence)
or when treated with chemicals capable of
fluorescing (secondary fluorescence).
Ultraviolet Band Imaging
21.
Visible and InfraredBand Imaging
• Visible Band Imaging– most popular of all.
• IR Band Imaging– used along with Visible Band Imaging.
• Common uses- light microscopy, astronomy, remote sensing, industry, and law
enforcement.
• Light Microscopy– very common in pharmaceuticals and micro inspection to
materials characterization. Processing ranging from enhancement to
measurements.
• Another major area of visual processing is remote sensing, which usually
includes several bands in the visual and infrared regions of the spectrum.
22.
• Multispectral Imagingfrom different EM bands helps immensely in Remote
Sensing .
• Weather observation and prediction also are major applications of multispectral
imaging from satellites.
• A major area of imaging in the visual spectrum is in automated visual inspection
of manufactured goods.
• Image Processing can be used to inspect batches of goods for defects, missing
components, damage, etc.
• Digital Image Processing is commonly used in Law Enforcement in the form of
facial recognition, fingerprint identification, vehicle number plate recognition,
fake currency detection, etc.
24.
Microwave Band Imaging
•Dominant application of imaging in the microwave band is radar.
• Can collect data over virtually any region at any time, regardless of weather or ambient
lighting conditions.
• An imaging radar works provides its own illumination (microwave pulses) to illuminate an
area on the ground and take a snapshot image.
• Instead of a camera lens, a radar uses an antenna and digital computer processing to record
its images.
• In a radar image, one can see only the microwave energy that was reflected back toward the
radar antenna.
• This offers high clarity and detail of the image, unencumbered by clouds or other
atmospheric conditions that normally interfere with images in the visual band.
25.
Radio Band Imaging
•Major applications are in medicine and astronomy.
• In medicine, radio waves are used in Magnetic Resonance Imaging (MRI). This
technique places a patient in a powerful magnet and passes radio waves through his
or her body in short pulses. Each pulse causes a responding pulse of radio waves to
be emitted by the patient’s tissues.
• Computer then produces a two-dimensional picture of a section of the patient. MRI
can produce pictures in any plane.
• Radio Band Imaging is useful in astronomical imaging of pulsars, quasars, etc.
• Usually, in astronomy, multispectral imaging is done to extract different information
from different bands.
27.
Other Imaging Modalities
•Non- EM spectrum imaging uses other modalities like acoustic imaging, electron
microscopy, and synthetic (computer-generated) imaging.
• Imaging using sound (Acoustic Imaging) finds application in geological exploration,
industry, and medicine.
• Geological applications use low frequency sound (commercial applications in mineral and
oil exploration) on land or under water.
• Most common use in medicine, especially in obstetrics, where unborn babies are imaged
to determine the health of their development. Also used for ultrasound imaging of internal
organs.
• The ultrasound system (a computer, ultrasound probe consisting of a source and receiver,
and a display) transmits high-frequency (1 to 5 MHz) sound pulses into the body.
28.
Electron Microscopy
• Electronmicroscopes function as their optical counterparts, except that they use a
focused beam of electrons instead of light to image a specimen
• A stream of electrons is produced by an electron source and accelerated toward the
specimen using a positive electrical potential.
• This stream is confined and focused using metal apertures and magnetic lenses into a
thin, monochromatic beam. This beam is focused onto the sample using a magnetic
lens.
• Interactions occur inside the irradiated sample, affecting the electron beam.
• These interactions and effects are detected and transformed into an image, much in
the same way that light is reflected from, or absorbed by, objects in a scene.
29.
Transmission Electron Microscope(TEM) works much like a slide projector.
• TEMs work the same way, except that they shine a beam of electrons through a specimen
(analogous to the slide).
• The fraction of the beam transmitted through the specimen is projected onto a phosphor screen.
• The interaction of the electrons with the phosphor produces light and, therefore, a viewable image.
Scanning Electron Microscope (SEM) works like a raster scan beam in
a CRT.
• It scans the electron beam and records the interaction of beam and sample at each location. This
produces one dot on a phosphor screen.
• A complete image is formed by a raster scan of the beam through the sample, much like a TV
camera.
• The electrons interact with a phosphor screen and produce light. • SEMs are suitable for “bulky”
30.
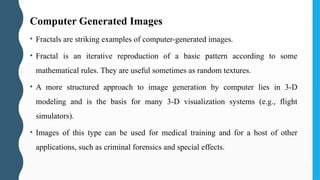
Computer Generated Images
•Fractals are striking examples of computer-generated images.
• Fractal is an iterative reproduction of a basic pattern according to some
mathematical rules. They are useful sometimes as random textures.
• A more structured approach to image generation by computer lies in 3-D
modeling and is the basis for many 3-D visualization systems (e.g., flight
simulators).
• Images of this type can be used for medical training and for a host of other
applications, such as criminal forensics and special effects.
Knowledge Base
• Knowledgeabout a problem domain is coded into an image processing system in
the form of a knowledge database.
• May be as simple as detailing regions of an image where the information of
interest is known to be located.
• Can be quite complex, such as an interrelated list of all major possible defects in
a materials inspection problem or an image database containing high-resolution
satellite images of a region in connection with change-detection applications.
• Knowledge Base guides operation of each processing module, and also controls
the interaction between modules.
33.
1. Image acquisition– Acquiring digital images from a variety of sources. This
could include digitization of existing images, or acquisition from imaging
equipment. This stage may also involve pre-processing operations like scaling.
2. Image enhancement – Used to bring out obscured details, or highlight certain
features of interest in an image. Eg. Adjusting brightness or contrast. This is
very subjective area (based on individual preference).
3. Image restoration - Deals with improving appearance of an image. Unlike
enhancement, image restoration is objective - techniques tend to be based on
mathematical or probabilistic models of image degradation.
4. Color image processing – Deals with processing of digital images with colour.
This includes color adjustments, conversions, etc.
34.
5. Wavelets -Foundation for representing images in various degrees of resolution.
Used for image data compression and pyramidal representation (images are
subdivided successively into smaller regions)
6. Compression - Deals with techniques for reducing the storage required to save
an image, or the bandwidth required to transmit it. Very useful in case of high
resolution images and videos of large sizes, for streaming and storage applications.
7. Morphological processing - deals with tools for extracting image components
that are useful in the representation and description of shape.
8. Segmentation - Partitions an image into its constituent parts or objects. Very
useful for image recognition and identification processes. Autonomous
segmentation is still a huge challenge.
35.
9. Representation andDescription - almost always follows output of a
segmentation stage, usually raw pixel data, of either the boundary of a region, or
all the points in the region itself. Representation deals with converting the data to a
form suitable for computer processing (Boundary or Region). Description, or
feature selection, deals with extracting attributes that result in some quantitative
information of interest, or are basic for differentiating one class of objects from
another.
10. Recognition – The process that assigns a label (e.g., “vehicle”) to an object
based on its descriptors.
• Shift fromdedicated image processing hardware boards towards personal computers
and workstations.
• Basic components of a general purpose digital image processing system are shown:
1. Image Sensors: Two elements are required to acquire digital images. The first is a
physical sensor, that is sensitive to the energy radiated by the object we wish to
image. The second, called a digitizer, is a device for converting the output of the
physical sensing device into digital form.
2. Specialized image processing hardware - Usually consists of the digitizer, plus
hardware that performs other primitive operations, such as an arithmetic logic unit
(ALU), which performs arithmetic and logical operations in parallel on entire
images. Also called a front-end subsystem, and has high speed for fast data
throughputs
38.
3. Computer -General-purpose computer can range from a PC to a
supercomputer. In dedicated applications, specially designed computers are used,
but for general purposes, a PC is sufficient.
4. Software - image processing software consists of specialized modules that
perform specific tasks. A well designed package also includes the capability for the
user to write code that, as a minimum, utilizes the specialized modules.
5. Mass storage – This capability is a must in image processing applications.
Digital storage for image processing applications falls into three principal
categories:
– Short Term storage for use during processing: Short Term Storage is usually
provided by computer memory. Sometimes, specialized boards called frame buffers
are used to store one or more images for rapid access, usually at video rates (30fps) :
– On-line storage for relatively fast recall: Online Storage is usually in the form of
magnetic disks or Optical Media storage
– Archival storage, characterized by infrequent access: Archival Data -massive
storage requirements, but infrequent access. Magnetic Tapes and optical disks are
used for archival applications.
39.
6. Image displays- Mainly color (preferably flat screen) TV monitors, driven by
the outputs of image and graphics display cards.
7. Hardcopy - devices for recording images include laser printers, film cameras,
heat-sensitive devices, inkjet units, and digital units, such as optical and CD-ROM
disks.
8. Networking – Due to large data sizes in images, dedicated fast networks with
high bandwidth are required for easy transmission of images to remote locations.
• The eyeis nearly a sphere, with an average diameter of approximately 20 mm.
• Three membranes enclose the eye: the cornea and sclera outer cover; the
choroid; and the retina.
• Cornea - Tough, transparent tissue that covers the anterior surface of the eye.
• Sclera - Continuous with the cornea, is an opaque membrane that encloses the
remainder of the optic globe.
• Choroid - Lies directly below the sclera. This membrane contains a network
of blood vessels that serve as the major source of nutrition to the eye. Heavily
pigmented and helps to reduce the amount of extraneous light entering the eye
and the backscatter within the optic globe. At its anterior extreme, the choroid
is divided into the ciliary body and the iris.
• Iris - contracts or expands to control the amount of light that enters the eye.
The central opening of the iris (the pupil) varies in diameter from
approximately 2 to 8 mm. The front of the iris contains the visible pigment of
the eye, whereas the back contains a black pigment.
43.
• Lens -made up of concentric layers of fibrous cells. Suspended by fibers that
attach to the ciliary body. Colored by a slightly yellow pigmentation that
increases with age. In extreme cases, excessive clouding of the lens, caused by
the affliction commonly referred to as cataracts, can lead to poor color
discrimination and loss of clear vision. The lens absorbs approximately 8% of
the visible light spectrum, with relatively higher absorption at shorter
wavelengths.
• Retina - Innermost membrane of the eye, which lines the inside of the wall’s
entire posterior portion. When the eye is properly focused, light from an
object outside the eye is imaged on the retina. Pattern vision is afforded by the
distribution of discrete light receptors over the surface of the retina. There are
two classes of receptors: cones and rods.
• Fovea - Circular indentation in the retina of about 1.5 mm in diameter.
44.
• Cones -The cones in each eye number between 6 and 7 million. They are
located primarily in the central portion of the retina, called the fovea, and
are highly sensitive to color. Humans can resolve fine details with these
cones largely because each one is connected to its own nerve end. Muscles
controlling the eye rotate the eyeball until the image of an object of interest
falls on the fovea. Cone vision is called photopic or bright-light vision.
• Rods – Larger in Number - 75 to 150 million distributed over the retinal
surface. The larger area of distribution, several rods are connected to a
single nerve end reduce the amount of detail discernible by these receptors.
Rods give a general, overall picture of the field of view. They are not
involved in color vision and are sensitive to low levels of illumination. For
example, objects that appear brightly colored in daylight when seen by
moonlight appear as colorless forms because only the rods are stimulated.
This phenomenon is known as scotopic or dim-light vision.
45.
Retinal Distribution ofRods and Cones
Figure shows the density of rods and cones for a cross section of the right eye
passing through the region of emergence of the optic nerve from the eye.
46.
• Blind spot– Region of emergence of Optical Nerve from the eye, due
to absence of receptors.
• Except for the blind spot, the distribution of receptors is radially
symmetric about the fovea.
• Receptor density is measured in degrees from the fovea.
• We see that cones are most dense in the center of the retina (in the
center area of the fovea).
• Rods increase in density from the center out to approximately 20° off
axis and then decrease in density out to the extreme periphery of the
retina.
• Cones are primarily situated at the fovea, as seen in the diagram. The
density of cones in the fovea area of the retina is approximately
150,000 elements per mm2 .
47.
Image Formation inthe Eye
• In an ordinary photographic camera, lens has a fixed focal length, and focusing is
achieved by varying the distance between lens and imaging plane (film or sensor) •
In the human eye, distance between the lens and the imaging region (the retina) is
fixed.
• Focal length needed to achieve proper focus is obtained by varying the shape of the
lens.
• Ciliary body fibers flatten or thicken the lens, to focus image, for distant or nearby
objects respectively.
• The range of focal lengths is approximately 14 mm to 17 mm, the latter taking place
when the eye is relaxed and focused at distances greater than about 3 m.
• Retinal image is focused primarily on the region of the fovea.
• Perception then takes place by relative excitation of light receptors, which transform
radiant energy into electrical impulses that ultimately are decoded by the brain
48.
• The geometryin the Figure illustrates how to obtain the dimensions of an image
formed on the retina.
• For example, suppose that a person is looking at a tree 15 m high at a distance of
100 m. Letting h denote the height of that object in the retinal image, we get:
• Digital imagesare displayed as a discrete set of intensities.
• The eye’s ability to discriminate between different intensity levels is an
important consideration in presenting image processing results.
• Range of light intensity levels to which the human visual system can adapt is
enormous- on the order of 1010 from the scotopic threshold to the glare limit.
• Experimental evidence indicates that subjective brightness (intensity as
perceived by the human visual system) is a logarithmic function of the light
intensity incident on the eye.
• A plot of light intensity versus subjective brightness, illustrates this
characteristic
51.
• The longsolid curve represents the range of
intensities to which the visual system can adapt.
• In photopic vision alone, the range is about
• The transition from scotopic to photopic vision
is gradual over the approximate range from
0.001 to 0.1 millilambert ( -3 to -1 mL in the log
scale), as the double branches of the adaptation
curve in this range show.
• Essential point of interpretation is that the visual
system cannot operate over such a range
simultaneously.
52.
• Visual Systemaccomplishes this large variation by changing its overall sensitivity, a
phenomenon known as brightness adaptation.
• Total range of distinct intensity levels eye can discriminate simultaneously is rather small when
compared with the total adaptation range.
• For any given set of conditions, current sensitivity level of the visual system is called the
brightness adaptation level, which may correspond, for example, to brightness Ba in Figure.
• The short intersecting curve represents the range of subjective brightness that the eye can
perceive when adapted to this level.
• This range is rather restricted, having a level Bb at and below which all stimuli are perceived as
indistinguishable blacks.
• The upper portion of the curve is not actually restricted but, if extended too far, loses its meaning
because much higher intensities would simply raise the adaptation level higher than Ba
53.
• The abilityof the eye to discriminate between changes in light
intensity at any specific adaptation level is also of
considerable interest.
• Experiment used to determine the capability of the human
visual system for brightness discrimination consists of having
a subject look at a flat, uniformly illuminated area large
enough to occupy the entire field of view.
• This area typically is a diffuser, such as opaque glass, that is
illuminated from behind by a light source whose intensity I,
can be varied.
• To this field is added an increment of illumination ΔI, in the
form of a short-duration flash that appears as a circle in the
center of the uniformly illuminated field, as shown.
Brightness Discrimination
54.
• If ΔIis not bright enough, the subject says “no” indicating no perceivable change.
• As ΔI gets stronger, the subject may give a positive response of “yes” indicating a perceived
change.
• Finally, when ΔI is strong enough, the subject will give a response of “yes” all the time.
• The quantity ΔIC /I where ΔIC is the increment of illumination discriminable 50%of the time
with background illumination I, is called the Weber ratio.
• A small value of ΔIC /I means that a small percentage change in intensity is discriminable. This
represents “good” brightness discrimination.
• Conversely, a large value of ΔIC /I means that a large percentage change in intensity is required.
This represents “poor” brightness discrimination.
• Two phenomena demonstrate that perceived brightness is not a simple function of intensity:
– Mach Band Effect
– Simultaneous Contrast
55.
• The visualsystem tends to undershoot or
overshoot around the boundary of regions
of different intensities.
• Although the intensity of the stripes is
constant, we actually perceive a brightness
pattern that is strongly scalloped near the
boundaries.
• These seemingly scalloped bands are
called Mach bands
Mach Band Effect
56.
Simultaneous Contrast
• Aregion’s perceived brightness does not depend simply on its intensity.
• All the center squares have exactly the same intensity. However, they appear to
the eye to become darker as the background gets lighter.
57.
• Other examplesof human
perception phenomena are
optical illusions, in which the eye
fills in non-existing information
or wrongly perceives geometrical
properties of objects.
• Optical illusions are a
characteristic of the human
visual system that is not fully
understood.
Optical Illusions
• Most imagesare generated by combination of “illumination” source and
reflection or absorption of energy from the source by the elements of the “scene”
being imaged.
• Depending on the nature of the source, illumination energy is reflected from (eg.
Light reflected from a planar surface), or transmitted through objects (eg. X-rays
pass through a patient’s body).
• In some applications, reflected / transmitted energy is focused onto a
photoconverter (eg., a phosphor screen), to convert energy into visible light (eg.
Electron Microscopy, Gamma Ray Imaging).
60.
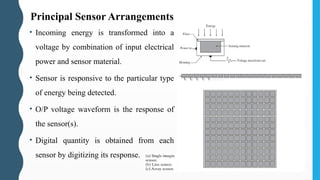
• Incoming energyis transformed into a
voltage by combination of input electrical
power and sensor material.
• Sensor is responsive to the particular type
of energy being detected.
• O/P voltage waveform is the response of
the sensor(s).
• Digital quantity is obtained from each
sensor by digitizing its response.
Principal Sensor Arrangements
61.
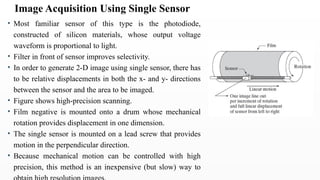
• Most familiarsensor of this type is the photodiode,
constructed of silicon materials, whose output voltage
waveform is proportional to light.
• Filter in front of sensor improves selectivity.
• In order to generate 2-D image using single sensor, there has
to be relative displacements in both the x- and y- directions
between the sensor and the area to be imaged.
• Figure shows high-precision scanning.
• Film negative is mounted onto a drum whose mechanical
rotation provides displacement in one dimension.
• The single sensor is mounted on a lead screw that provides
motion in the perpendicular direction.
• Because mechanical motion can be controlled with high
precision, this method is an inexpensive (but slow) way to
Image Acquisition Using Single Sensor
62.
• Other similarmechanical arrangements use a flat bed, with the sensor
moving in two linear directions. These types of mechanical digitizers
sometimes are referred to as microdensitometers.
• Another example of imaging with a single sensor places a laser
source coincident with the sensor.
• Moving mirrors are used to control the outgoing beam in a scanning
pattern and to direct the reflected laser signal onto the sensor.
• This arrangement can be used also to acquire images using strip and
array sensors.
63.
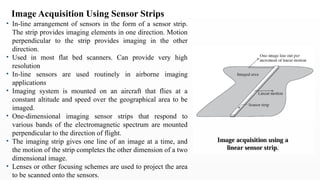
• In-line arrangementof sensors in the form of a sensor strip.
The strip provides imaging elements in one direction. Motion
perpendicular to the strip provides imaging in the other
direction.
• Used in most flat bed scanners. Can provide very high
resolution
• In-line sensors are used routinely in airborne imaging
applications
• Imaging system is mounted on an aircraft that flies at a
constant altitude and speed over the geographical area to be
imaged.
• One-dimensional imaging sensor strips that respond to
various bands of the electromagnetic spectrum are mounted
perpendicular to the direction of flight.
• The imaging strip gives one line of an image at a time, and
the motion of the strip completes the other dimension of a two
dimensional image.
• Lenses or other focusing schemes are used to project the area
to be scanned onto the sensors.
Image Acquisition Using Sensor Strips
64.
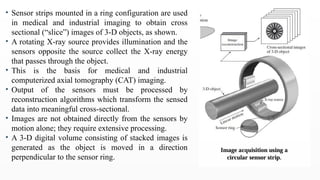
• Sensor stripsmounted in a ring configuration are used
in medical and industrial imaging to obtain cross
sectional (“slice”) images of 3-D objects, as shown.
• A rotating X-ray source provides illumination and the
sensors opposite the source collect the X-ray energy
that passes through the object.
• This is the basis for medical and industrial
computerized axial tomography (CAT) imaging.
• Output of the sensors must be processed by
reconstruction algorithms which transform the sensed
data into meaningful cross-sectional.
• Images are not obtained directly from the sensors by
motion alone; they require extensive processing.
• A 3-D digital volume consisting of stacked images is
generated as the object is moved in a direction
perpendicular to the sensor ring.
65.
Image Acquisition UsingSensor Arrays
• Numerous electromagnetic and some ultrasonic sensing devices frequently are
arranged in an array format.
• Also predominant arrangement found in digital cameras (CCD arrays)
• Response of each sensor is proportional to the integral of the light energy
projected onto the surface of the sensor.
• Noise reduction – let the sensor integrate the input light signal over minutes or
even hours.
• Since Array is 2-D, key advantage is that a complete image can be obtained by
focusing the energy pattern onto the surface of the array.
• Motion is not necessary
• Energy froman illumination source is reflected from a scene element.
• The first function performed by the imaging system is to collect the incoming
energy and focus it onto an image plane.
• If the illumination is light, the front end of the imaging system is an optical
lens that projects the viewed scene onto the lens focal plane.
• The sensor array, which is coincident with the focal plane, produces outputs
proportional to the integral of the light received at each sensor.
• Digital and analog circuitry sweep these outputs and convert them to an analog
signal, which is then digitized by another section of the imaging system.
• The output is a digital image, as shown.
68.
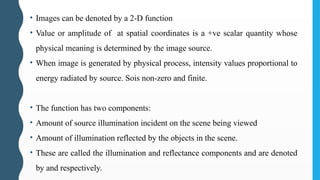
• Images canbe denoted by a 2-D function
• Value or amplitude of at spatial coordinates is a +ve scalar quantity whose
physical meaning is determined by the image source.
• When image is generated by physical process, intensity values proportional to
energy radiated by source. Sois non-zero and finite.
• The function has two components:
• Amount of source illumination incident on the scene being viewed
• Amount of illumination reflected by the objects in the scene.
• These are called the illumination and reflectance components and are denoted
by and respectively.
69.
• The twofunctions combine as a product to form
• Where and
• Equations indicate that reflectance is bounded by 0 (Total absorption) and 1 (total
reflection).
• Nature of is determined by illumination source.
• Nature of is determined by characteristics of imaged object.
• In case of images formed by transmission through a medium (Eg. X-rays), we
use transmissivity instead of reflectivity.
70.
Image Sampling andQuantization
• O/p of most sensors is a continuous voltage waveform whose amplitude and
spatial behaviour are related to the physical phenomenon being sensed.
• To create a digital image, we need to convert continuous sensed data into digital
form. This involves two processes: sampling and quantization.
• Consider a continuous image f that we want to convert to digital form. An image
may be continuous with respect to the x- and y-coordinates, and also in amplitude.
• To convert it to digital form, we have to sample the function in both coordinates
and in amplitude.
• Digitizing the coordinate values is called Sampling.
• Digitizing the amplitude values is called Quantization
72.
• Figure Ashows image which is continuous both spatially and in terms of
intensities. AB is a row of all pixels along the lines along which sampling is done.
• Figure B plots the intensities of each pixel, against the location of the pixels. The
random variations are due to image noise.
• Figure C shows the sampled points along the line AB. Here, the equally spaced
points (ticks) indicate the linearly spaced samples along the line. Note that while
the image is spatially sampled, it is still continuous in intensities.
• Figure D shows the quantized signal from Figure C. The continuous range of
intensity values, has now been discretized into 8 intervals, from black to white,
assigning the closest value to each sample.
• This entire process is repeated for each line to produce a digitized 2-D image.
73.
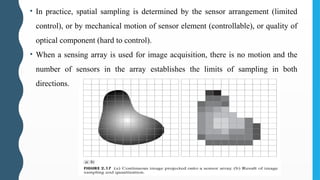
• In practice,spatial sampling is determined by the sensor arrangement (limited
control), or by mechanical motion of sensor element (controllable), or quality of
optical component (hard to control).
• When a sensing array is used for image acquisition, there is no motion and the
number of sensors in the array establishes the limits of sampling in both
directions.
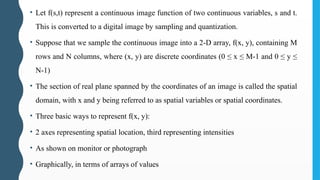
• Let f(s,t)represent a continuous image function of two continuous variables, s and t.
This is converted to a digital image by sampling and quantization.
• Suppose that we sample the continuous image into a 2-D array, f(x, y), containing M
rows and N columns, where (x, y) are discrete coordinates (0 ≤ x ≤ M-1 and 0 ≤ y ≤
N-1)
• The section of real plane spanned by the coordinates of an image is called the spatial
domain, with x and y being referred to as spatial variables or spatial coordinates.
• Three basic ways to represent f(x, y):
• 2 axes representing spatial location, third representing intensities
• As shown on monitor or photograph
• Graphically, in terms of arrays of values
77.
• Image displaysare best for fast visualization.
• Numerical arrays are used for processing and algorithm development.
• M x N Numerical Array can be written as:
• Each element of this matrix is called an image element, picture element, pixel, or
pel.
• Sometimes, it is advantageous to use a more traditional matrix notation to denote
a digital image and its elements:
• Image can also be represented as a vector v, of size MNx1 elements, collected
78.
• Note thatthe origin of a digital image is at the top left.
• Positive x-axis extends downward and the positive y-axis extends to the right.
(Convention based on Raster Scan)
• Express Sampling and Quantization mathematically:
– Let Z and R denote the set of integers and the set of real numbers,
respectively.
– The sampling process may be viewed as partitioning the xy-plane into a grid,
with the coordinates of the center of each cell in the grid being a pair of
elements from the Cartesian product which is the set of all ordered pairs of
elements (zi, zj), with zi and zj being integers from Z.
– f(x,y) is a digital image if (x, y) are integers fromand f is a function that
assigns an intensity value (that is, a real number from R) to each distinct pair
of coordinates (x, y). This functional assignment is the quantization process.
If f(x,y) is also an integer, Z replaces R, to get a digital image.
79.
• M, Nand L (intensity levels) have to be decided during digitization.
• M and N are to be positive integers.
• Due to quantizing hardware considerations, L is typically a power of 2. :
• We assume that the discrete levels are equally spaced and that they are integers in
the interval [0, L-1].
• Dynamic range of an imaging system is the ratio of the maximum measurable
intensity to the minimum detectable intensity level.
• The upper limit is determined by saturation and the lower limit by noise.
• Contrast is the difference in intensity between the highest and lowest intensity
levels in an image.
• The number, b, of bits required to store a digitized image is:
• When M = N, this equation becomes:
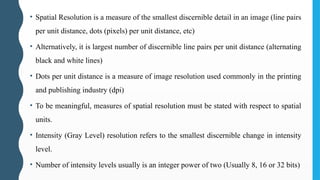
• Spatial Resolutionis a measure of the smallest discernible detail in an image (line pairs
per unit distance, dots (pixels) per unit distance, etc)
• Alternatively, it is largest number of discernible line pairs per unit distance (alternating
black and white lines)
• Dots per unit distance is a measure of image resolution used commonly in the printing
and publishing industry (dpi)
• To be meaningful, measures of spatial resolution must be stated with respect to spatial
units.
• Intensity (Gray Level) resolution refers to the smallest discernible change in intensity
level.
• Number of intensity levels usually is an integer power of two (Usually 8, 16 or 32 bits)
83.
• We observethat with a reduction in the spatial resolution, a lot of fine
details in the image are lost, and the image gets degraded. These
effects can be reduced by using appropriate interpolation methods.
• Checkerboard effect– When spatial resolution is very low, the images
appear as blocks and ridges (Checkerboard pattern). Thus, a curve
may appear as a staircase.
• The checkerboard effect is caused by pixel replication, that is, lower
resolution images were duplicated in order to fill the display area.
85.
• We noticeas the intensity resolution becomes smaller, very fine
ridge-like structures in areas of constant or nearly constant intensity
are seen (particularly in the skull).
• This effect, caused by the use of an insufficient number of intensity
levels in smooth areas of a digital image, is called false contouring.
• It appears in the image as contours of gray levels not present in the
original image.
• The results illustrate the effects produced on image quality by varying
N (Spatial resolution) and k (Intensity Resolution) independently.
• An early study by Huang [1965] attempted to quantify experimentally
the effects on image quality produced by varying N and k
simultaneously.
86.
Image Interpolation
• Usedextensively in zooming, shrinking, rotating and
geometric corrections
• Shrinking and Zooming – resampling methods
• Interpolation = using known data to estimate values at
unknown locations (zooming)
• Shrinking = decimation = reducing the number of pixels
87.
Image shrinking
• Processof reducing spatial resolution by removing certain rows and columns
from original image (subsampling).
• Eg: Consider a 1024x1024 image to be shrunk to 512x512
• Alternate rows and columns need to be discarded to get the shrunken image.
Further filters can be used to clean up the image.
88.
Image Zooming
• Processof oversampling image to increase spatial resolution.
• Increases the total number of pixels in the image.
• Similar to interpolation process.
2 stages:
1. Creation of new pixel locations
2. Assignment of new gray level values to these locations
• Interpolation methods:
– Nearest neighbour (Pixel replication)
– Bilinear interpolation
– Bicubic interpolation
89.
Nearest Neighbour Interpolation
•First, extra rows and columns are created in zoomed image, and pixel values of
the nearest neighbour are copied into newly created pixels.
• Has tendency to produce undesirable artifacts, like severe distortion of straight
edges.
• Used very rarely
90.
Bilinear Interpolation
• Newrows and columns are created, and values are assigned based on linear
average of neighbouring pixels.
• Bilinear interpolation processes 2x2 (4 pixels) squares.
• First, linear average of neighbouring row pixels are calculated, and then column
pixels are used in next step.
91.
Bicubic Interpolation
• Usessixteen nearest neighbours of a point
• Intensity values assigned to a point uses the equation:
• Sixteen coefficients are determined from sixteen equations in sixteen unknowns
that can be written using the sixteen nearest neighbours of point (x,y).
• If limits of summations are 0 and 1, it becomes bilinear interpolation.
• Bicubic interpolation is better than bilinear interpolation for preserving fine
detail. This is the standard algorithm used in commercial image editing
programs.
Neighbours of aPixel
• A pixel p at coordinates (x, y) has four horizontal and vertical neighbours whose
coordinates are given by:
• This set of pixels, called the 4-neighbors of p, is denoted by N4(p).
• Each pixel is a unit distance from (x, y), and some of the neighbour locations of p
lie outside the digital image if (x, y) is on the border of the image.
• The four diagonal neighbours of p are denoted by and have coordinates:
• These points, together with the 4-neighbors, are called the 8-neighbors of p,
denoted by
96.
Adjacency
• Let Vbe the set of intensity values used to define adjacency
• In a binary image, V = {1} if we are referring to adjacency of pixels with value 1.
• In a gray-scale image, the idea is the same, but set V typically contains more
elements.
• (Eg : in the adjacency of pixels with a range of possible intensity values 0 to 255,
set V could be any subset of these 256 values)
97.
3 Types ofAdjacency:
1. 4-adjacency : Two pixels p and q with values from V are 4 adjacent if q is in
the set N4(p).
2. 8-adjacency : Two pixels p and q with values from V are 8 adjacent if q is in
the set N8(p)
3. m-adjacency (mixed adjacency) : Two pixels p and q with values from V are
m-adjacent if:
1. q is in N4(p), OR
2. q is in ND(p), and the set N4(p) ∩ N4(q) has no pixels whose values are
from V.
98.
Path
• A (digital)path (or curve) from pixel p with coordinates (x, y) to pixel q with
coordinates (s, t) is a sequence of distinct pixels with coordinates:
• Where (= (s, t), and pixels are adjacent for .
• In this case, n is the length of the path. • If the path is a closed path.
• We can define 4-, 8-, or m-paths depending on the type of adjacency specified.
99.
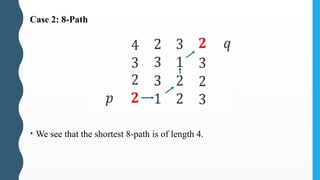
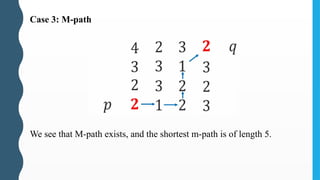
• Example: Considerthe image segment shown in figure. Compute length of the
shortest-4, shortest-8 & shortest-m paths between pixels p & q where, V = {1, 2}.
• V = {1, 2} means all pixels along the path have to have values 1 or 2 only.
• Let us consider each case separately:
100.
Case 1: 4-Path
•We see that 4-Path does not exist V={1,2} between p and q, for V={1,2}
Boundary
• The. boundary(also called the border or contour) of a region R is the set of
points that are adjacent to points in the complement of R.
• Border of a region is the set of pixels in the region that have at least one
background neighbour.
• If R happens to be an entire image, then its boundary is defined as the set of
pixels in the first and last rows and columns of the image.
• An image has no neighbours beyond its border.
• Inner border of the region corresponds to boundary points along foreground.
• Outer border corresponds to boundary points along background
106.
Edges
• Unlike Boundaries,which form a closed path and are GLOBAL, Edges are
formed from pixels with derivative values that exceed a preset threshold.
• The idea of an edge is a LOCAL concept that is based on a measure of gray-level
discontinuity at a point.
• It is possible to link edge points into edge segments, and sometimes these
segments are linked in such a way that they correspond to boundaries, but this is
not always the case.
• The one exception in which edges and boundaries correspond is in binary
images.
107.
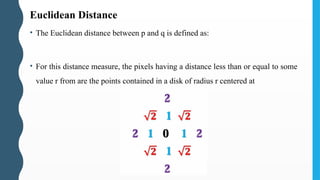
Euclidean Distance
• TheEuclidean distance between p and q is defined as:
• For this distance measure, the pixels having a distance less than or equal to some
value r from are the points contained in a disk of radius r centered at
108.
City Block Distance(D4 distance)
• The City-block distance between p and q is defined as:
• Here, the pixels having a 4 distance from (x, y) less than or equal to some
𝐷
value r form a diamond centered at (x, y).
• The pixels with are the 4-neighbors of (x, y).
109.
Chessboard Distance (D8distance)
• The Chessboard distance between p and q is defined as:
• Here, the pixels having a D8 distance from (x, y) less than or equal to some value
r form a square centered at (x, y).
• The pixels with 8=1 are the 8-neighbors of (x, y).
𝐷
110.
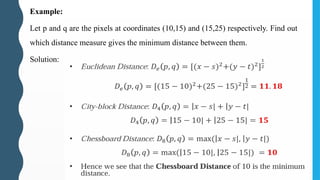
Example:
Let p andq are the pixels at coordinates (10,15) and (15,25) respectively. Find out
which distance measure gives the minimum distance between them.
Solution:


![• M, N and L (intensity levels) have to be decided during digitization.
• M and N are to be positive integers.
• Due to quantizing hardware considerations, L is typically a power of 2. :
• We assume that the discrete levels are equally spaced and that they are integers in
the interval [0, L-1].
• Dynamic range of an imaging system is the ratio of the maximum measurable
intensity to the minimum detectable intensity level.
• The upper limit is determined by saturation and the lower limit by noise.
• Contrast is the difference in intensity between the highest and lowest intensity
levels in an image.
• The number, b, of bits required to store a digitized image is:
• When M = N, this equation becomes:](https://image.slidesharecdn.com/unit1digitalimageprocessing21ec732-250329131121-ba1c303b/85/Unit_1_DigitalImageProcessing_21EC732-pptx-79-320.jpg)


![• We notice as the intensity resolution becomes smaller, very fine
ridge-like structures in areas of constant or nearly constant intensity
are seen (particularly in the skull).
• This effect, caused by the use of an insufficient number of intensity
levels in smooth areas of a digital image, is called false contouring.
• It appears in the image as contours of gray levels not present in the
original image.
• The results illustrate the effects produced on image quality by varying
N (Spatial resolution) and k (Intensity Resolution) independently.
• An early study by Huang [1965] attempted to quantify experimentally
the effects on image quality produced by varying N and k
simultaneously.](https://image.slidesharecdn.com/unit1digitalimageprocessing21ec732-250329131121-ba1c303b/85/Unit_1_DigitalImageProcessing_21EC732-pptx-85-320.jpg)