Syllabus
Introduction to Metrology– Need – Elements
– Work piece, Instruments – Persons –
Environment –their effect on Precision and
Accuracy – Errors – Errors in Measurements –
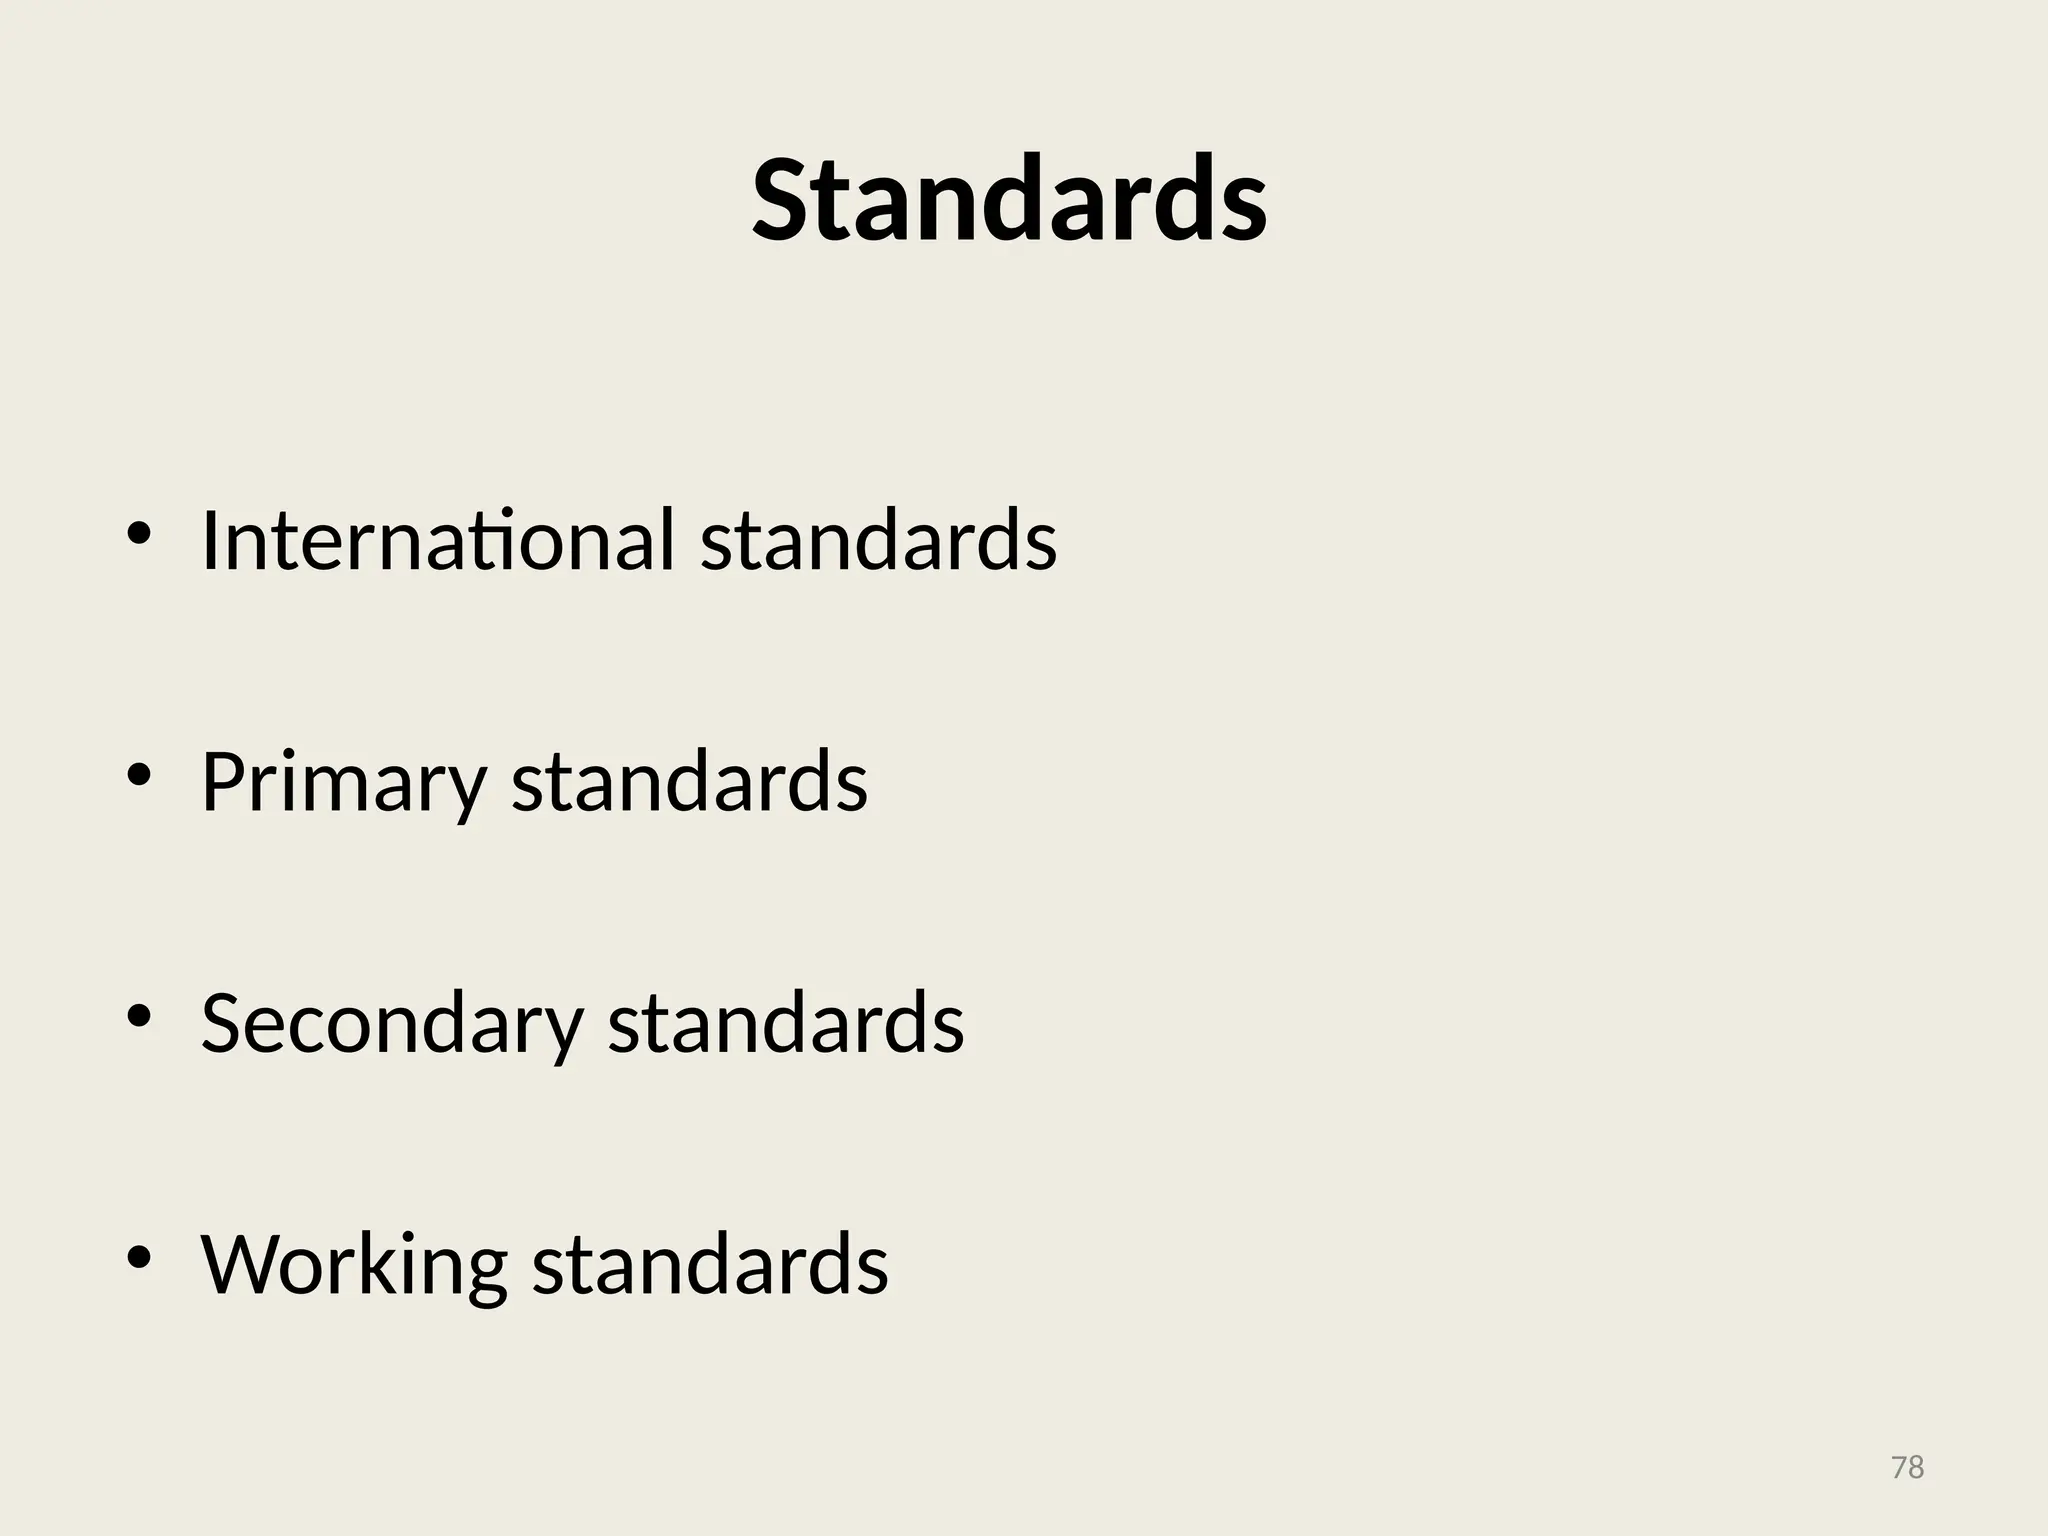
Types – Control – Types of standards.
2
3.
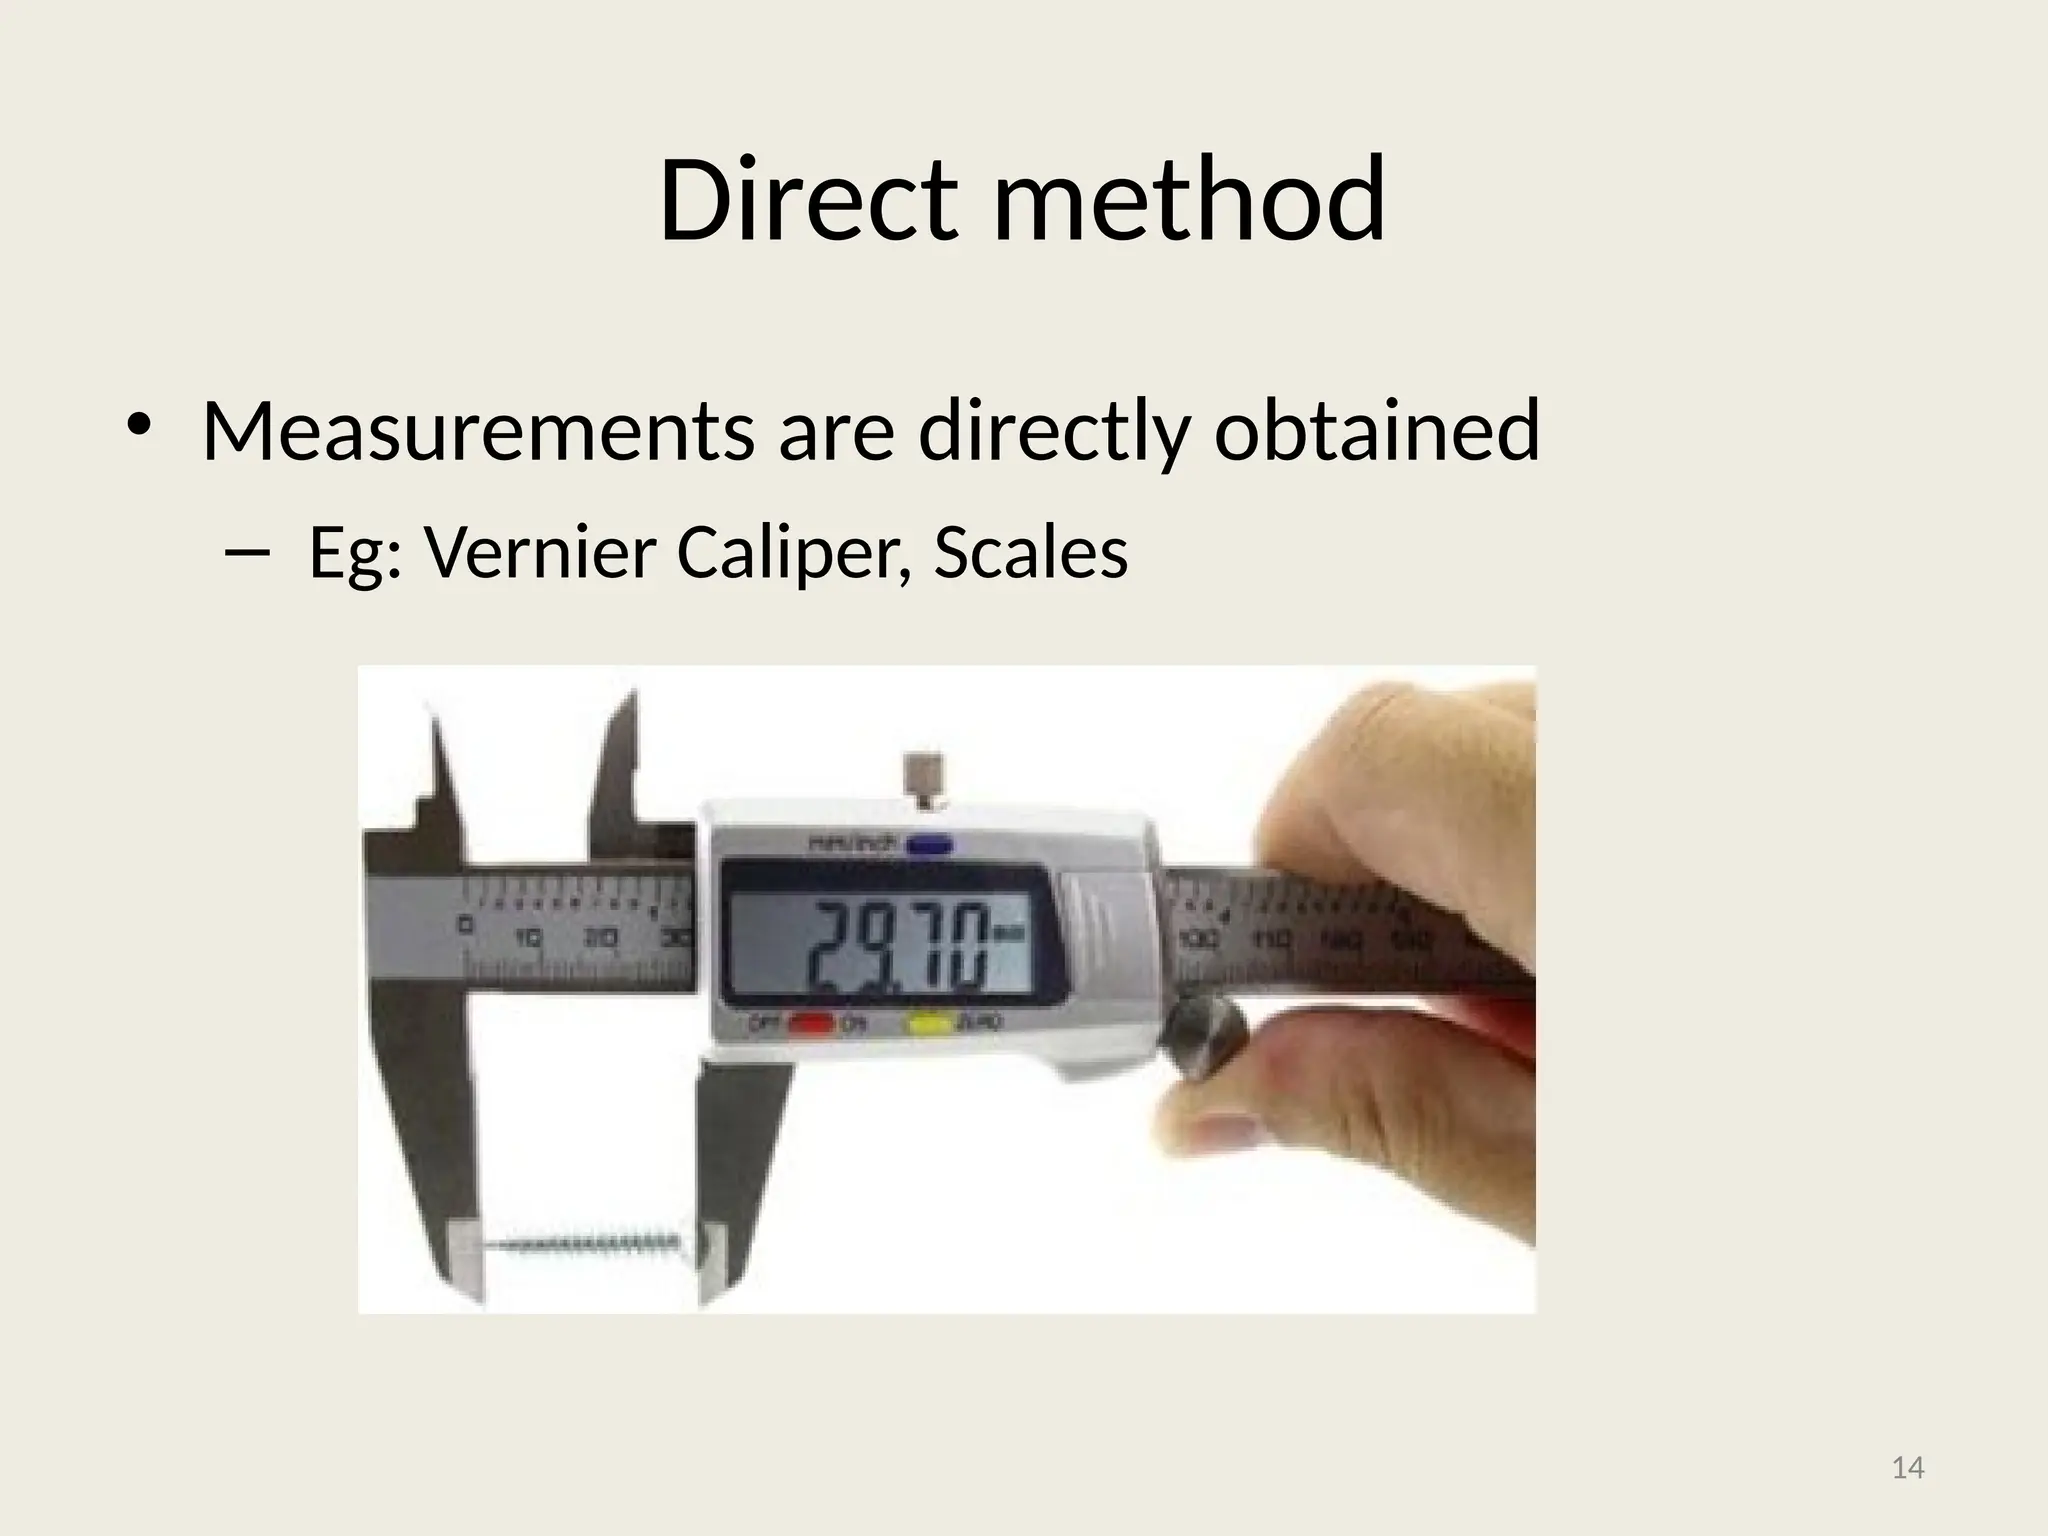
Definition
• Metrology isthe Greek name given to the
science of pure measurement.
• Measurement is defined as the process of
numerical evaluation of a dimension or the
process of comparison with standard
measuring instruments
3
4.
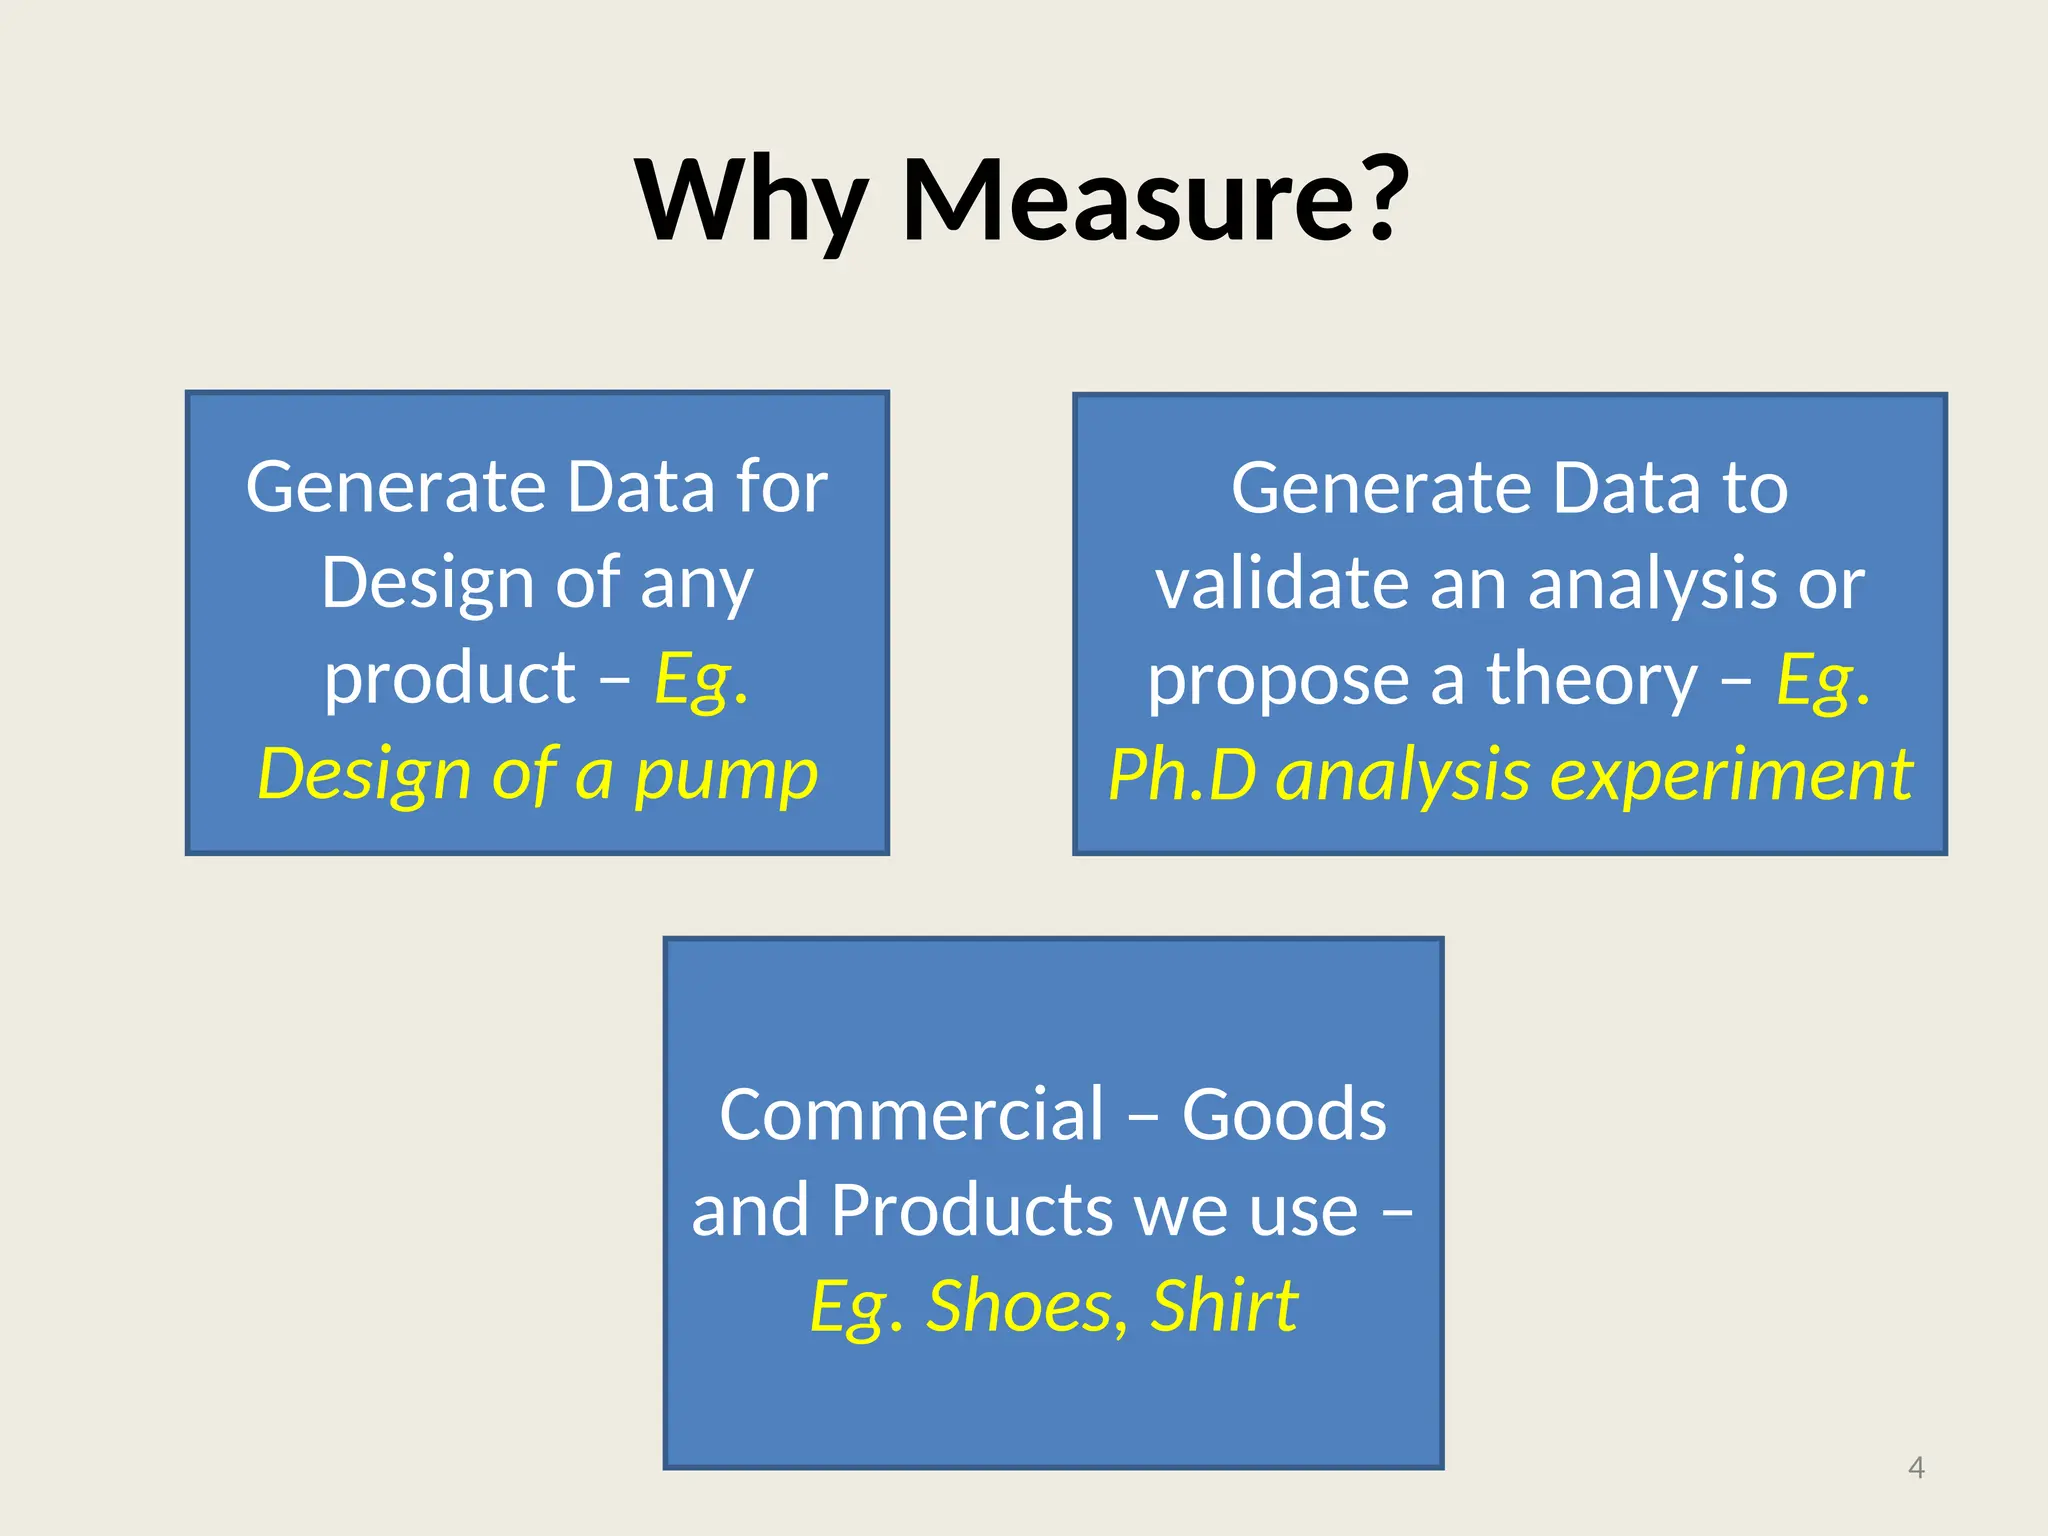
Why Measure?
Generate Datafor
Design of any
product – Eg.
Design of a pump
Generate Data to
validate an analysis or
propose a theory – Eg.
Ph.D analysis experiment
Commercial – Goods
and Products we use –
Eg. Shoes, Shirt
4
5.
Need of Measurement
•Establish standard
• Interchange ability
• Customer Satisfaction
• Validate the design
• Physical parameter into meaningful number
• True dimension
• Evaluate the Performance
5
6.
How to MeasureGenerally?
Measurand – I/P –
Unknown
Magnitude
Result – In
Number
Standard Quantity – Known
Magnitude
Comparision
Process
Measurand – A variable whose numerical value is to
be determined
6
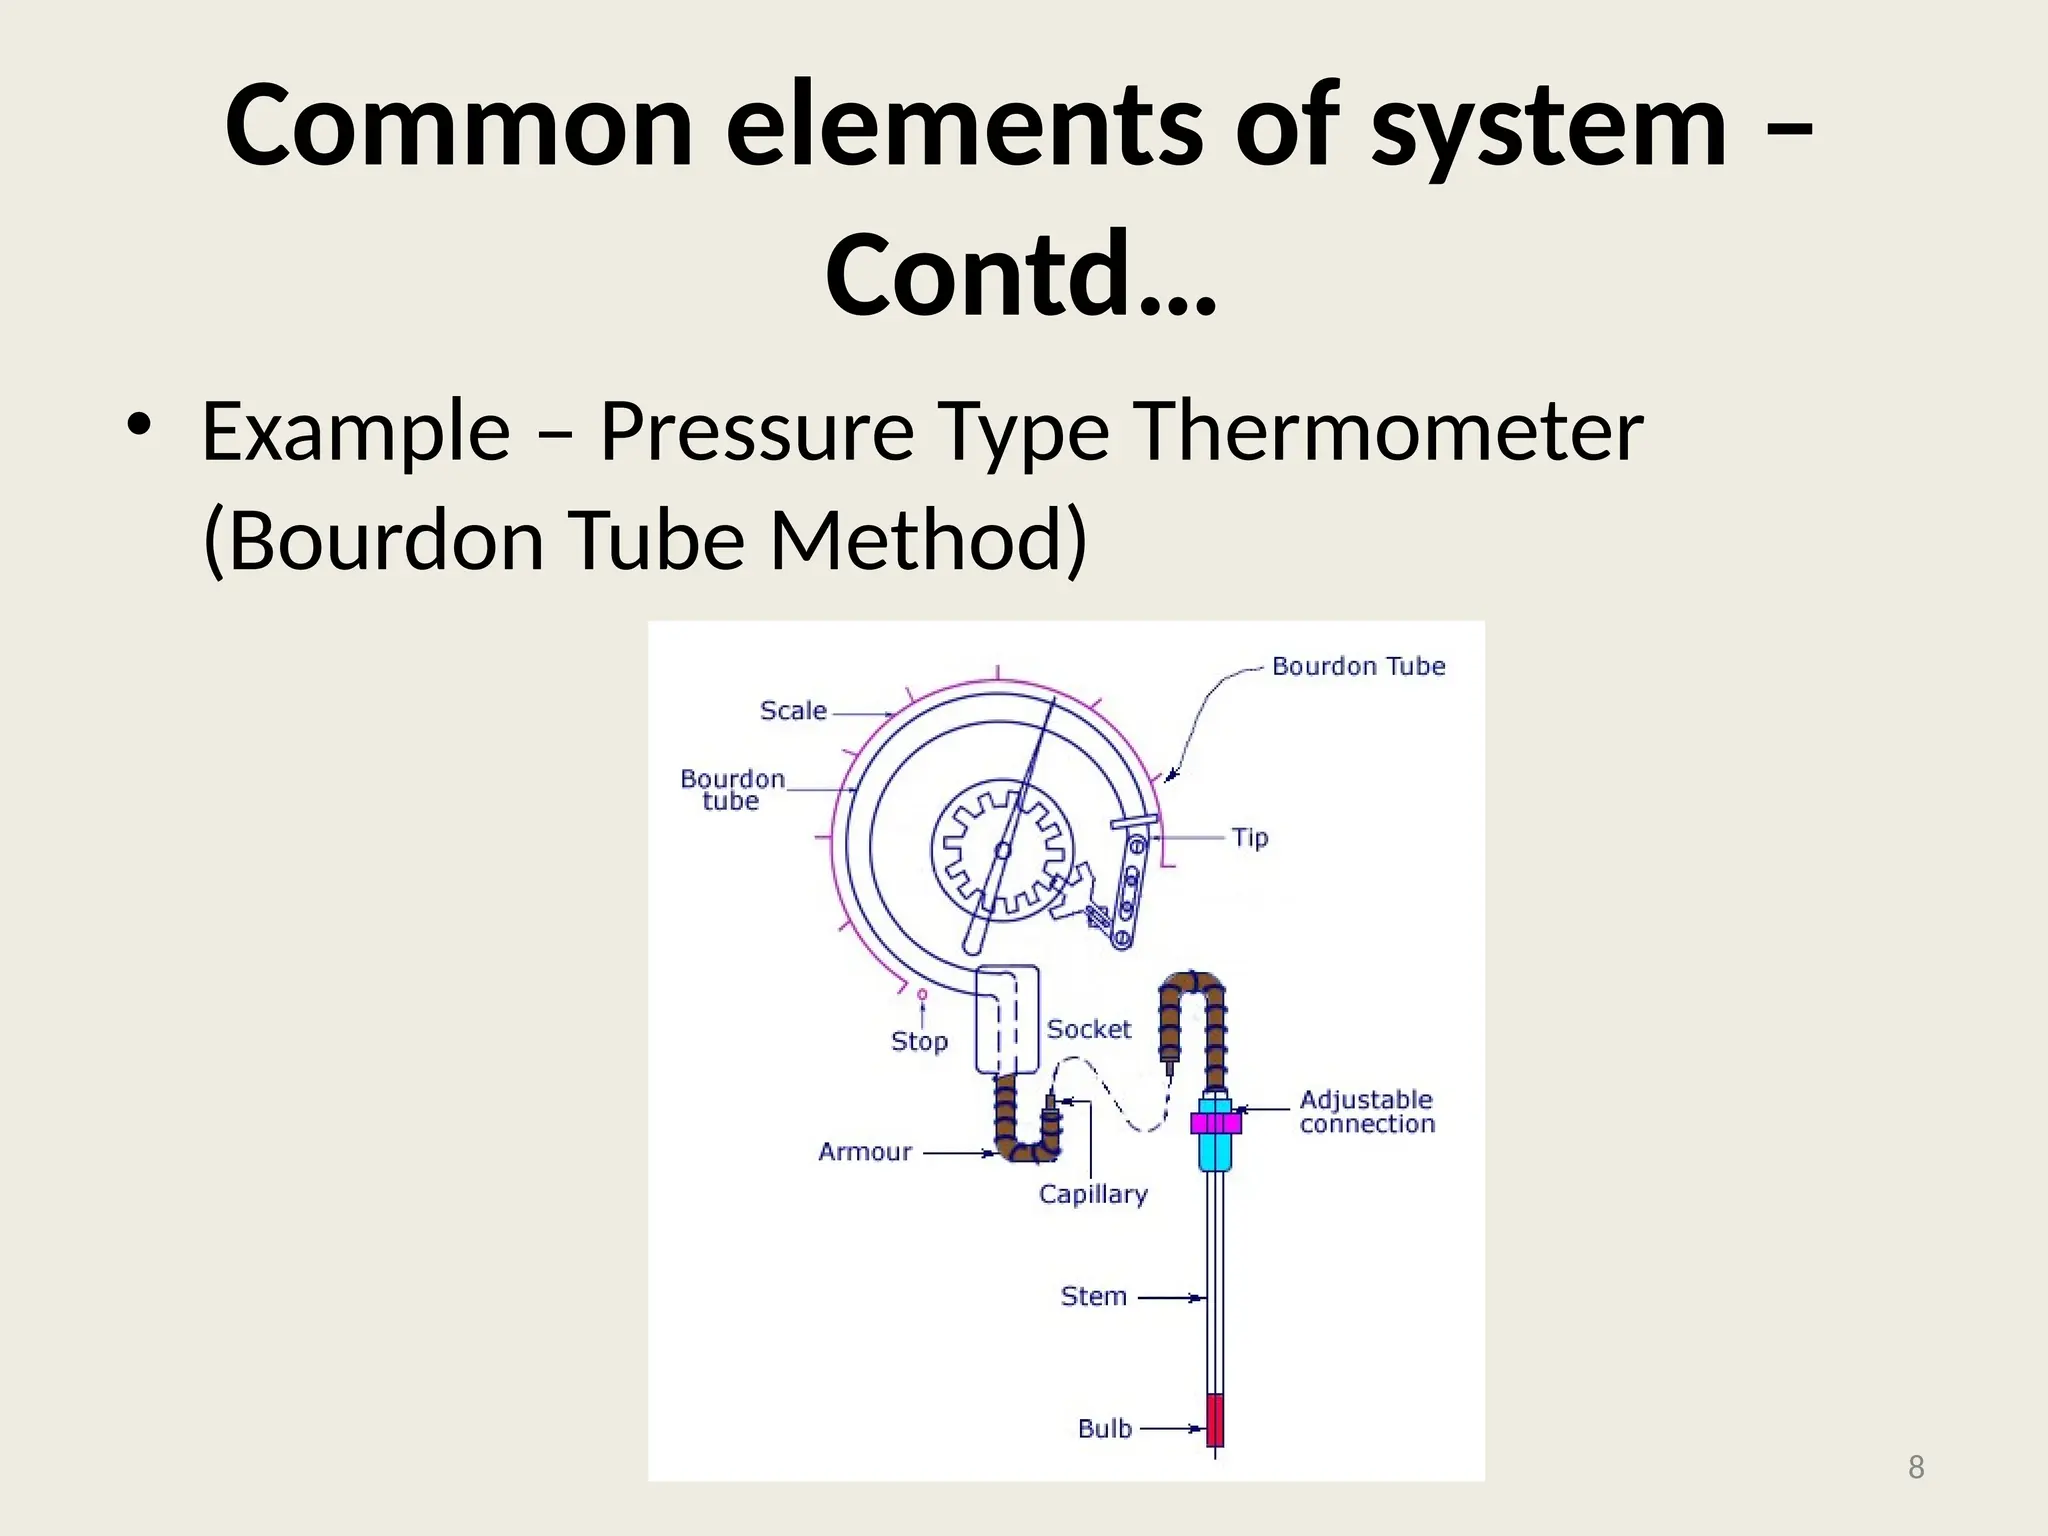
Common elements ofsystem –
Contd…
• Example – Pressure Type Thermometer
(Bourdon Tube Method)
8
9.
Working Principle ofPressure
Type Thermometer
• Liquid will expand or contract in proportion to
the temperature
• Enclosed liquid when partially filled will create
definite vapour pressure in proportion to its
temperature
• Universal Gas Law: PV=nRT
9
10.
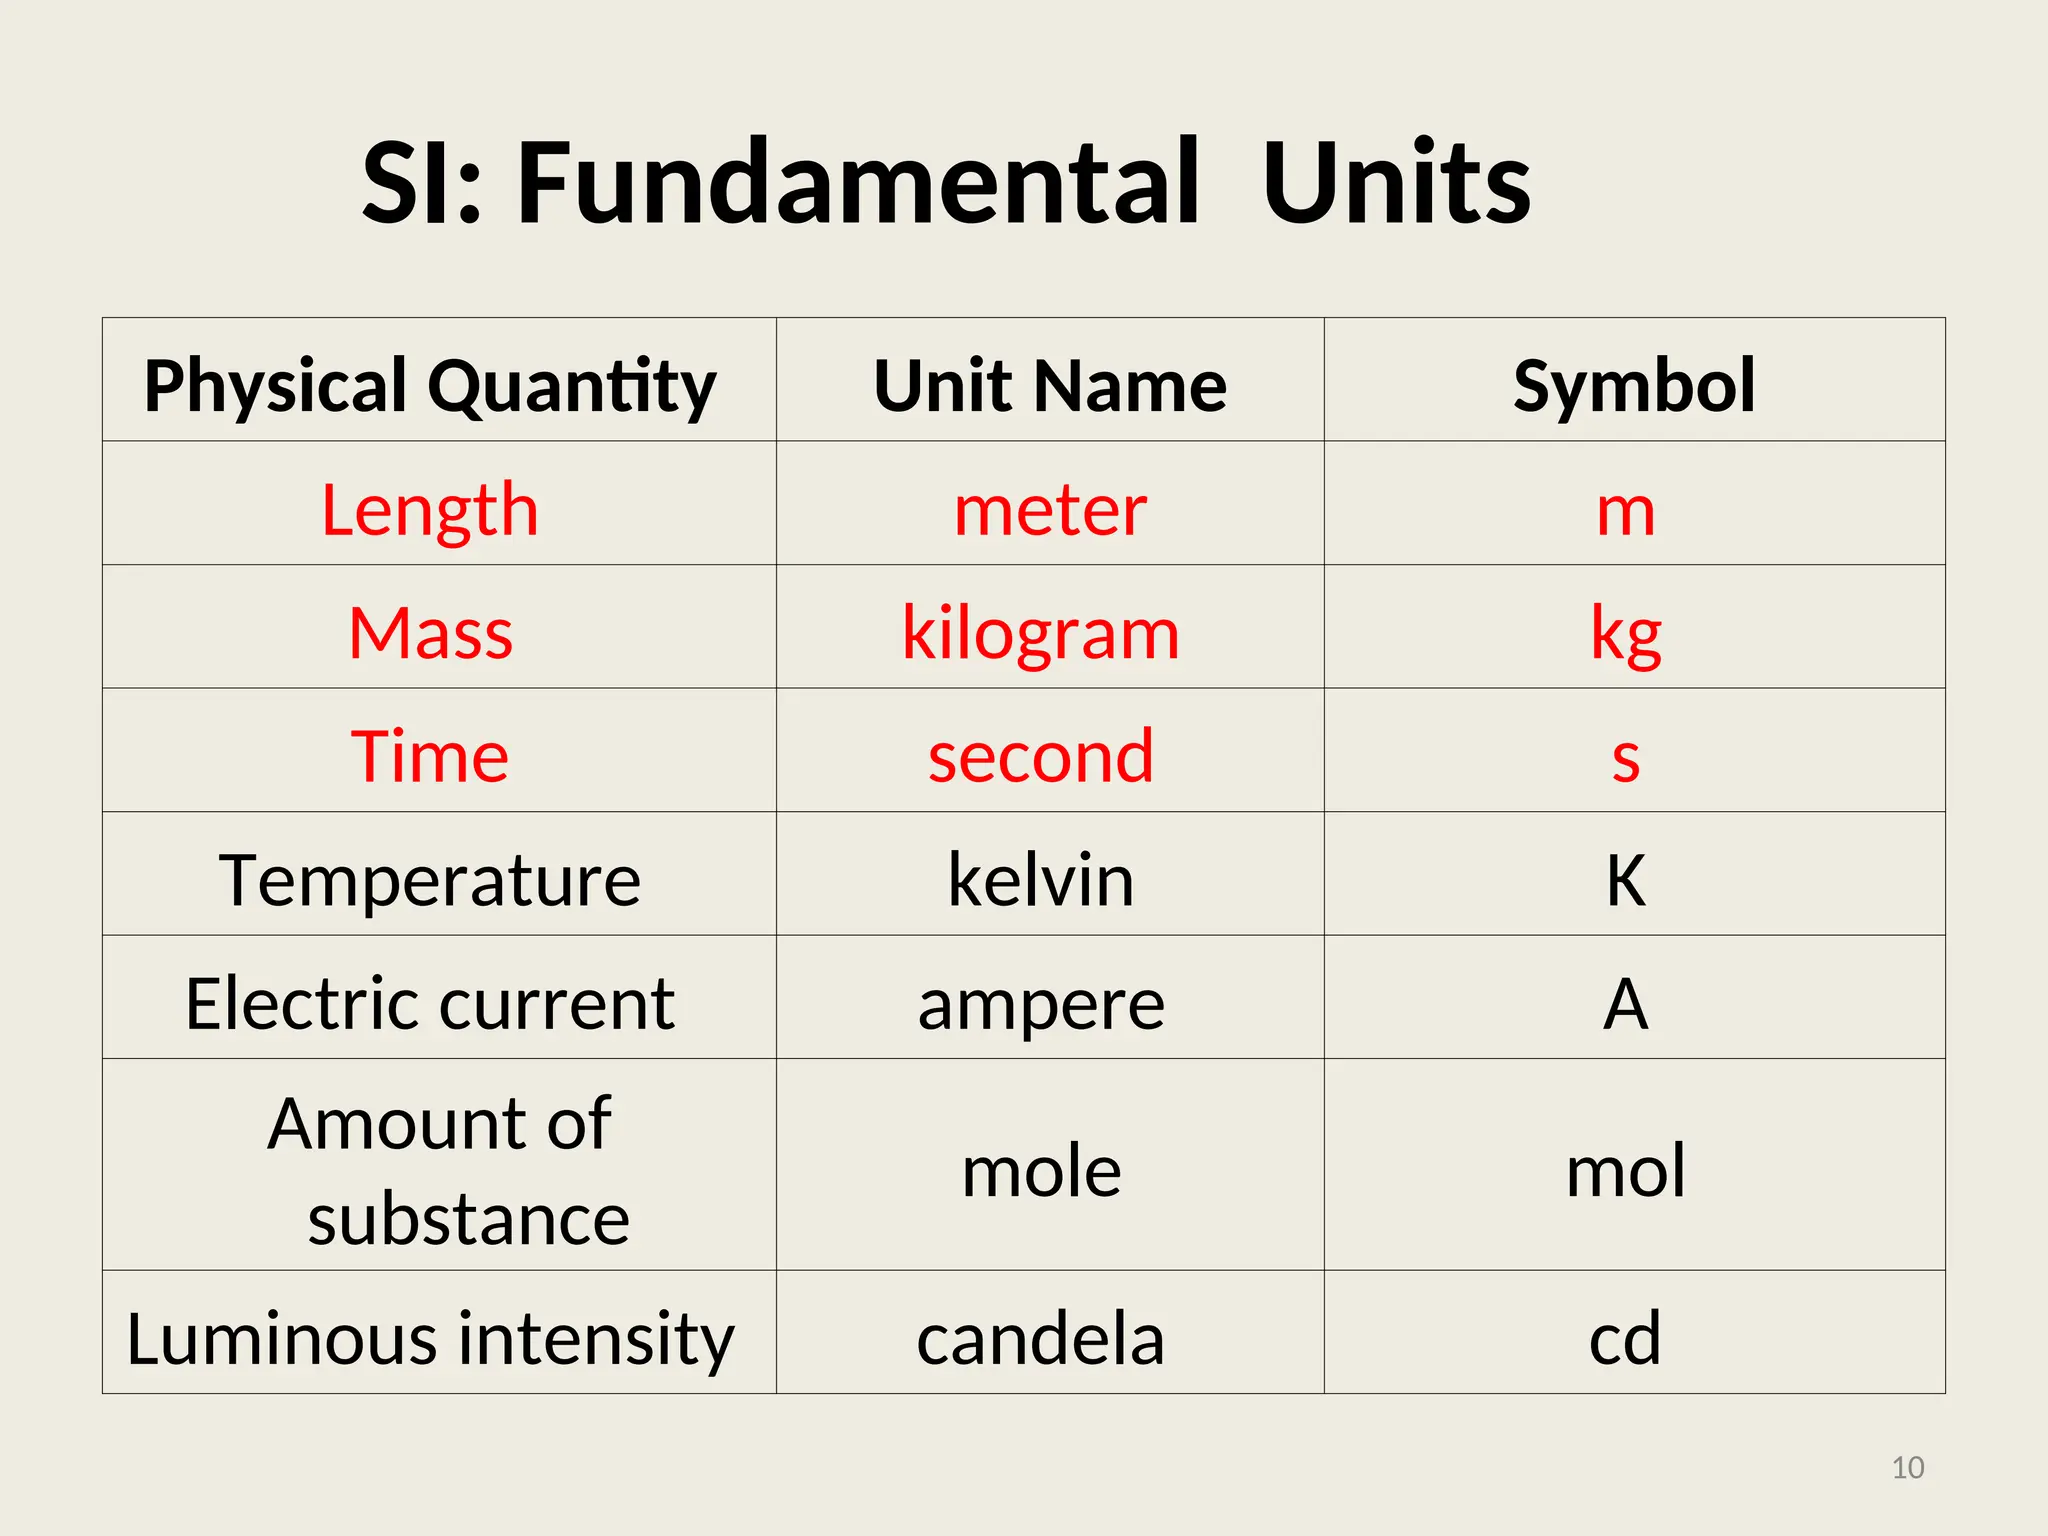
SI: Fundamental Units
PhysicalQuantity Unit Name Symbol
Length meter m
Mass kilogram kg
Time second s
Temperature kelvin K
Electric current ampere A
Amount of
substance
mole mol
Luminous intensity candela cd
10
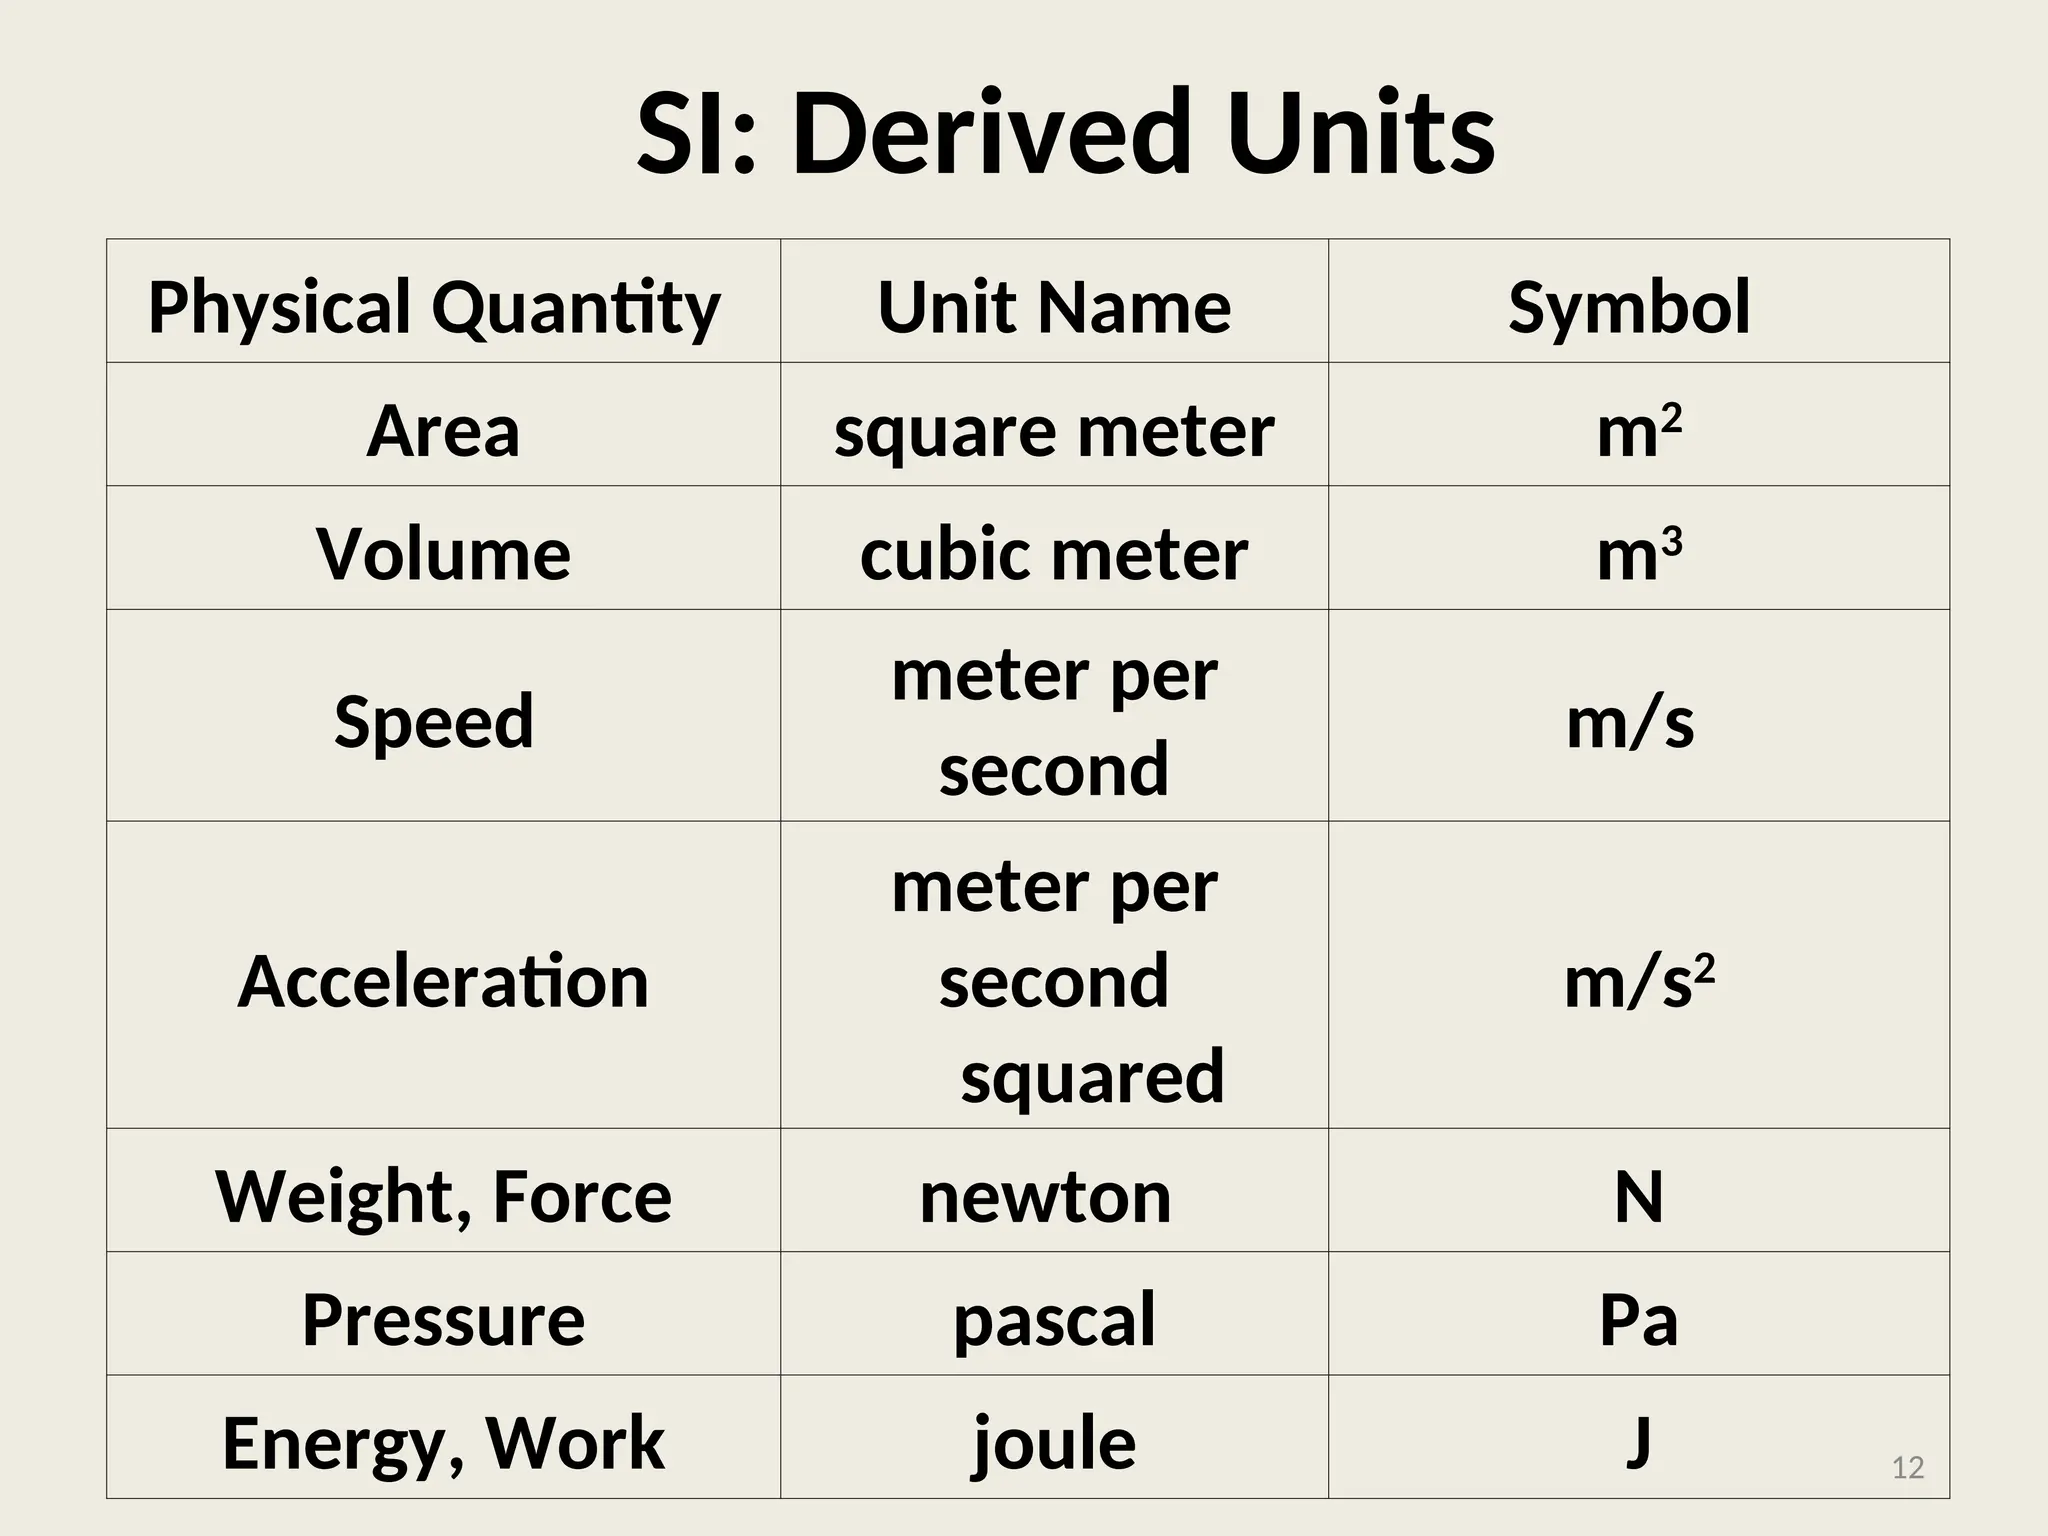
SI: Derived Units
PhysicalQuantity Unit Name Symbol
Area square meter m2
Volume cubic meter m3
Speed
meter per
second
m/s
Acceleration
meter per
second
squared
m/s2
Weight, Force newton N
Pressure pascal Pa
Energy, Work joule J 12
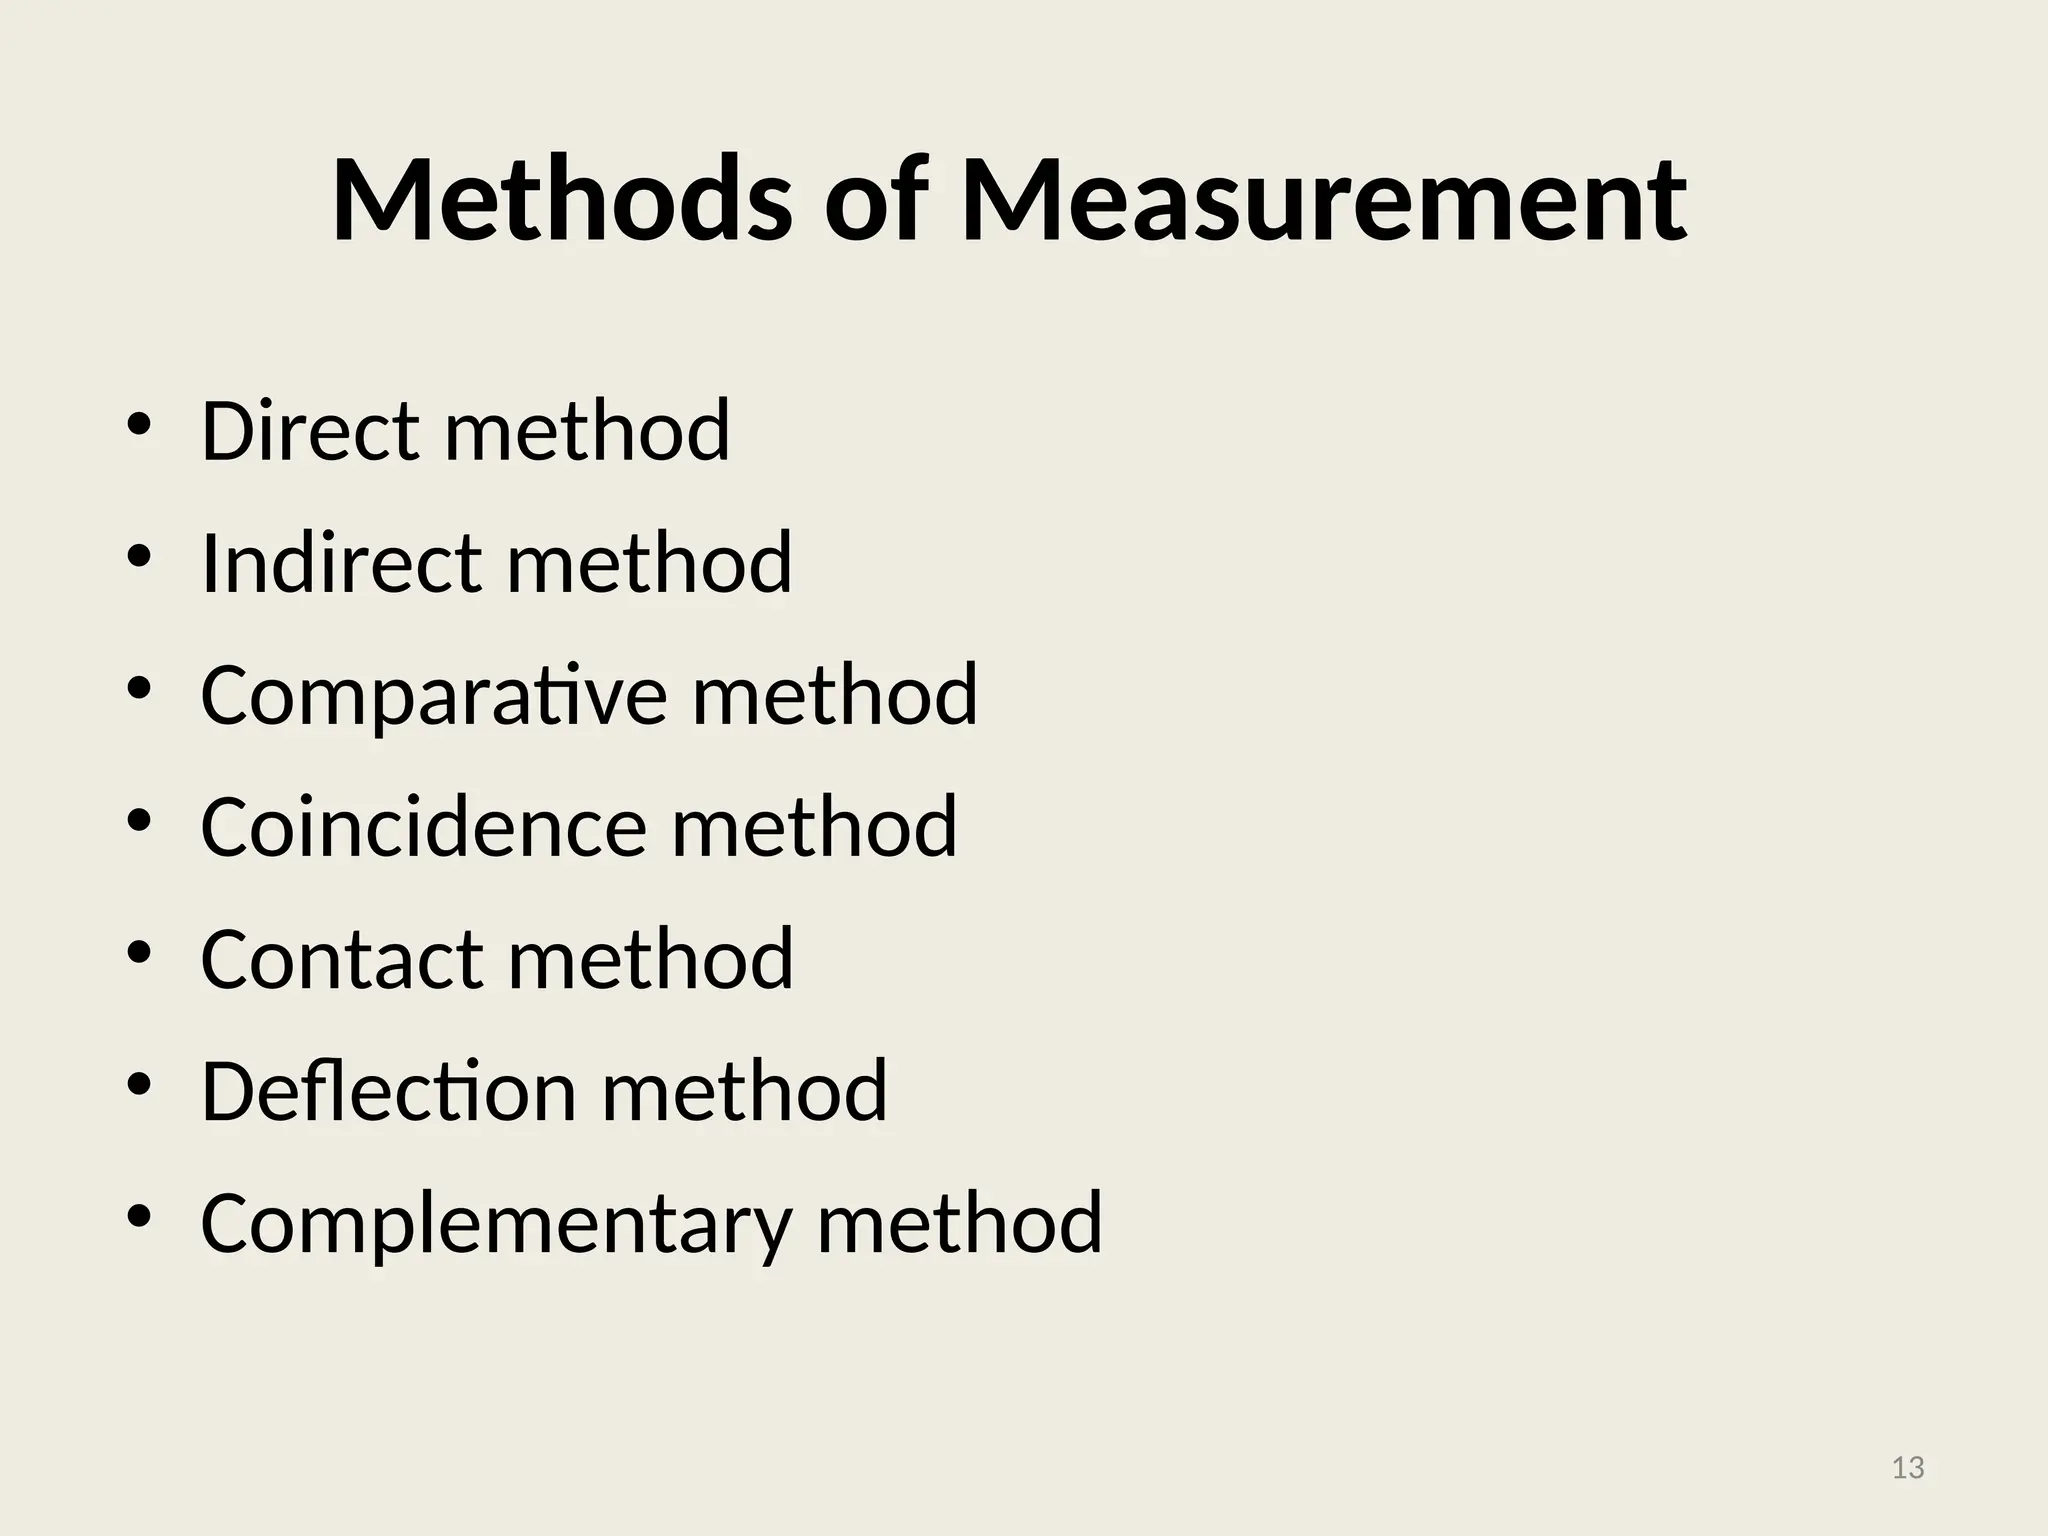
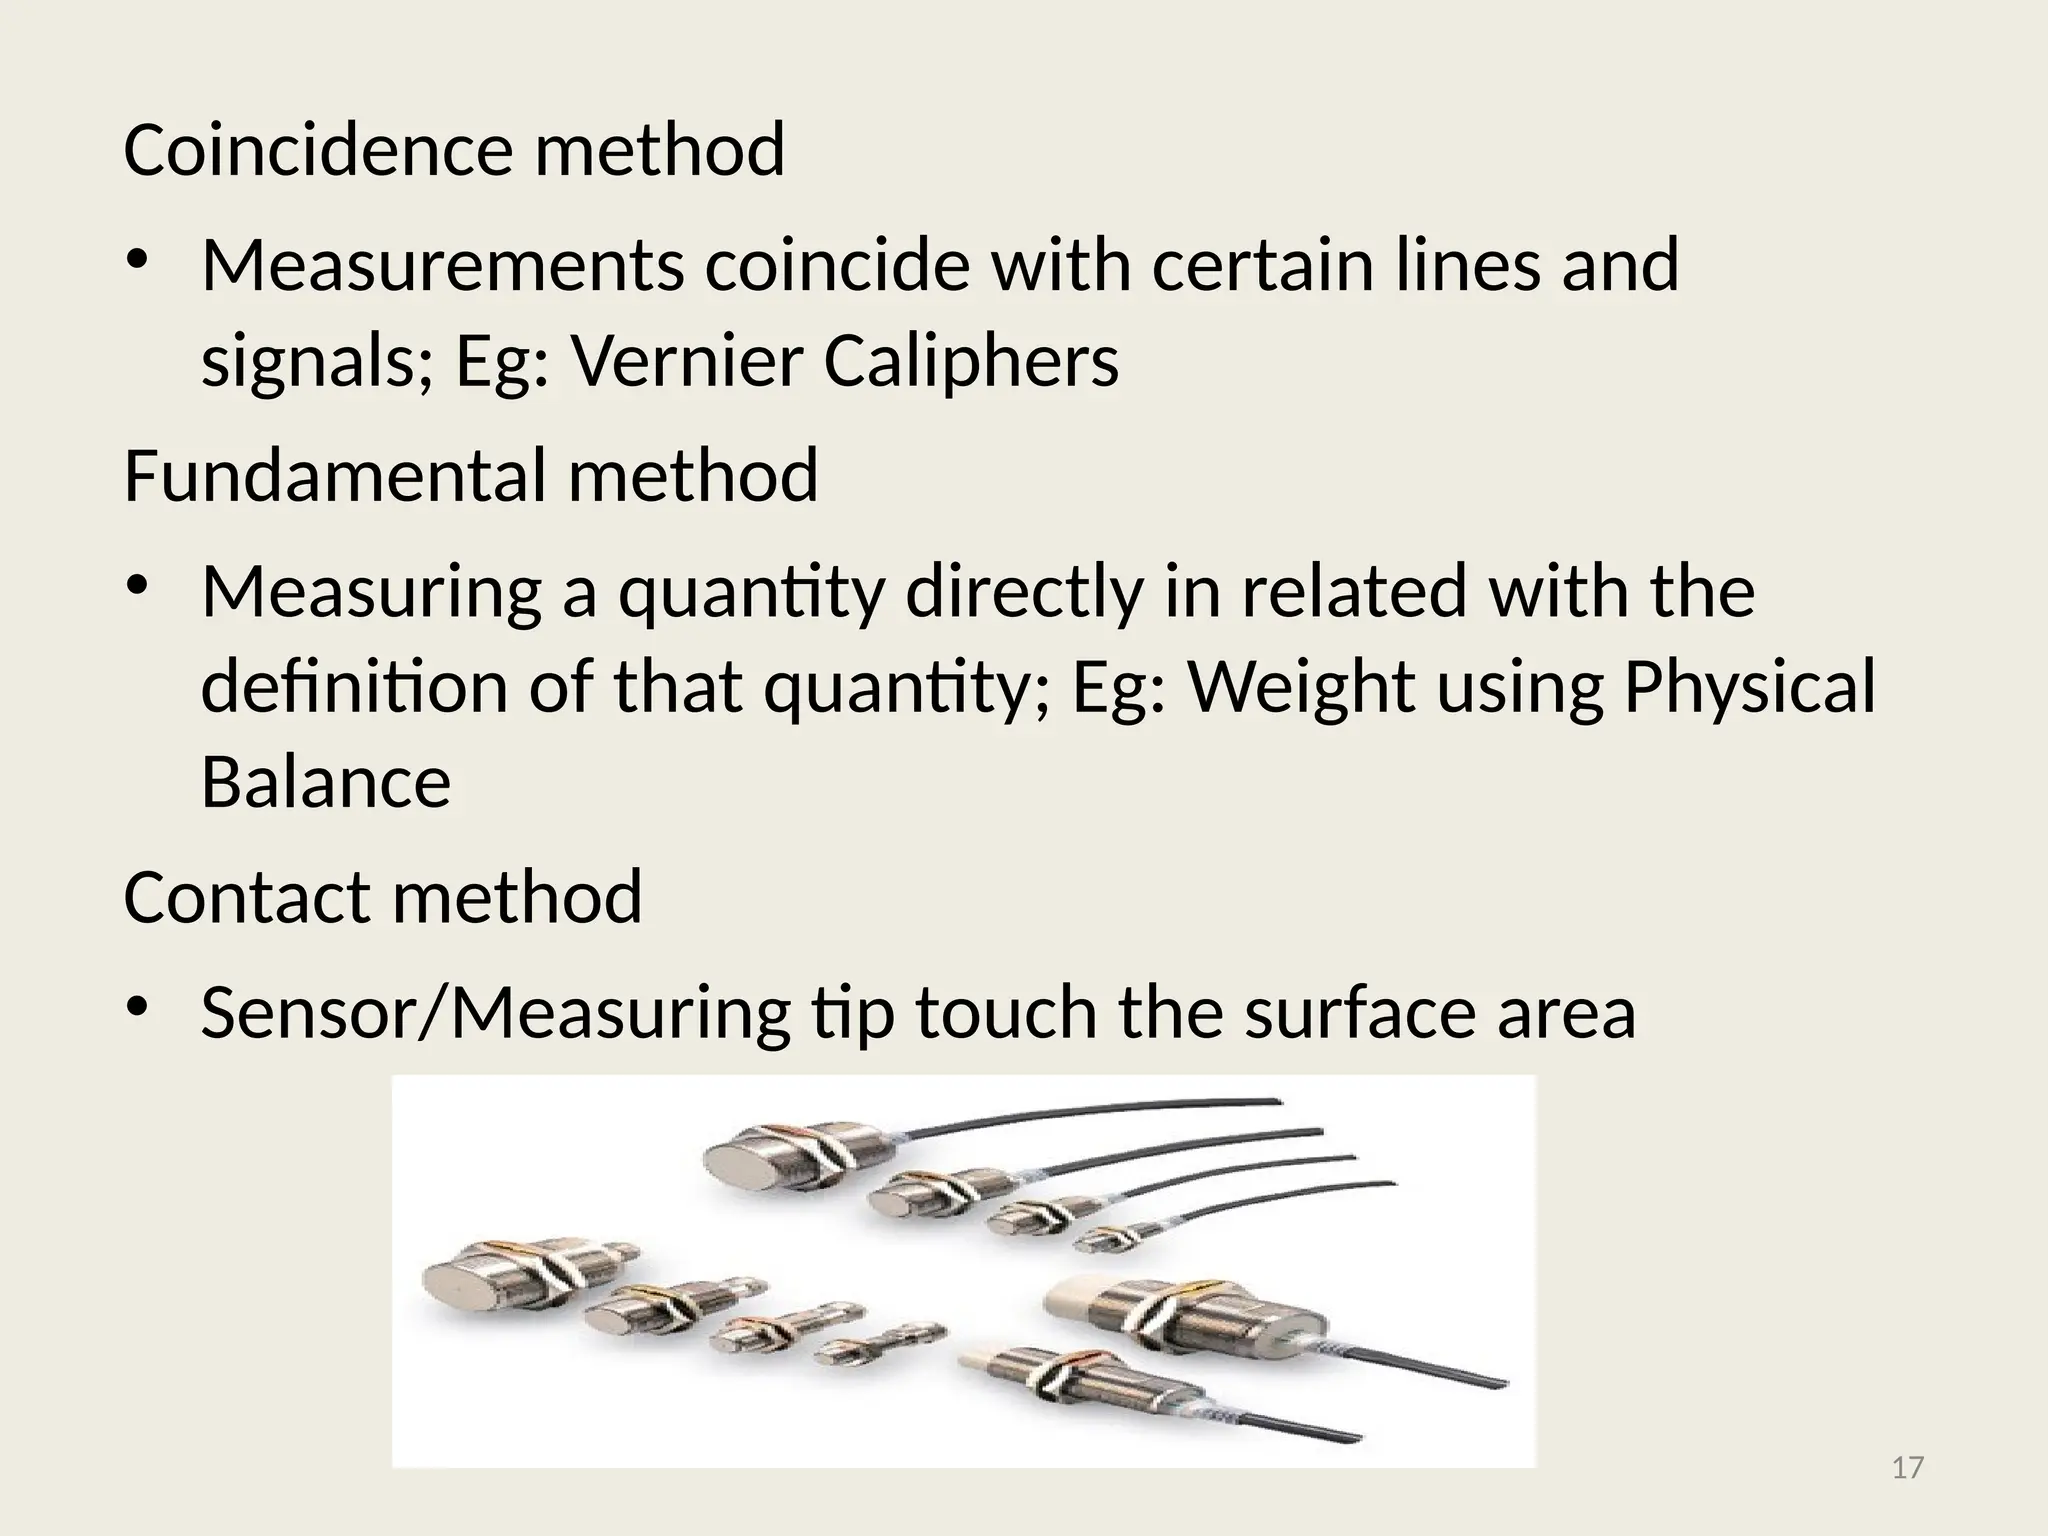
Coincidence method
• Measurementscoincide with certain lines and
signals; Eg: Vernier Caliphers
Fundamental method
• Measuring a quantity directly in related with the
definition of that quantity; Eg: Weight using Physical
Balance
Contact method
• Sensor/Measuring tip touch the surface area
17
18.
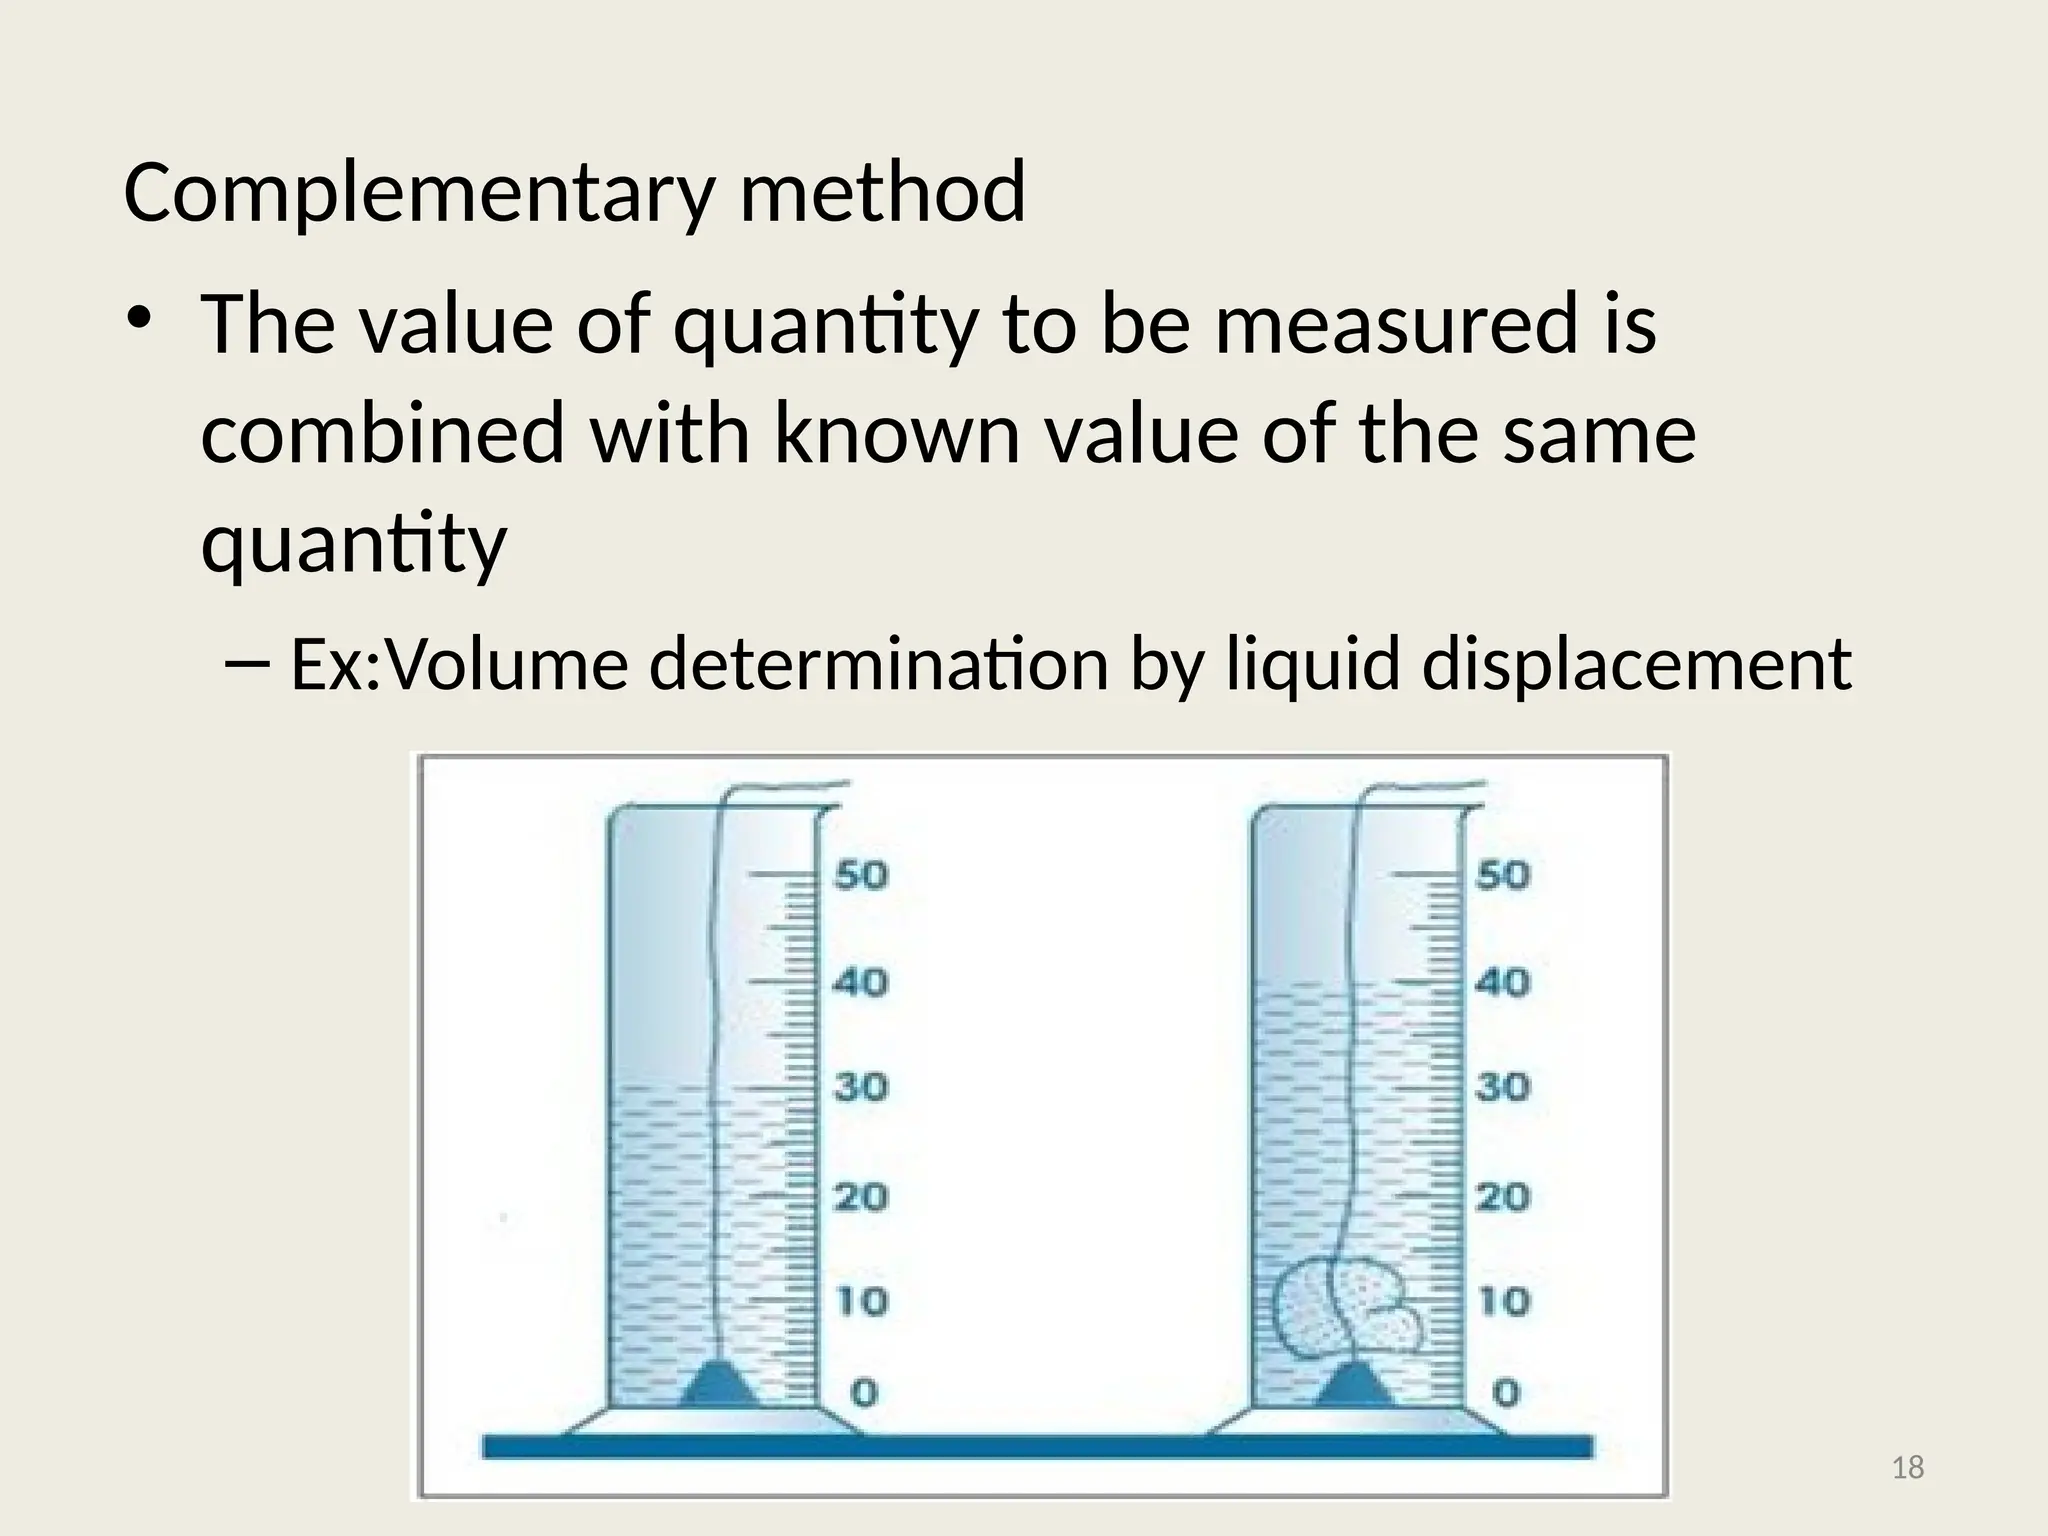
Complementary method
• Thevalue of quantity to be measured is
combined with known value of the same
quantity
– Ex:Volume determination by liquid displacement
18
19.
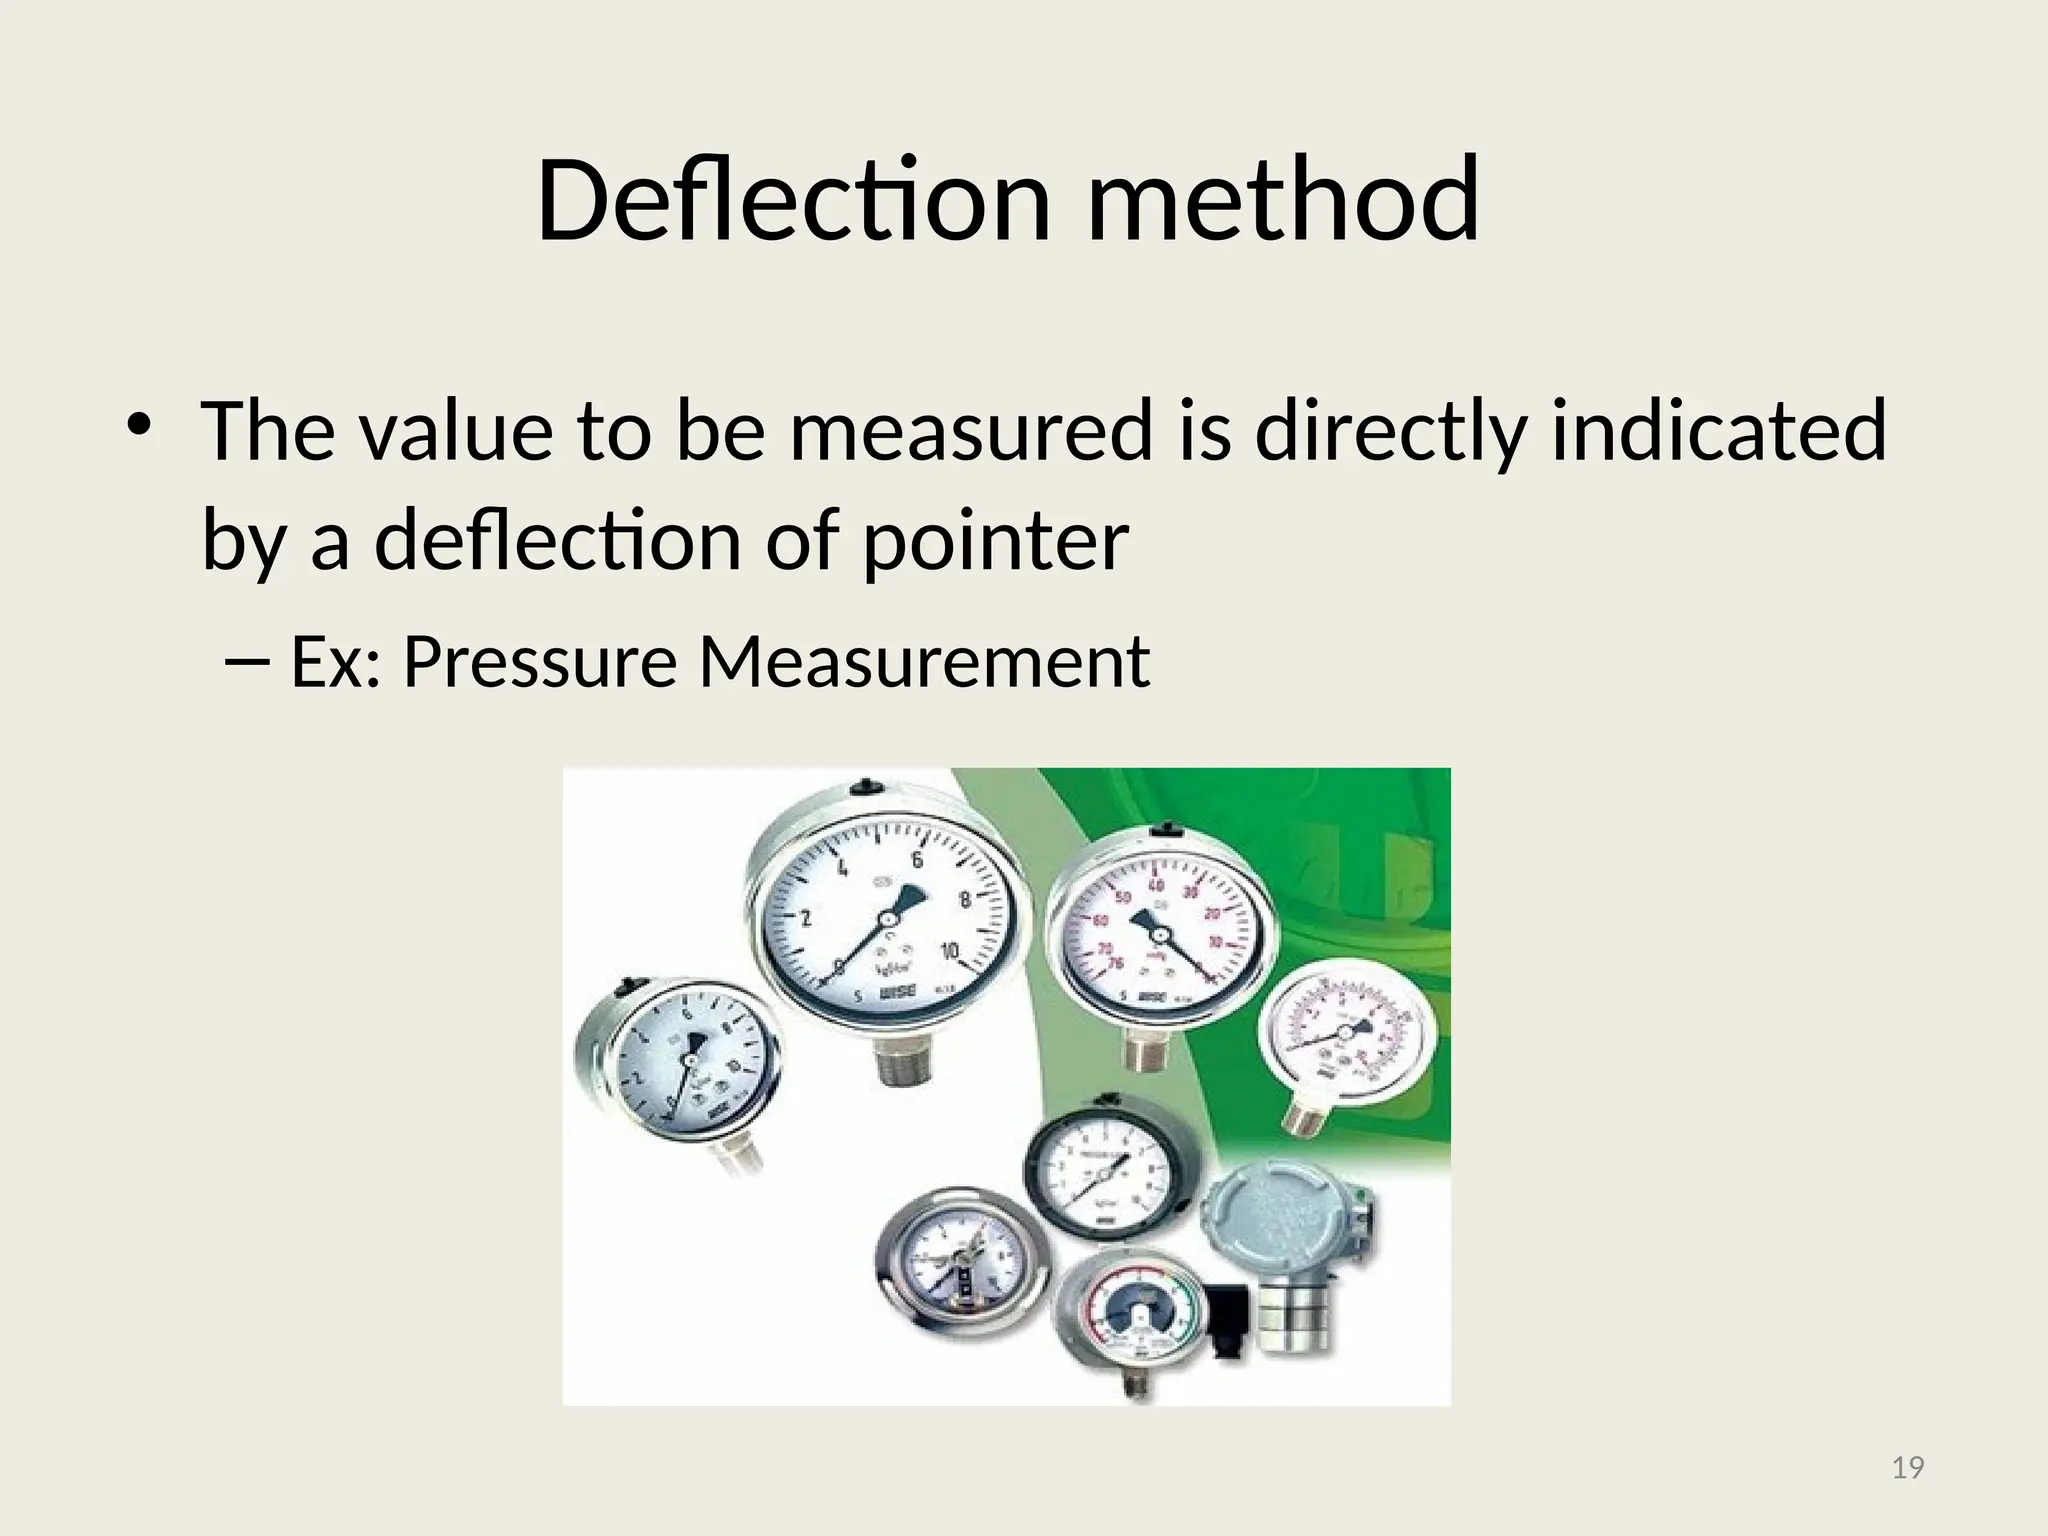
Deflection method
• Thevalue to be measured is directly indicated
by a deflection of pointer
– Ex: Pressure Measurement
19
20.
Measuring Instruments
• Deflectionand null type instruments
• Analog and digital instruments
• Active and passive instruments
• Automatic and manually operated
instruments
• Contacting and non contacting instruments
• Absolute and secondary instruments
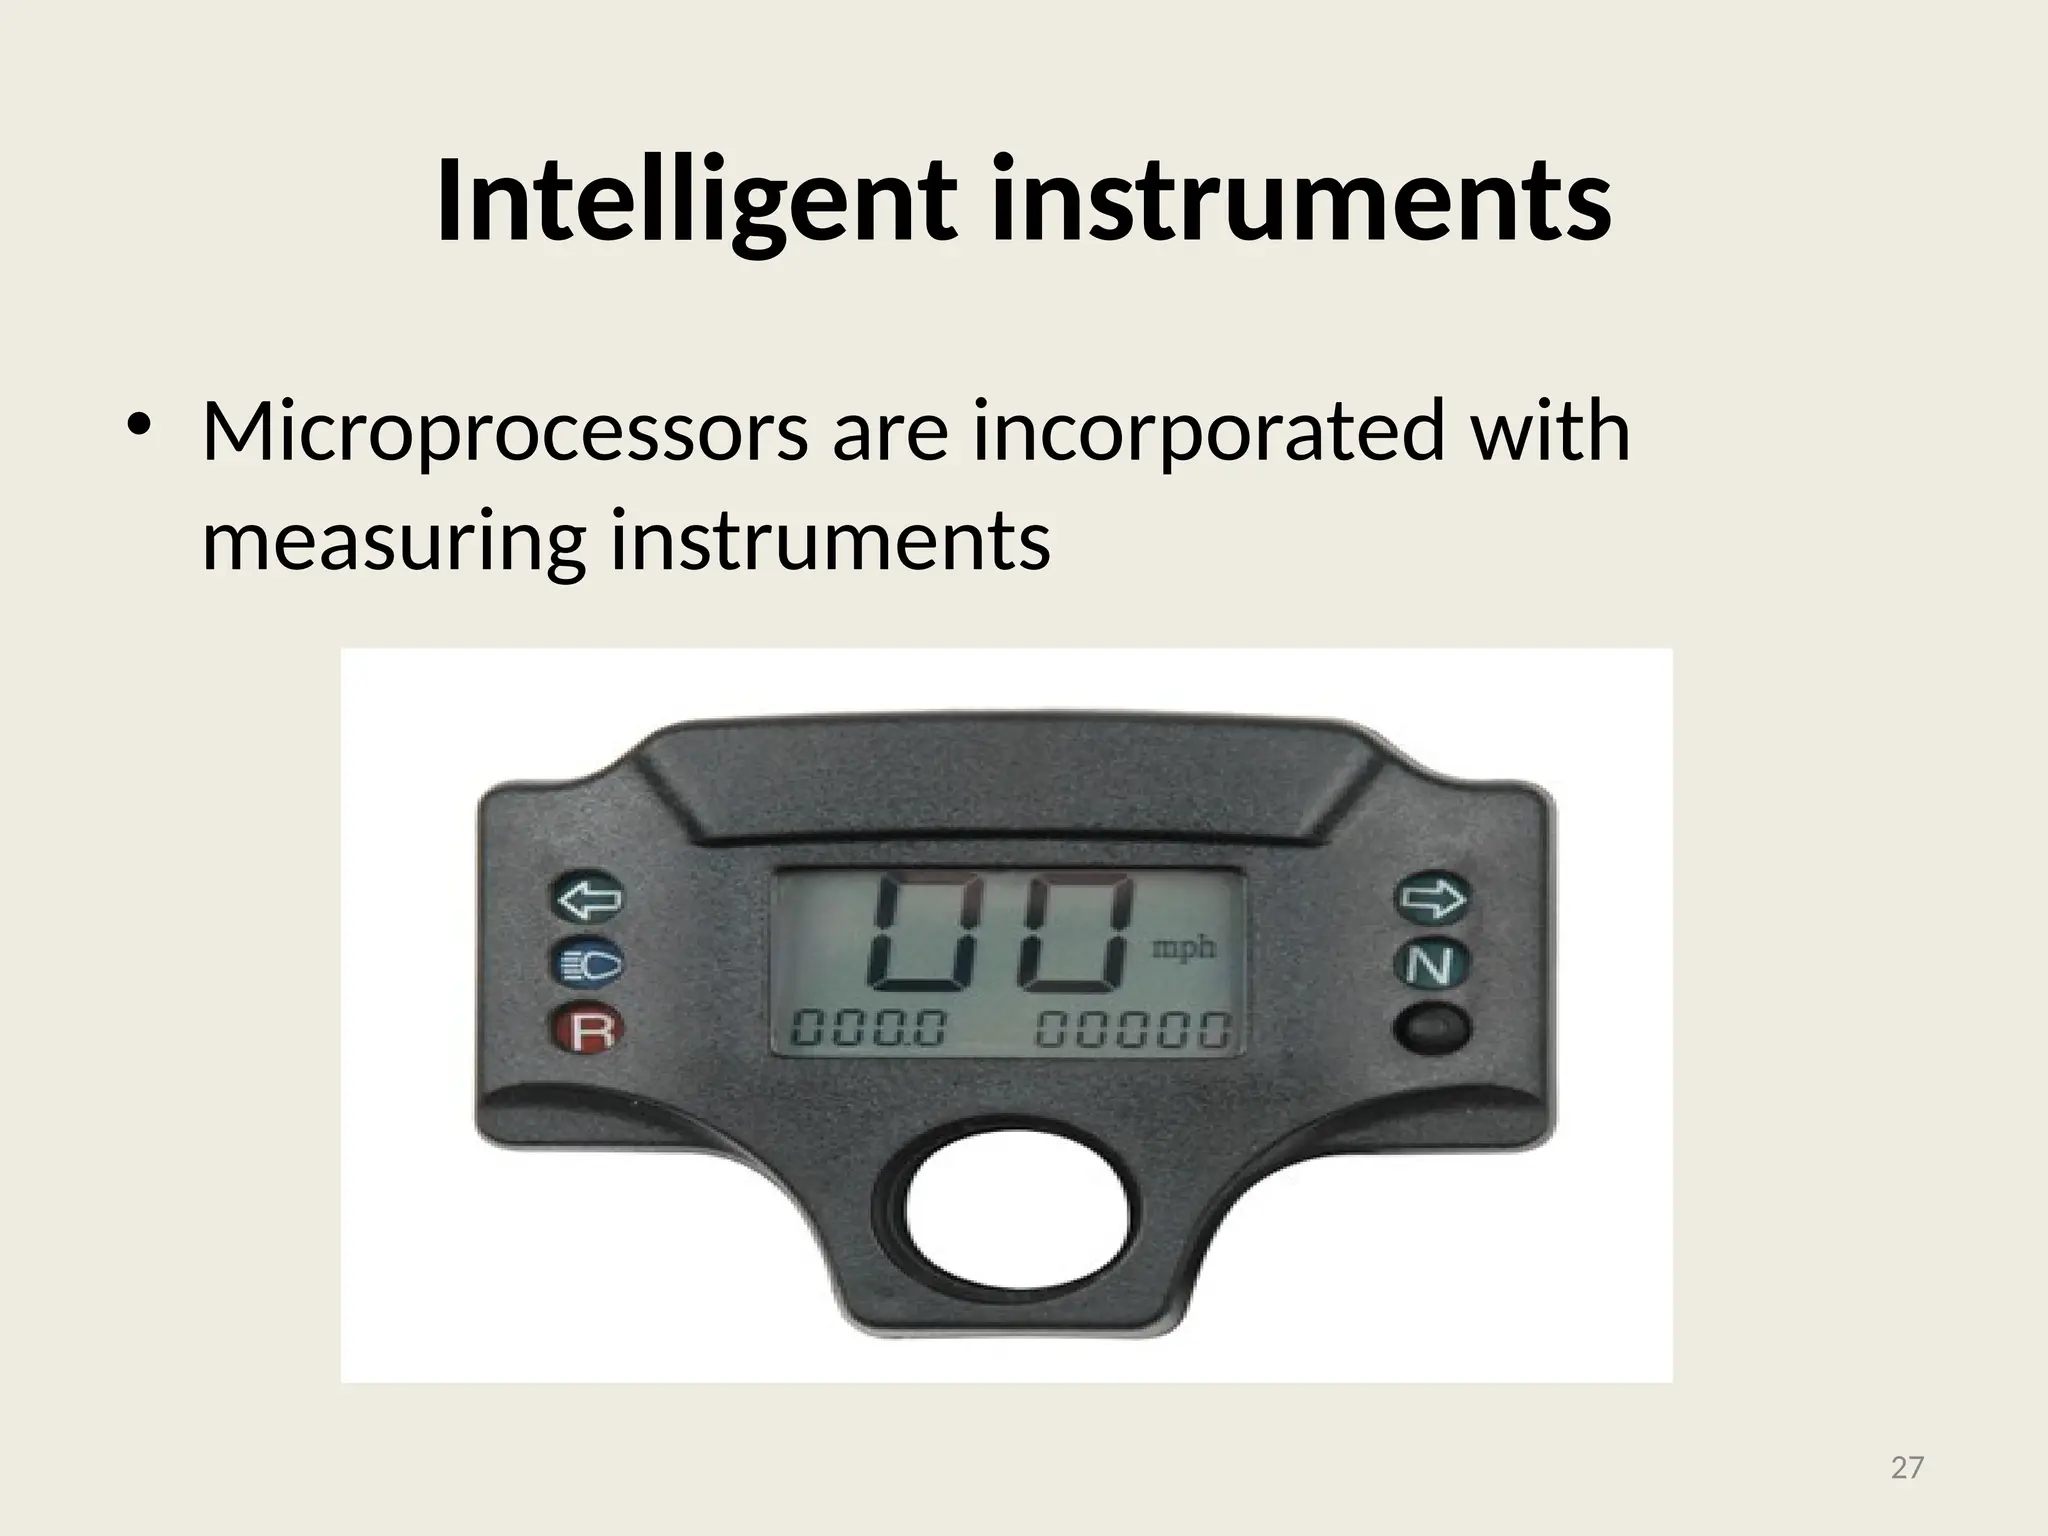
• Intelligent instruments.
20
21.
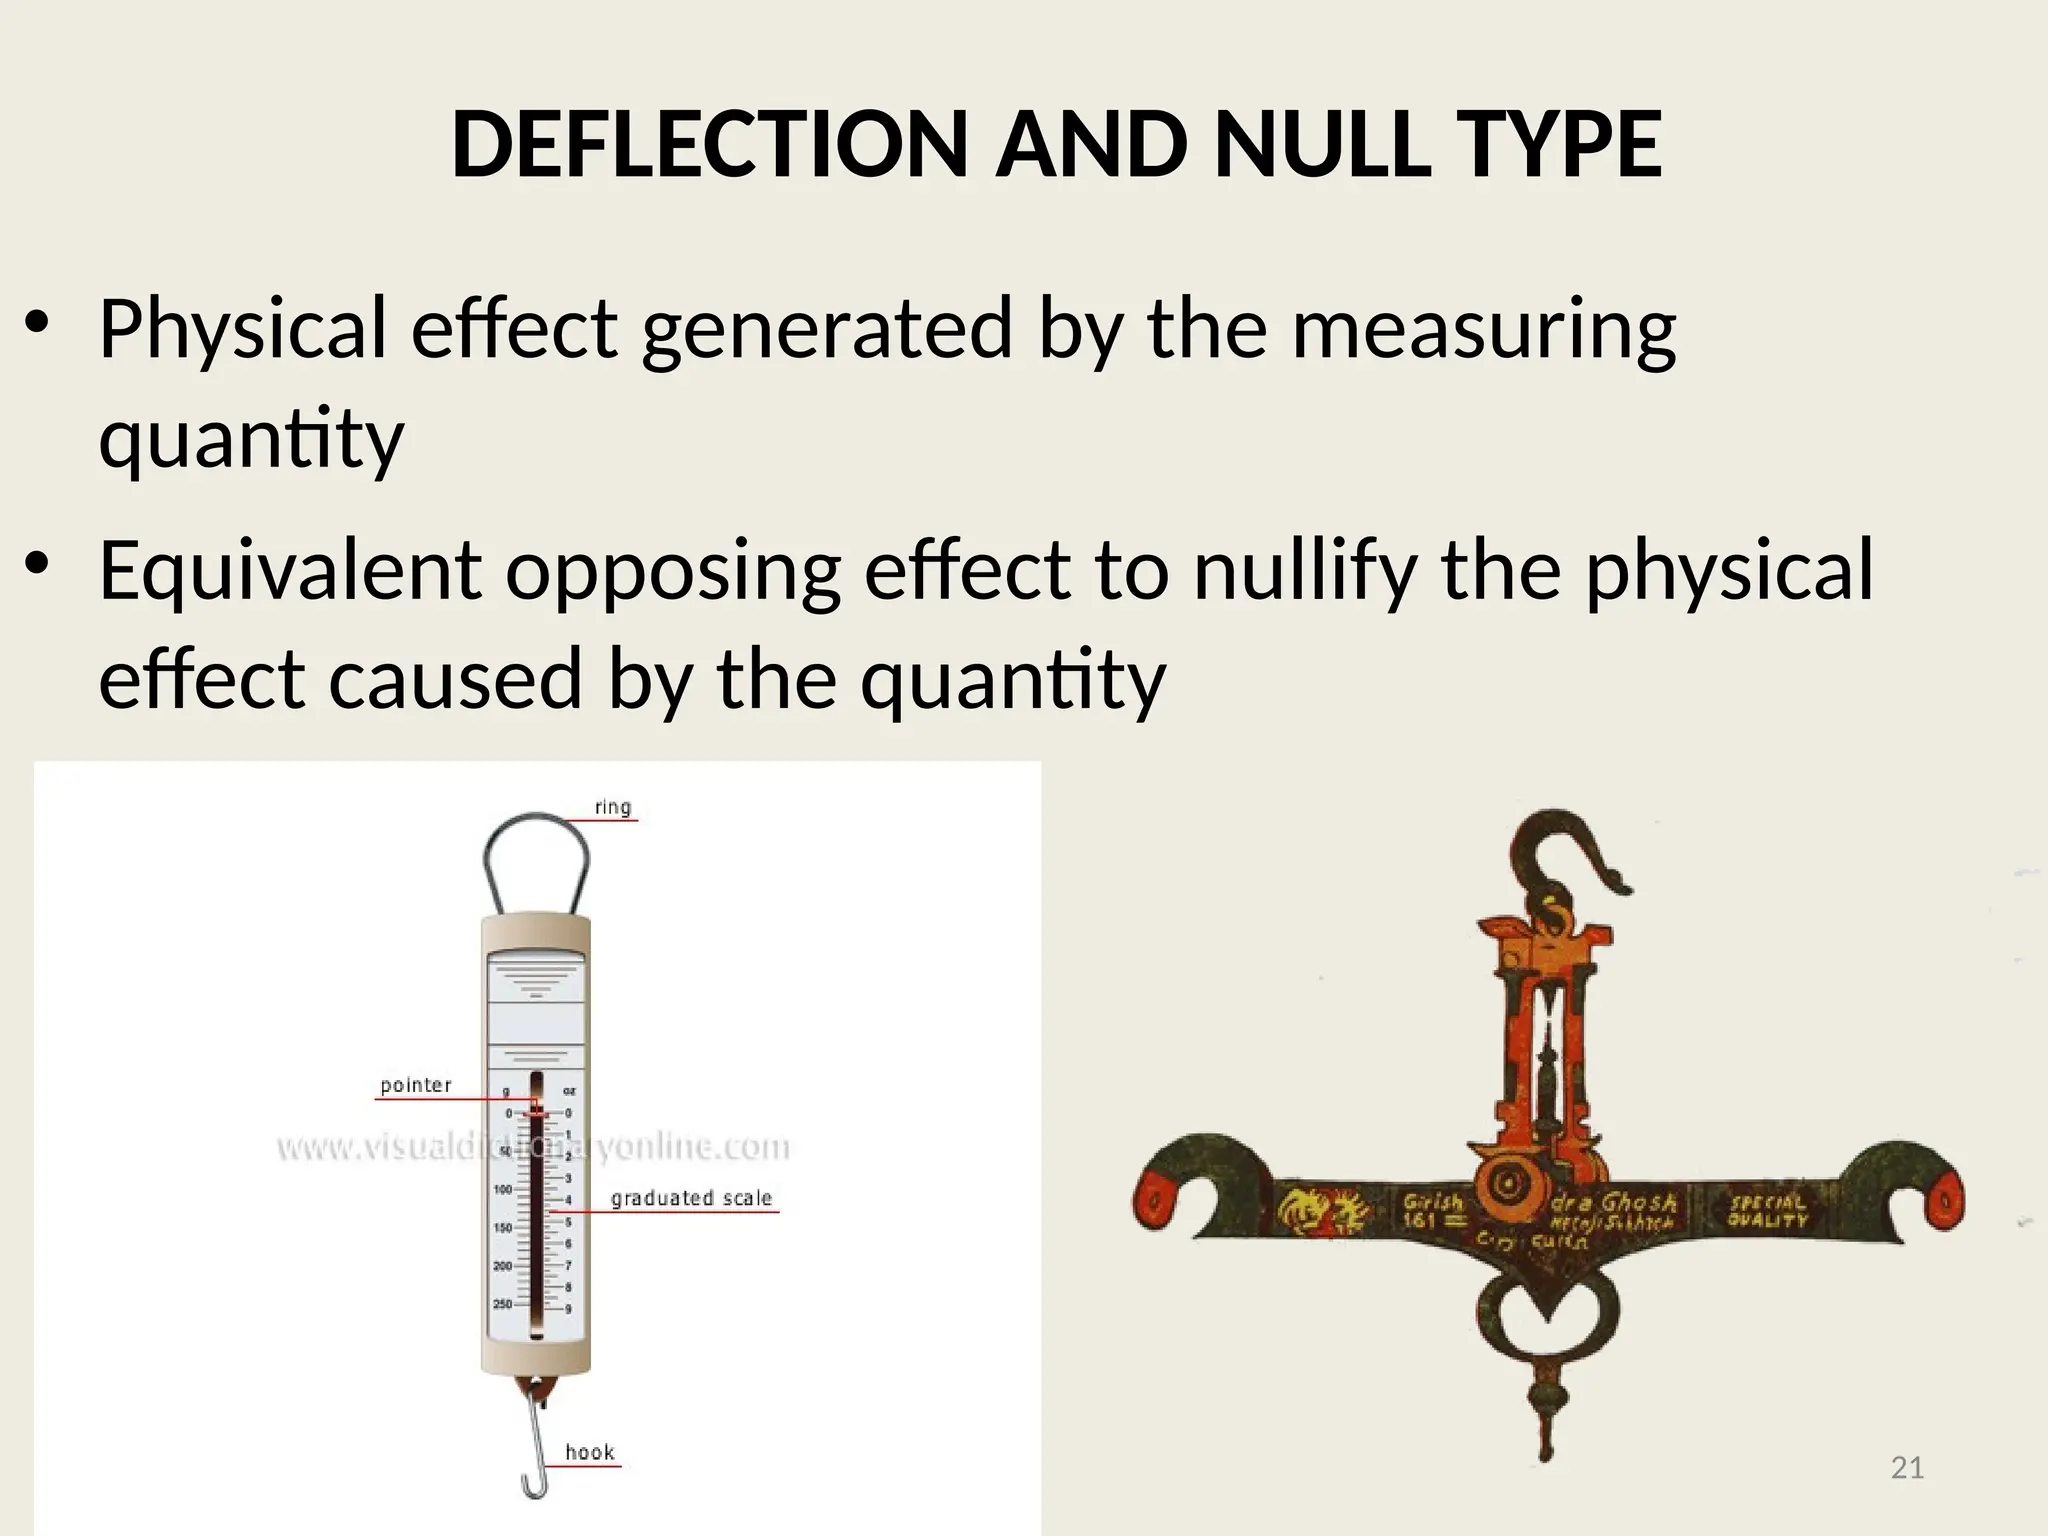
DEFLECTION AND NULLTYPE
• Physical effect generated by the measuring
quantity
• Equivalent opposing effect to nullify the physical
effect caused by the quantity
21
22.
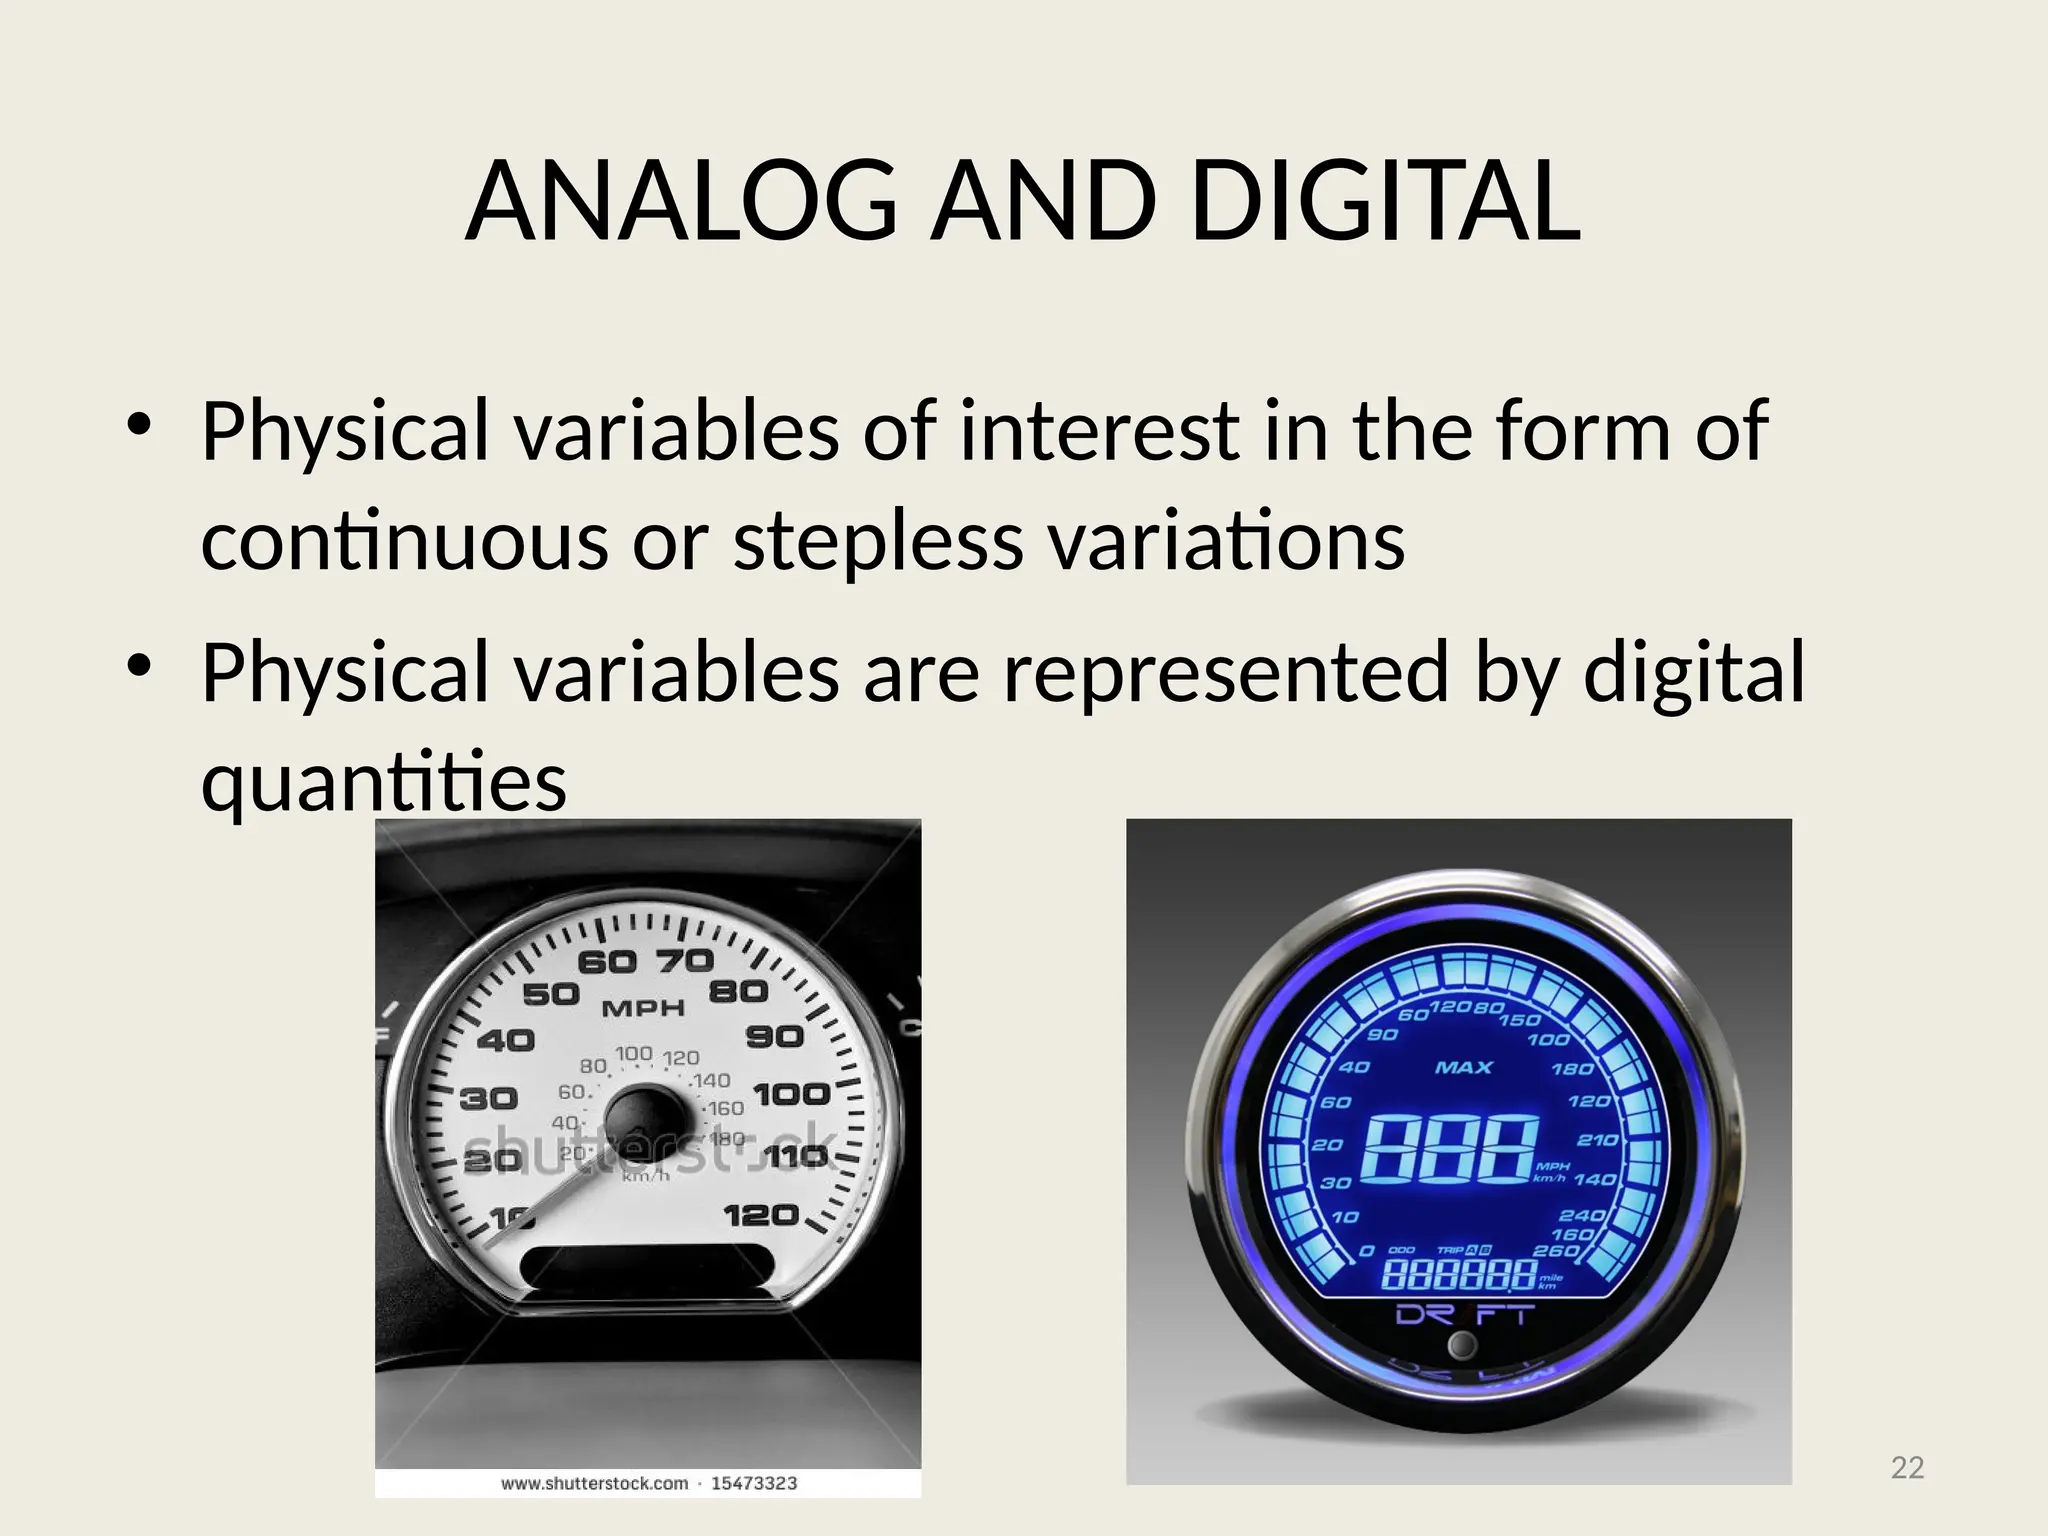
ANALOG AND DIGITAL
•Physical variables of interest in the form of
continuous or stepless variations
• Physical variables are represented by digital
quantities
22
23.
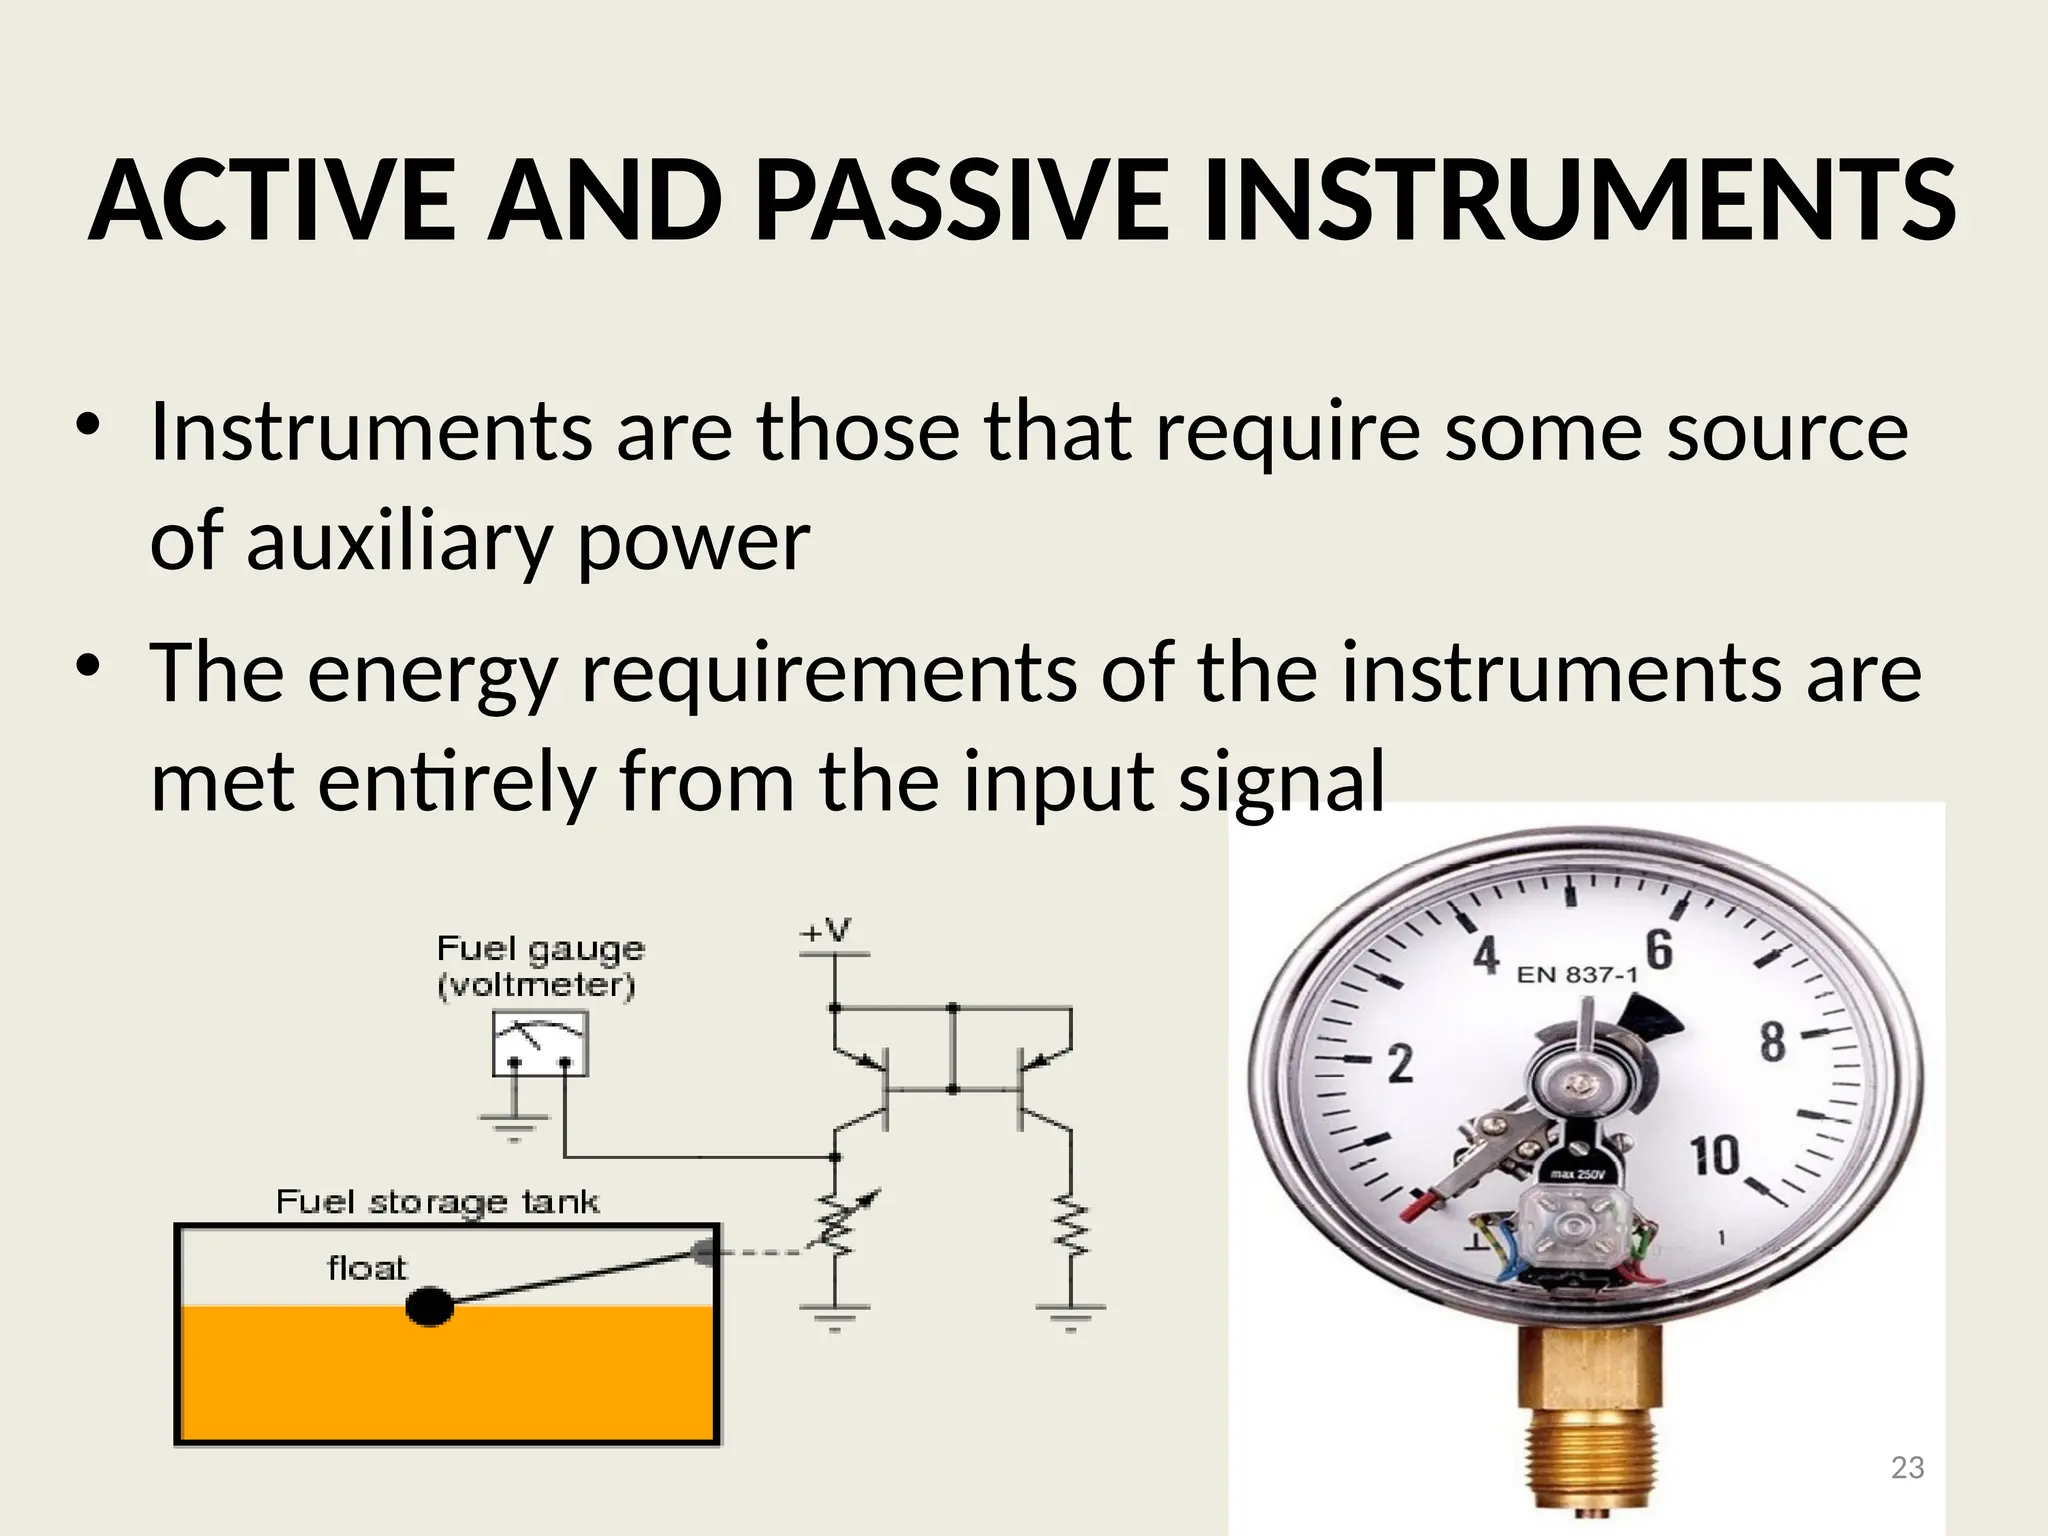
ACTIVE AND PASSIVEINSTRUMENTS
• Instruments are those that require some source
of auxiliary power
• The energy requirements of the instruments are
met entirely from the input signal
23
24.
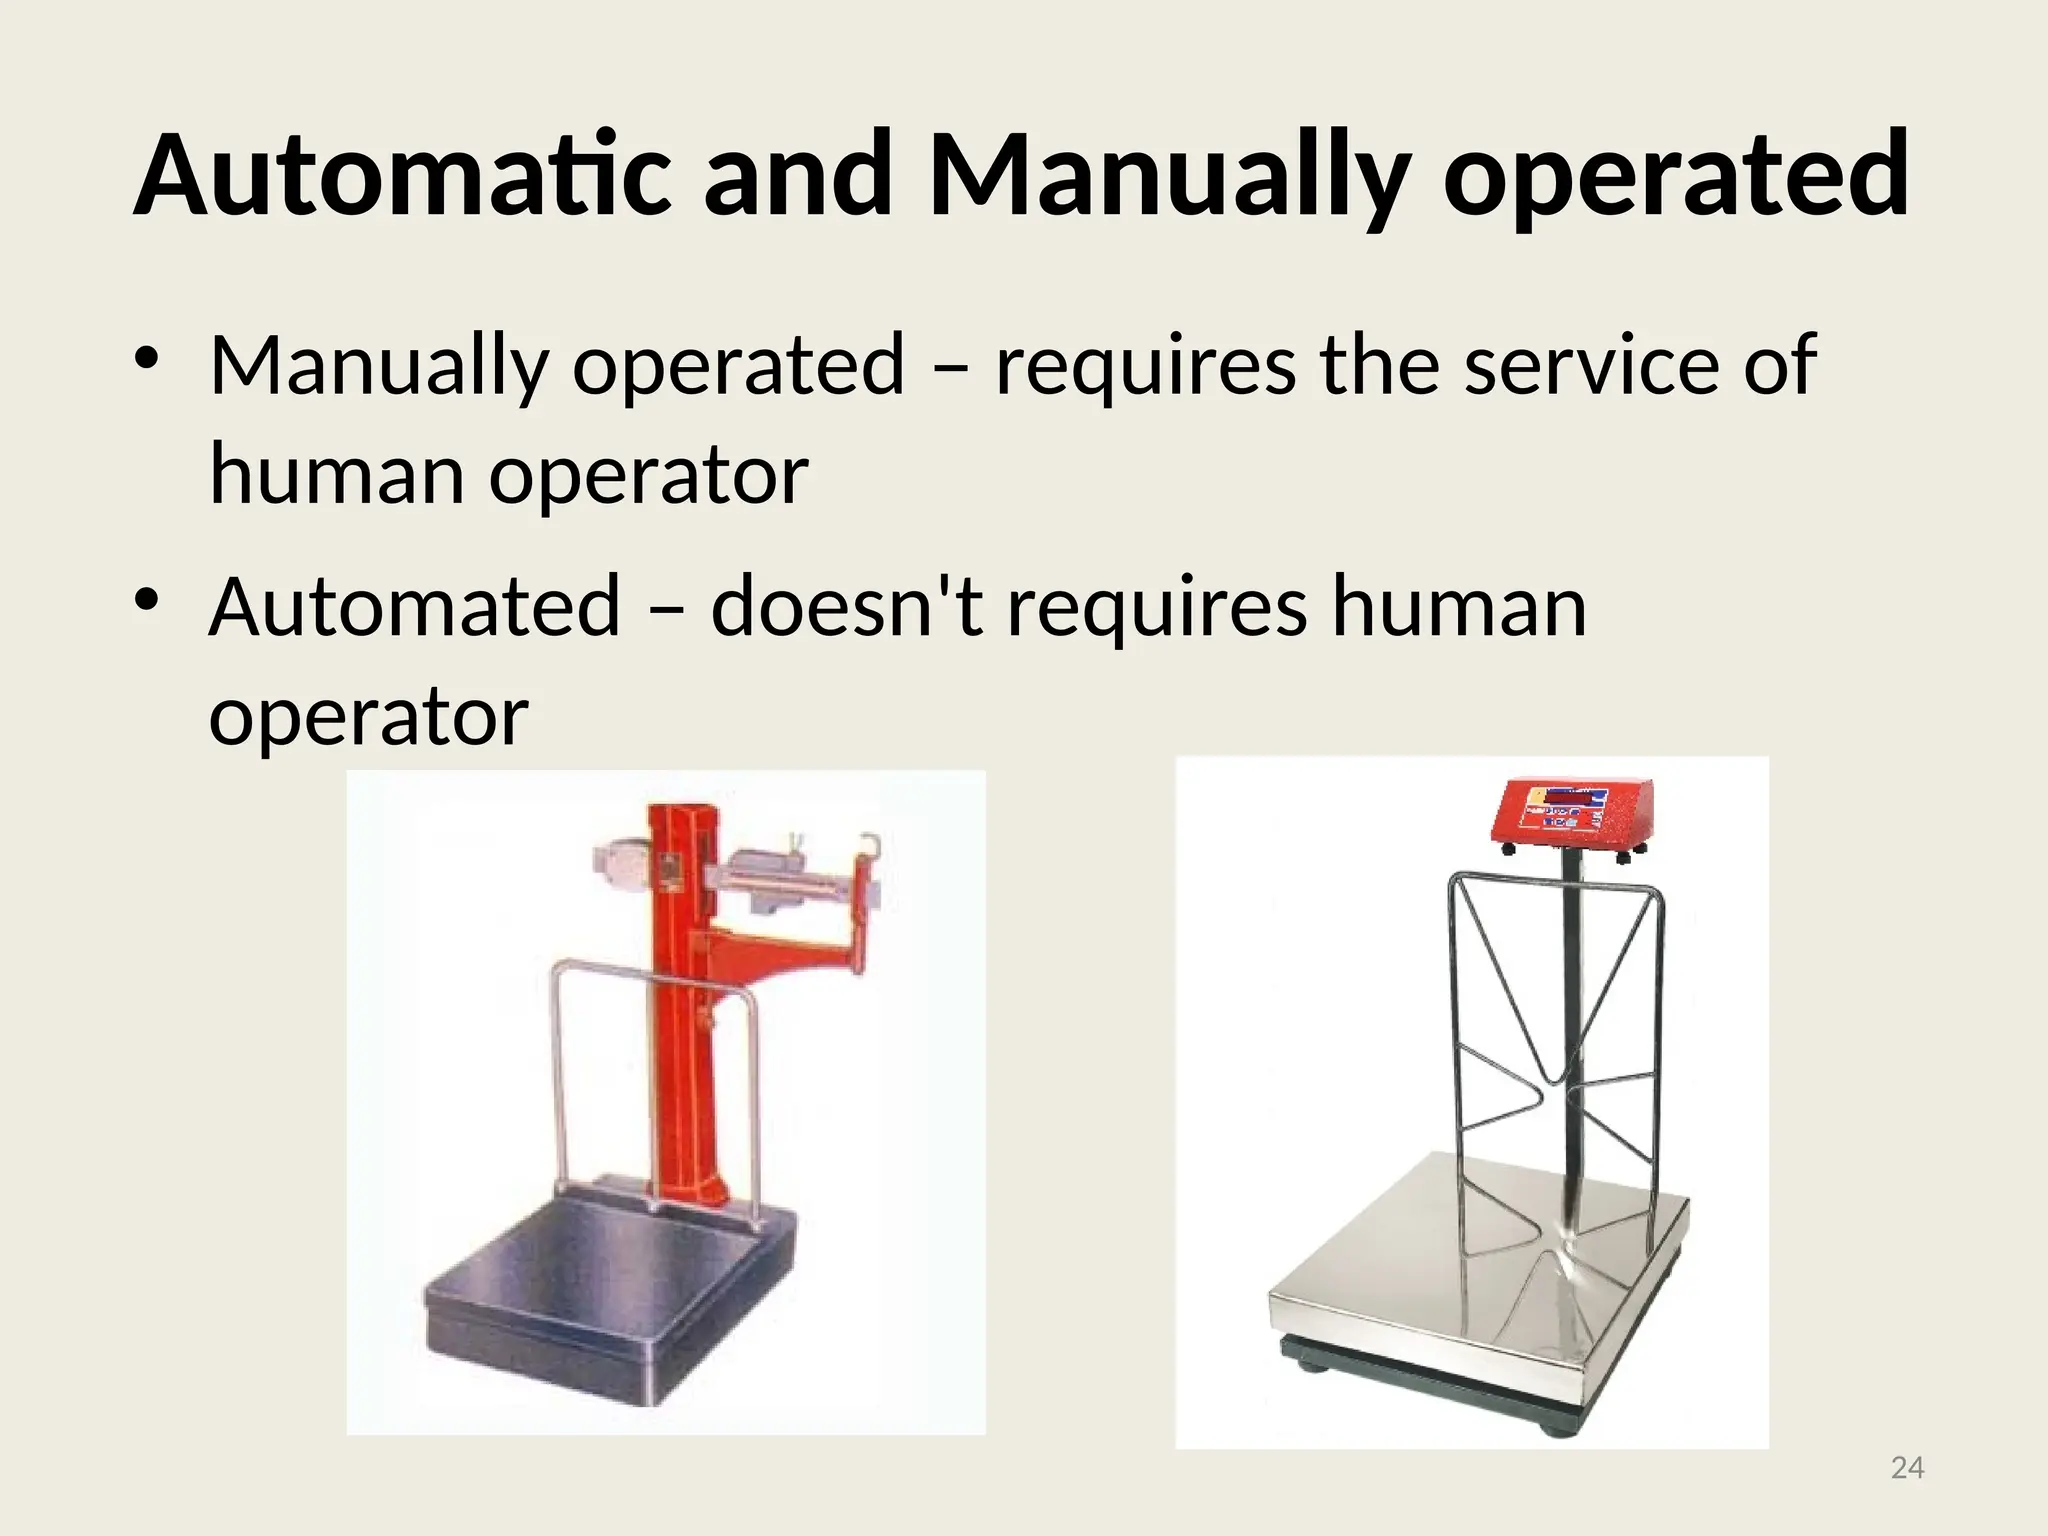
Automatic and Manuallyoperated
• Manually operated – requires the service of
human operator
• Automated – doesn't requires human
operator
24
25.
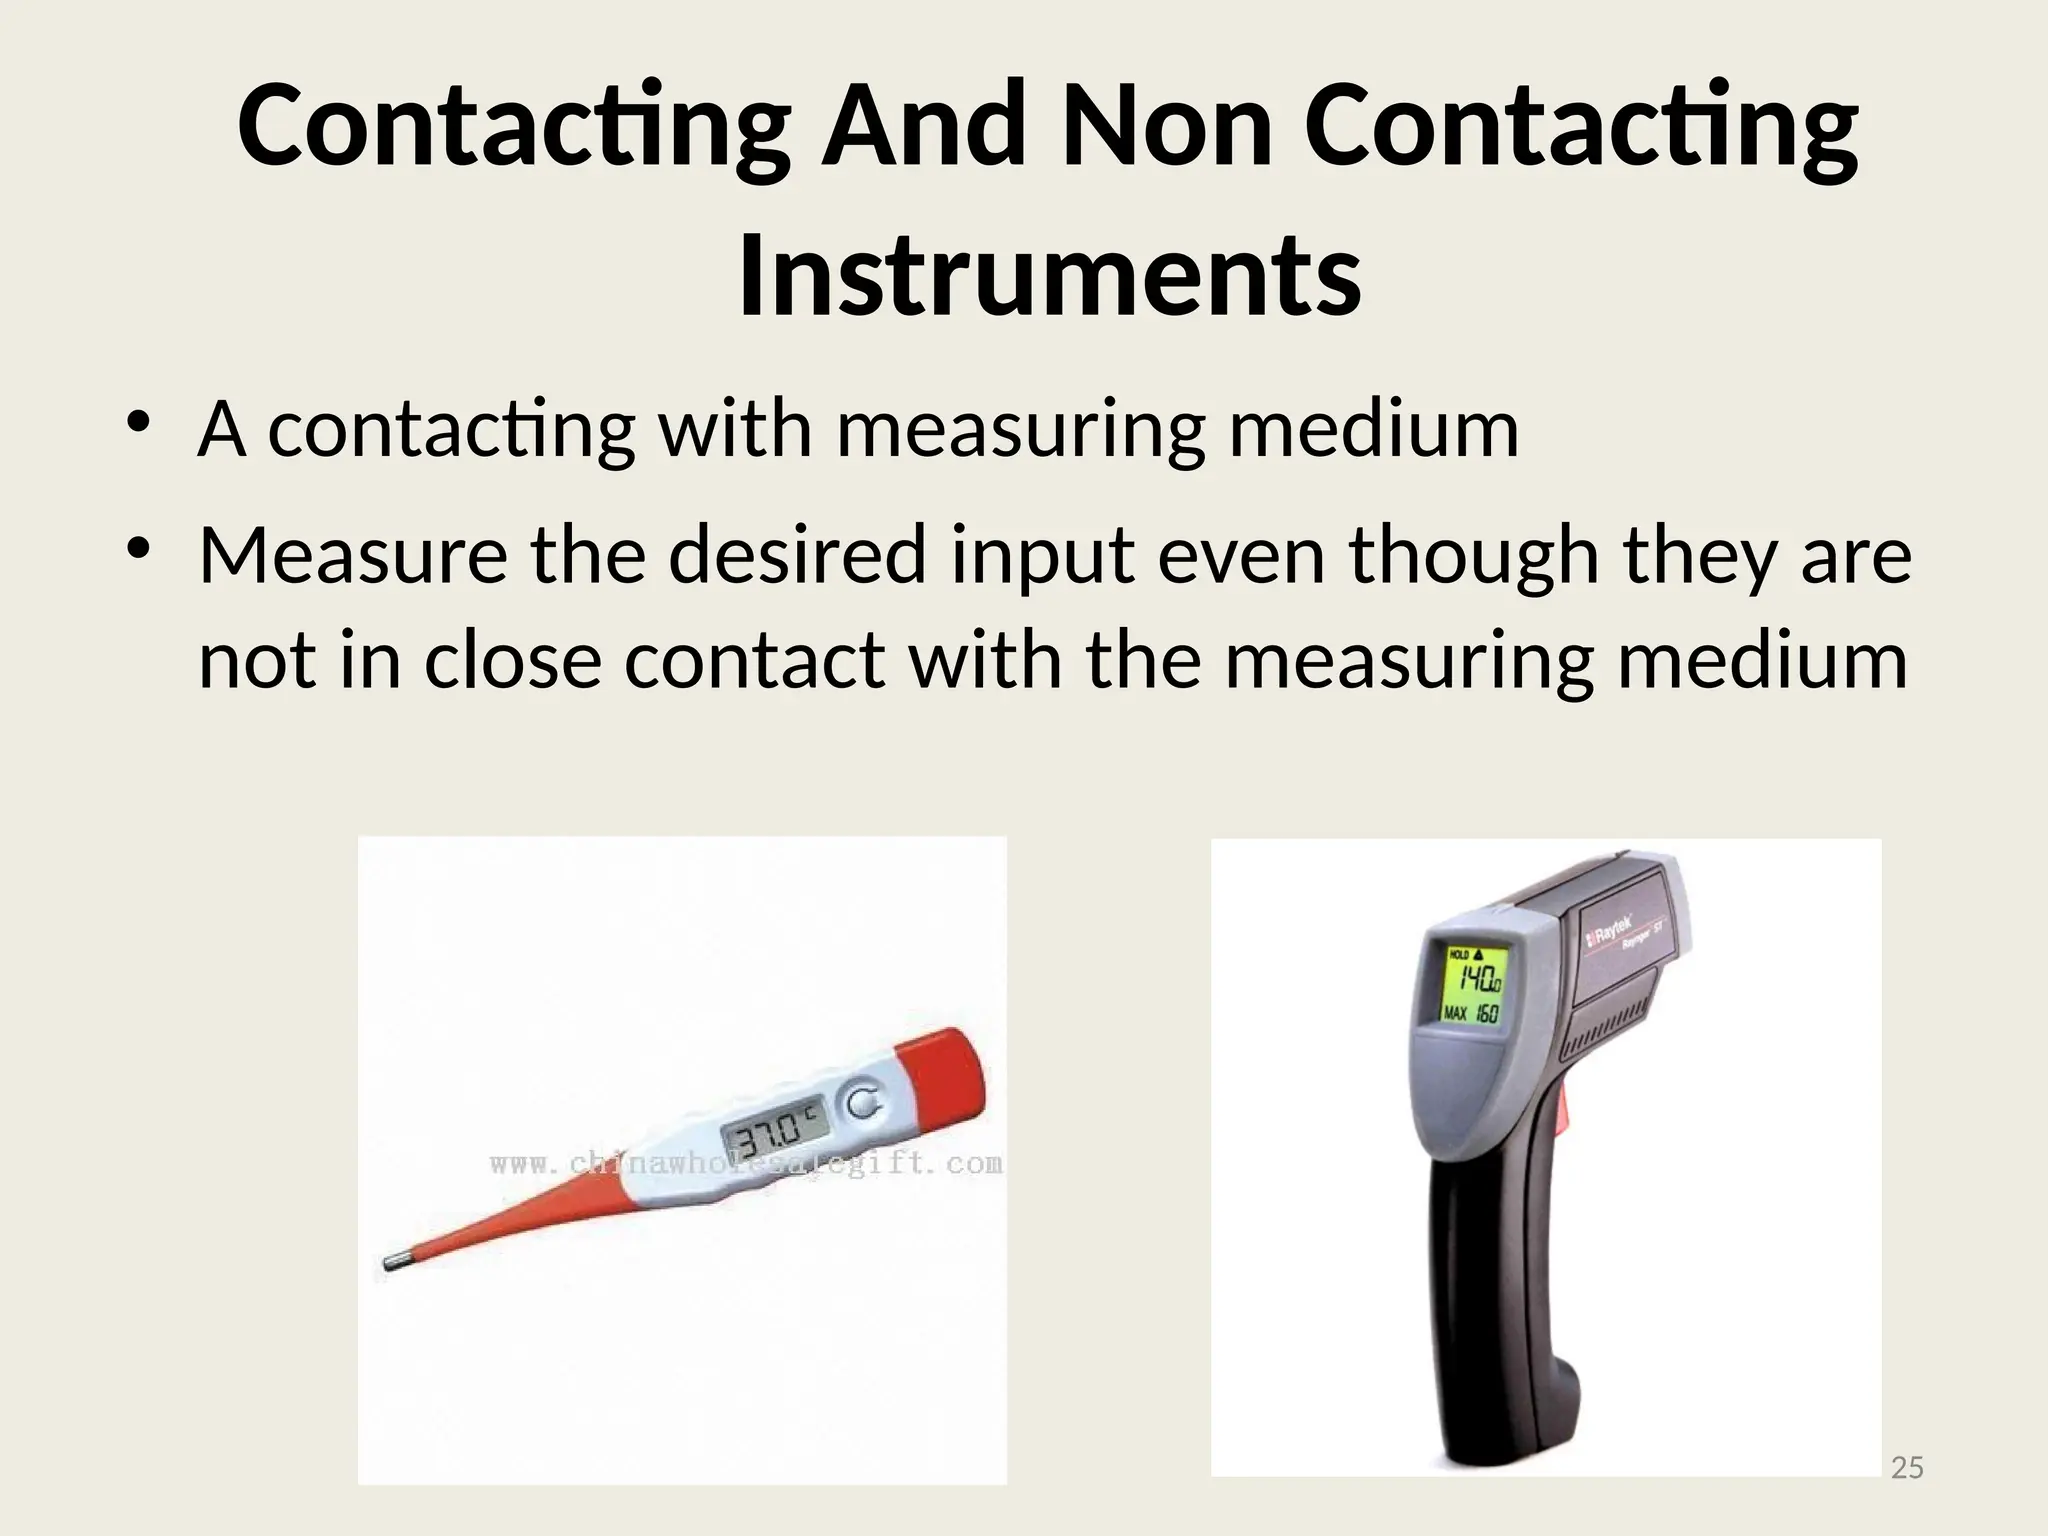
Contacting And NonContacting
Instruments
• A contacting with measuring medium
• Measure the desired input even though they are
not in close contact with the measuring medium
25
26.
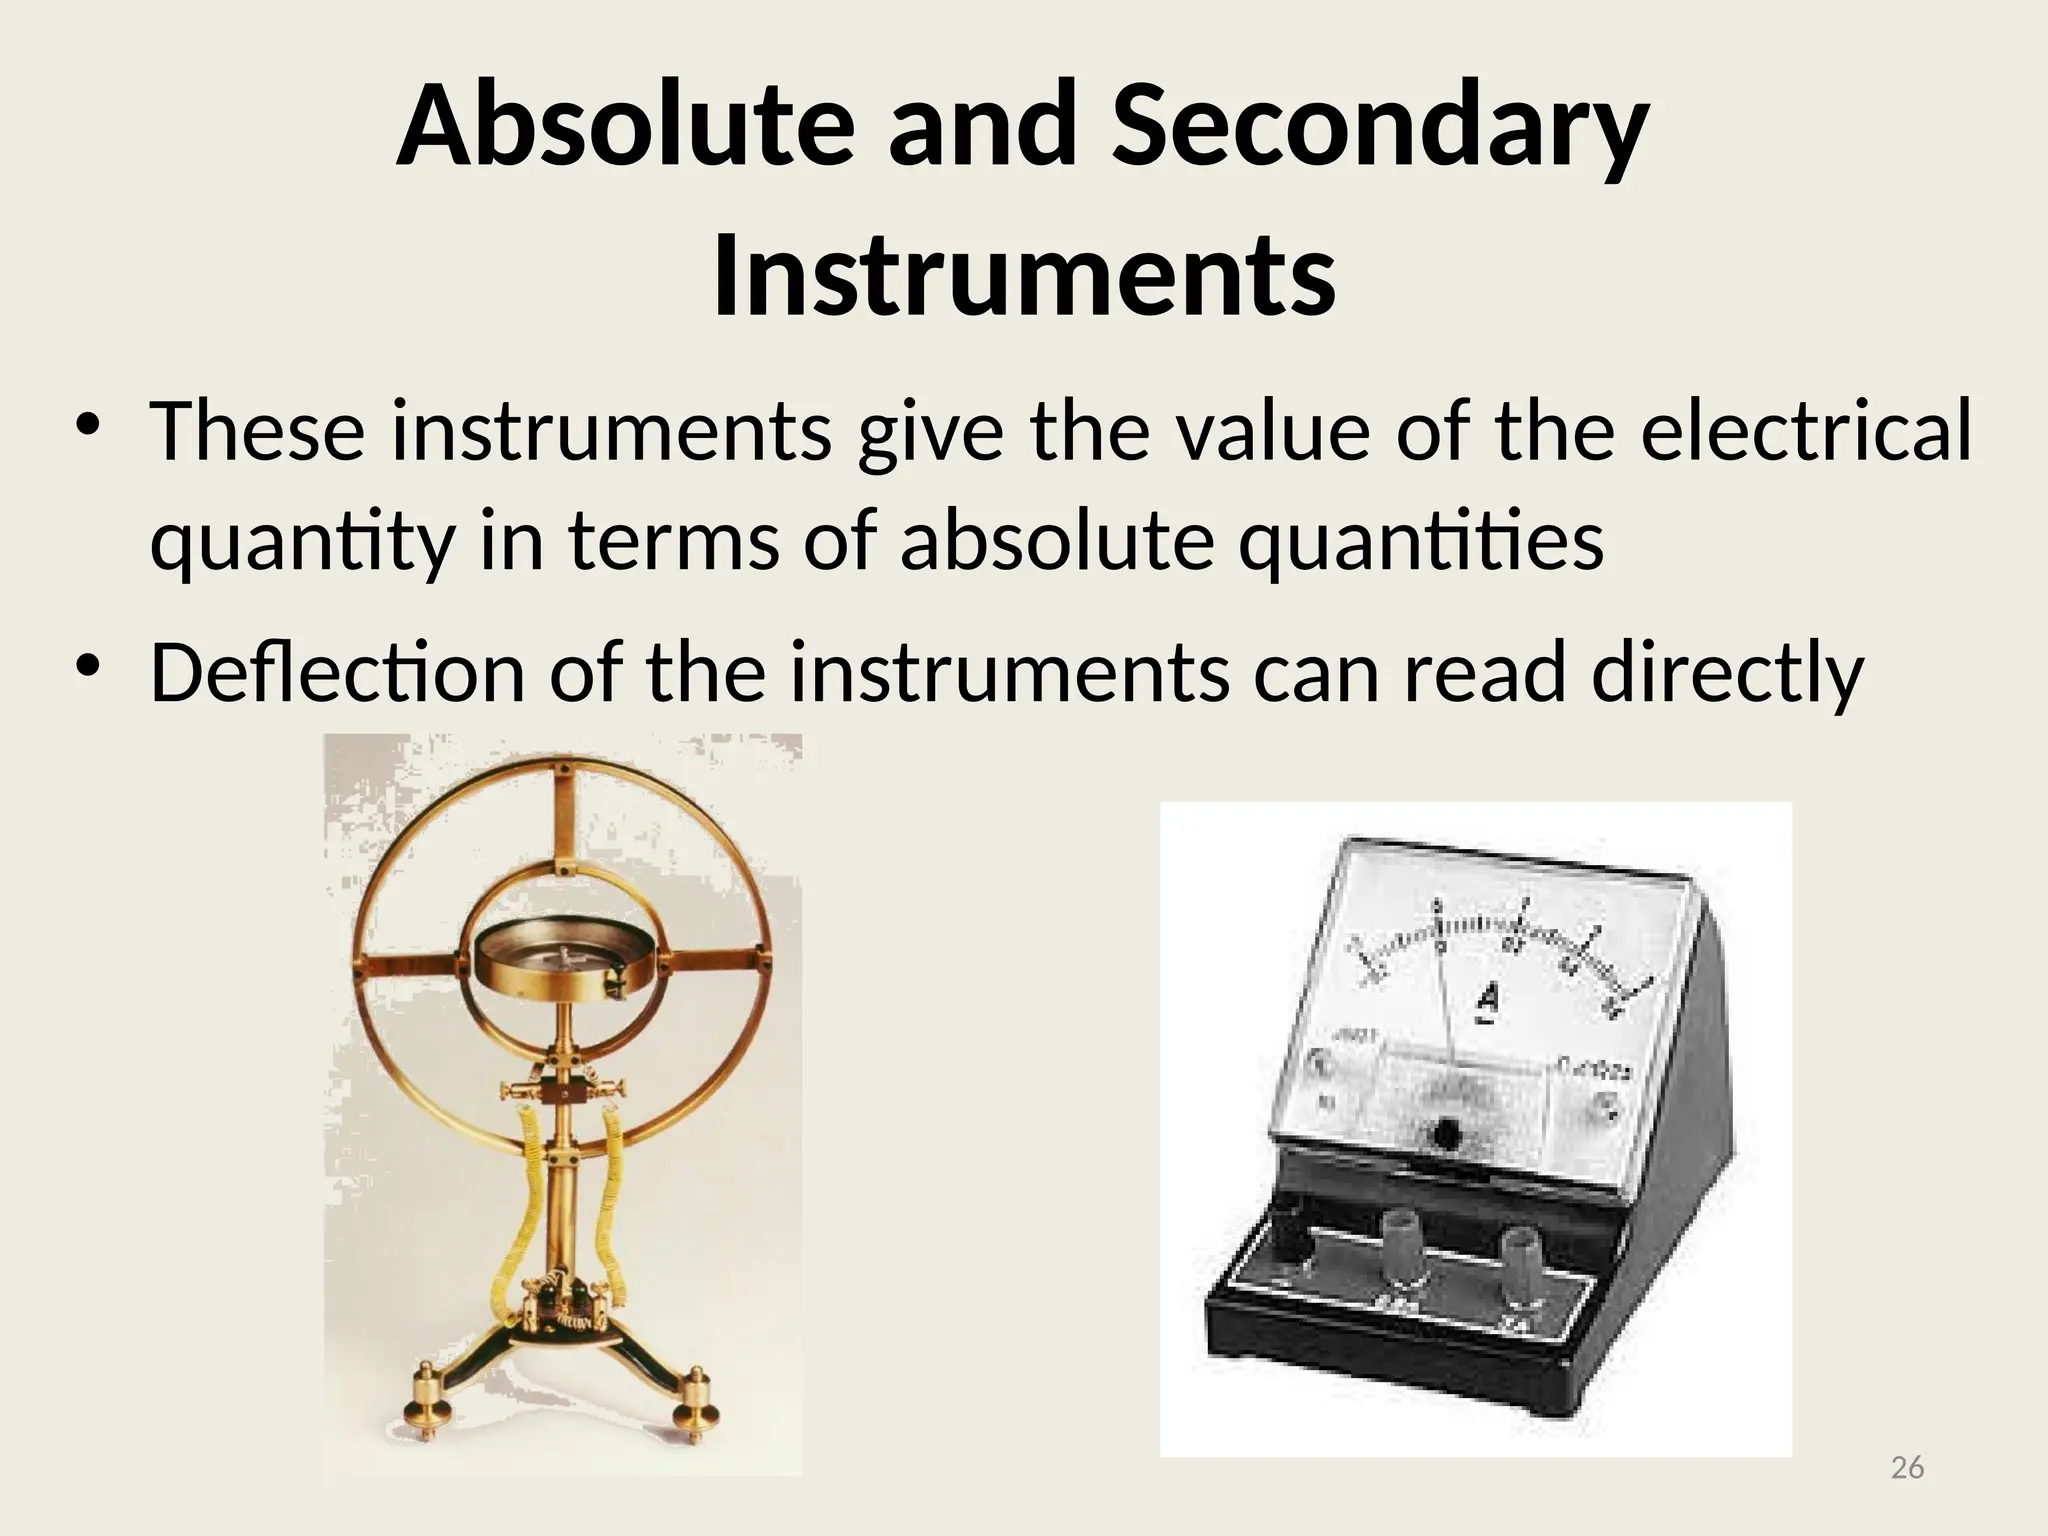
Absolute and Secondary
Instruments
•These instruments give the value of the electrical
quantity in terms of absolute quantities
• Deflection of the instruments can read directly
26
Characteristics – Definition
•Sensitivity- Sensitivity is defined as the ratio of the
magnitude of response (output signal) to the
magnitude of the quantity being measured (input
signal)
• Readability- Readability is defined as the closeness with
which the scale of the analog instrument can be read
29
30.
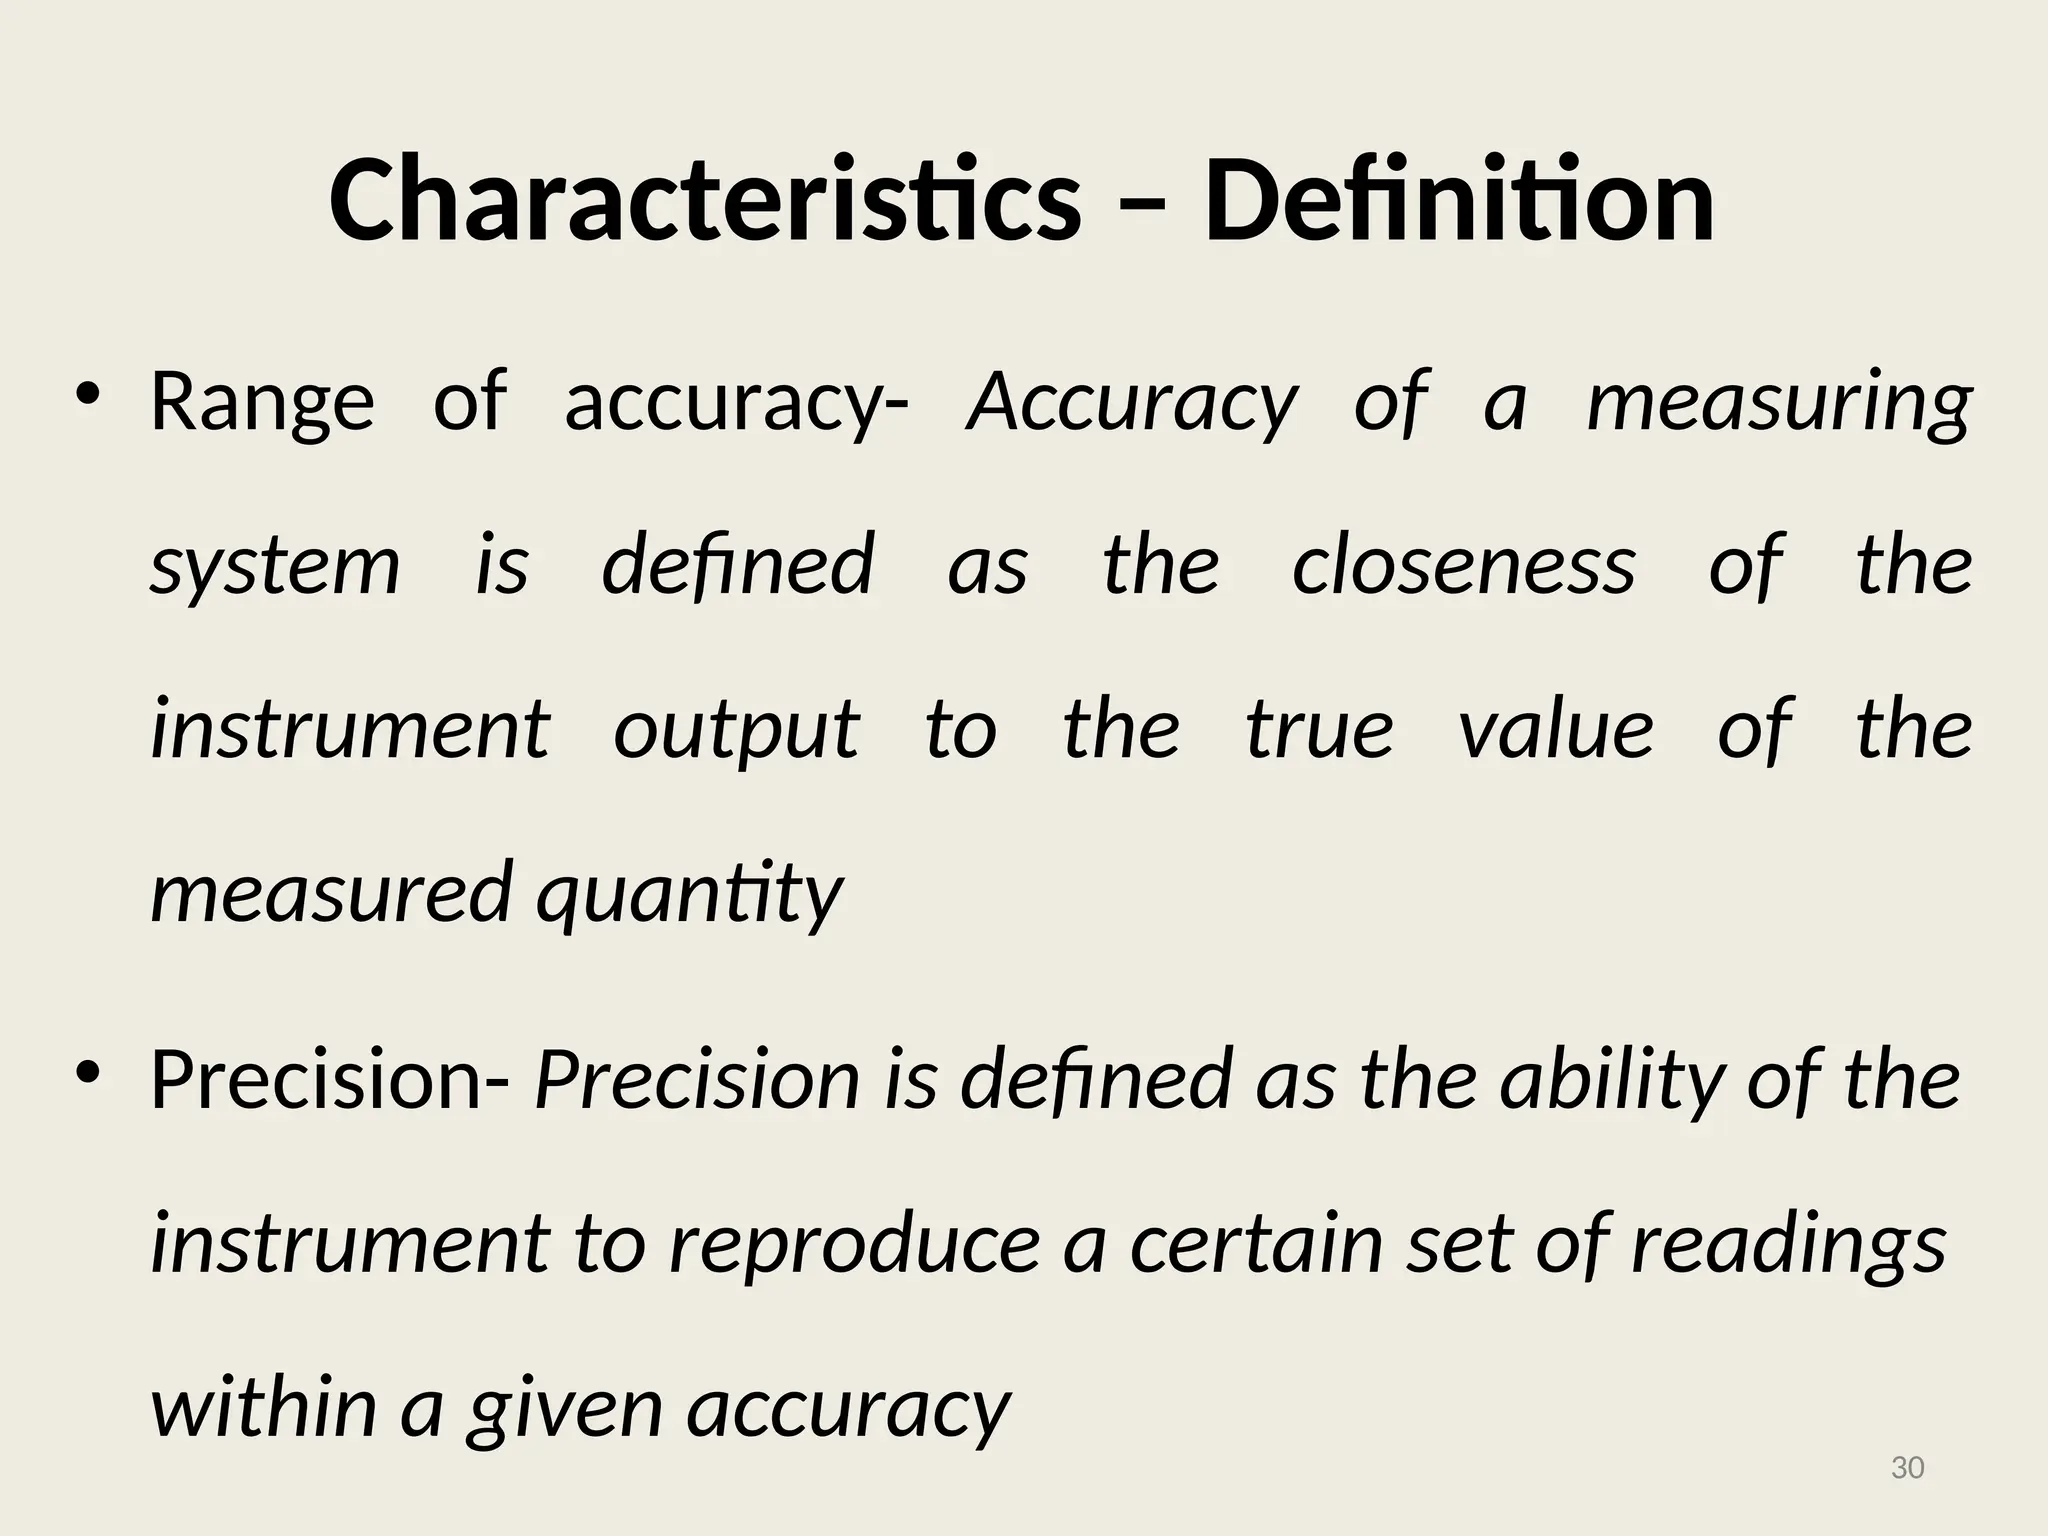
Characteristics – Definition
•Range of accuracy- Accuracy of a measuring
system is defined as the closeness of the
instrument output to the true value of the
measured quantity
• Precision- Precision is defined as the ability of the
instrument to reproduce a certain set of readings
within a given accuracy 30
31.
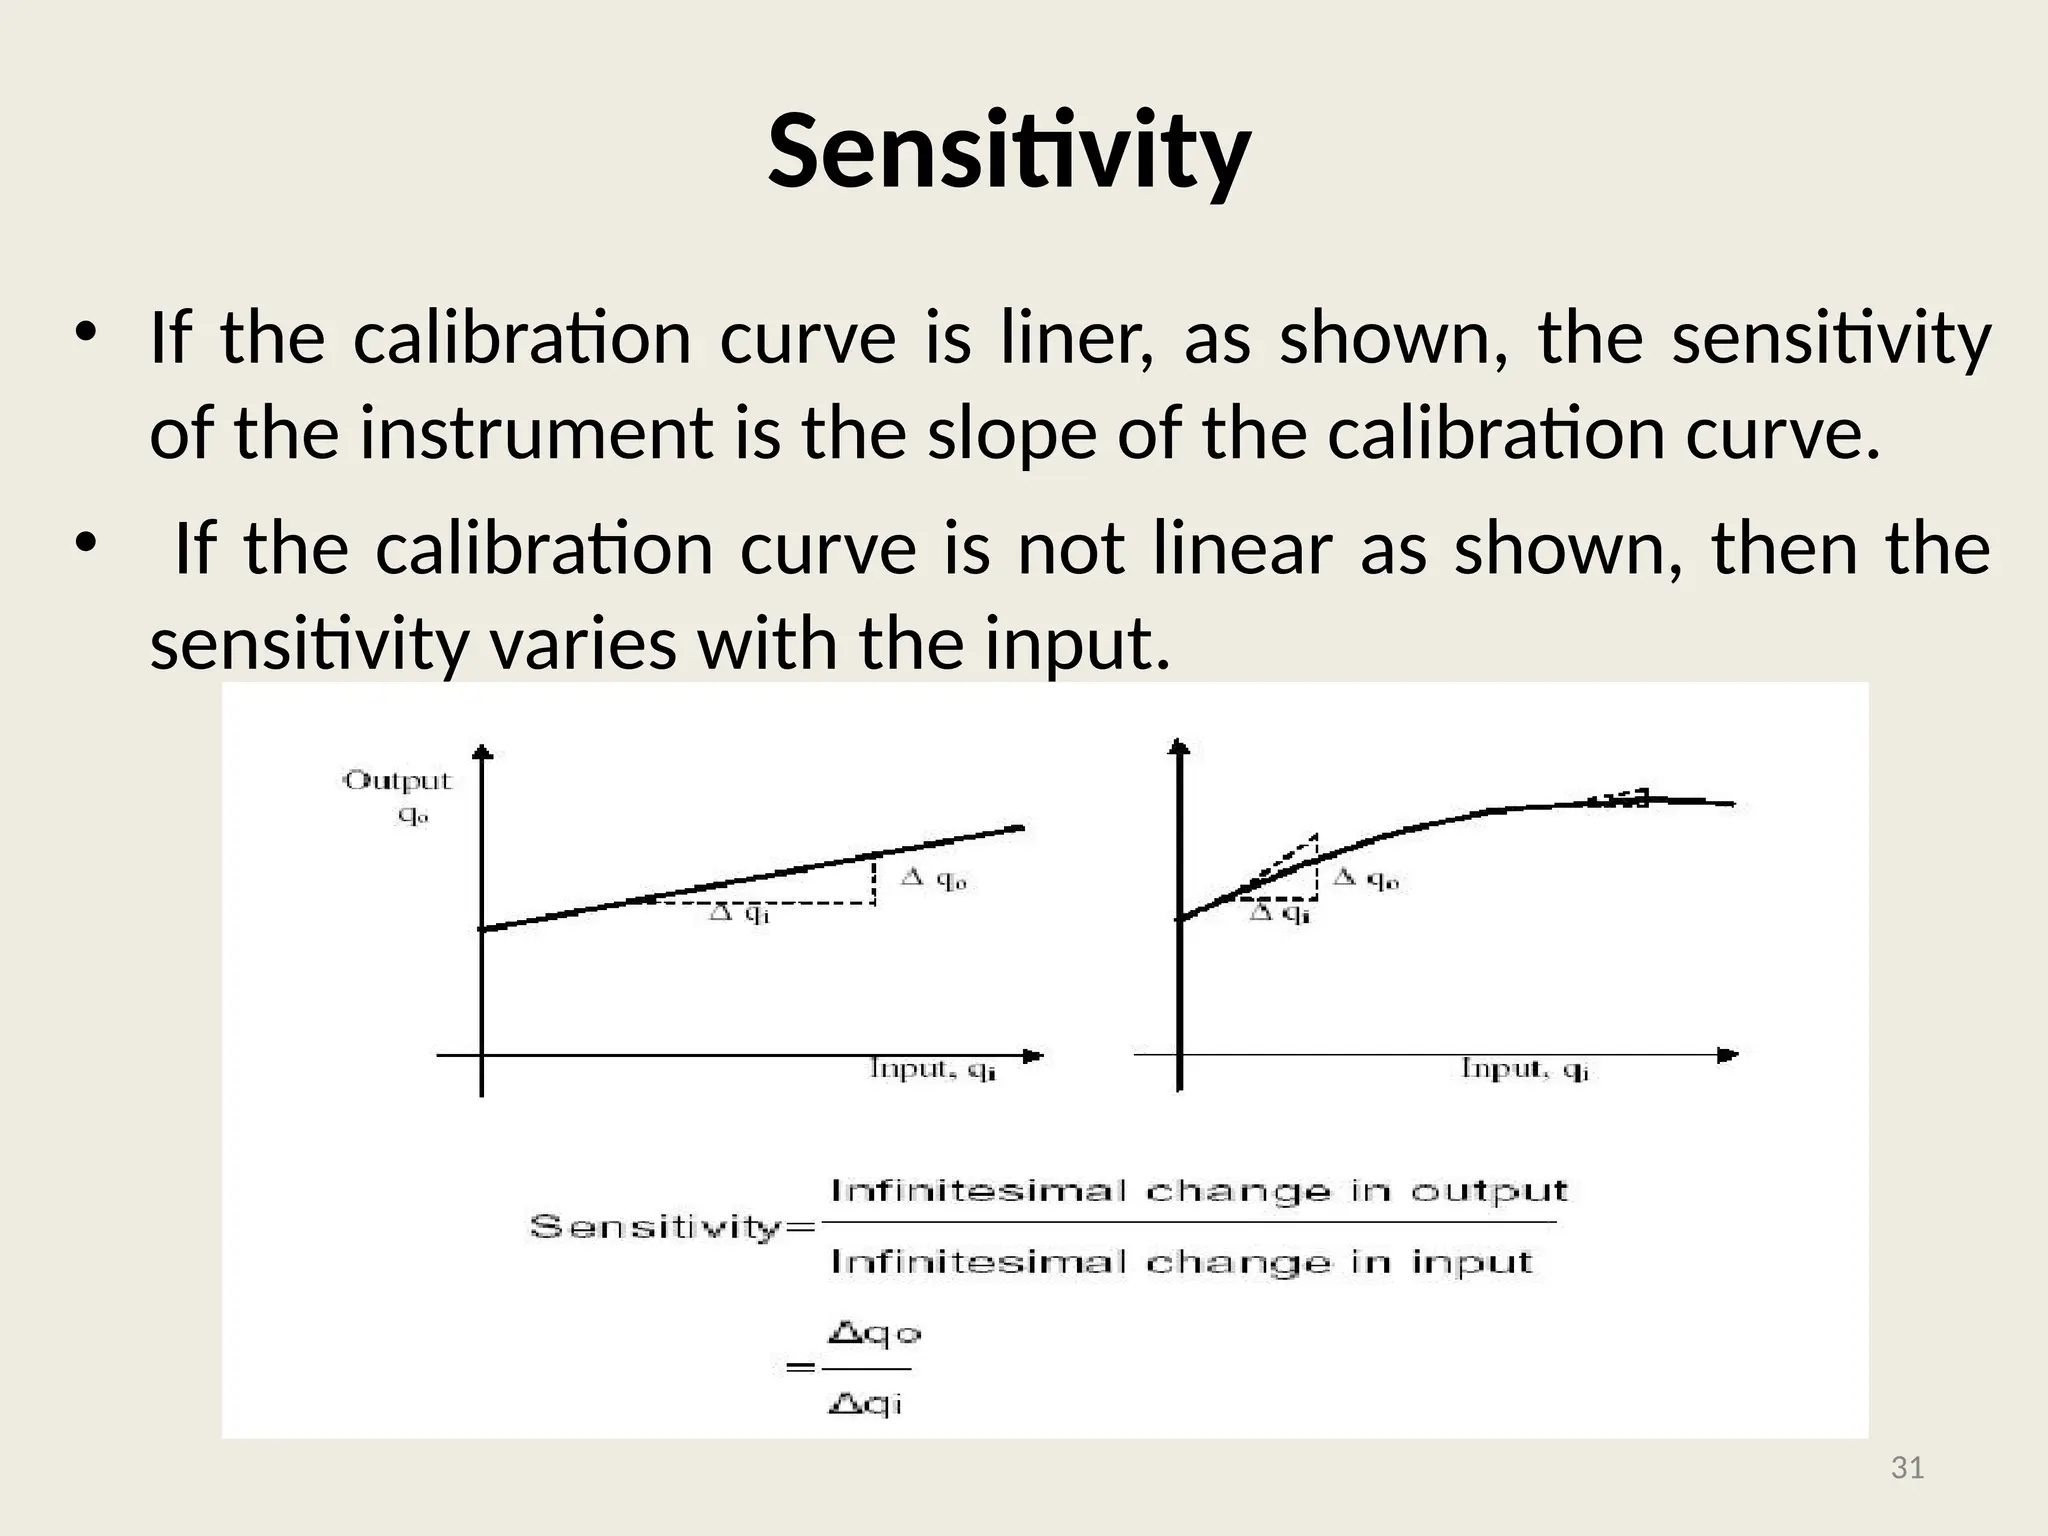
Sensitivity
• If thecalibration curve is liner, as shown, the sensitivity
of the instrument is the slope of the calibration curve.
• If the calibration curve is not linear as shown, then the
sensitivity varies with the input.
31
32.
Sensitivity
This is therelationship between a change in the
output reading for a given change of the input.
(This relationship may be linear or non-linear.)
Sensitivity is often known as scale factor or
instrument magnification and an instrument with a
large sensitivity (scale factor) will indicate a large
movement of the indicator for a small input
change.
32
33.
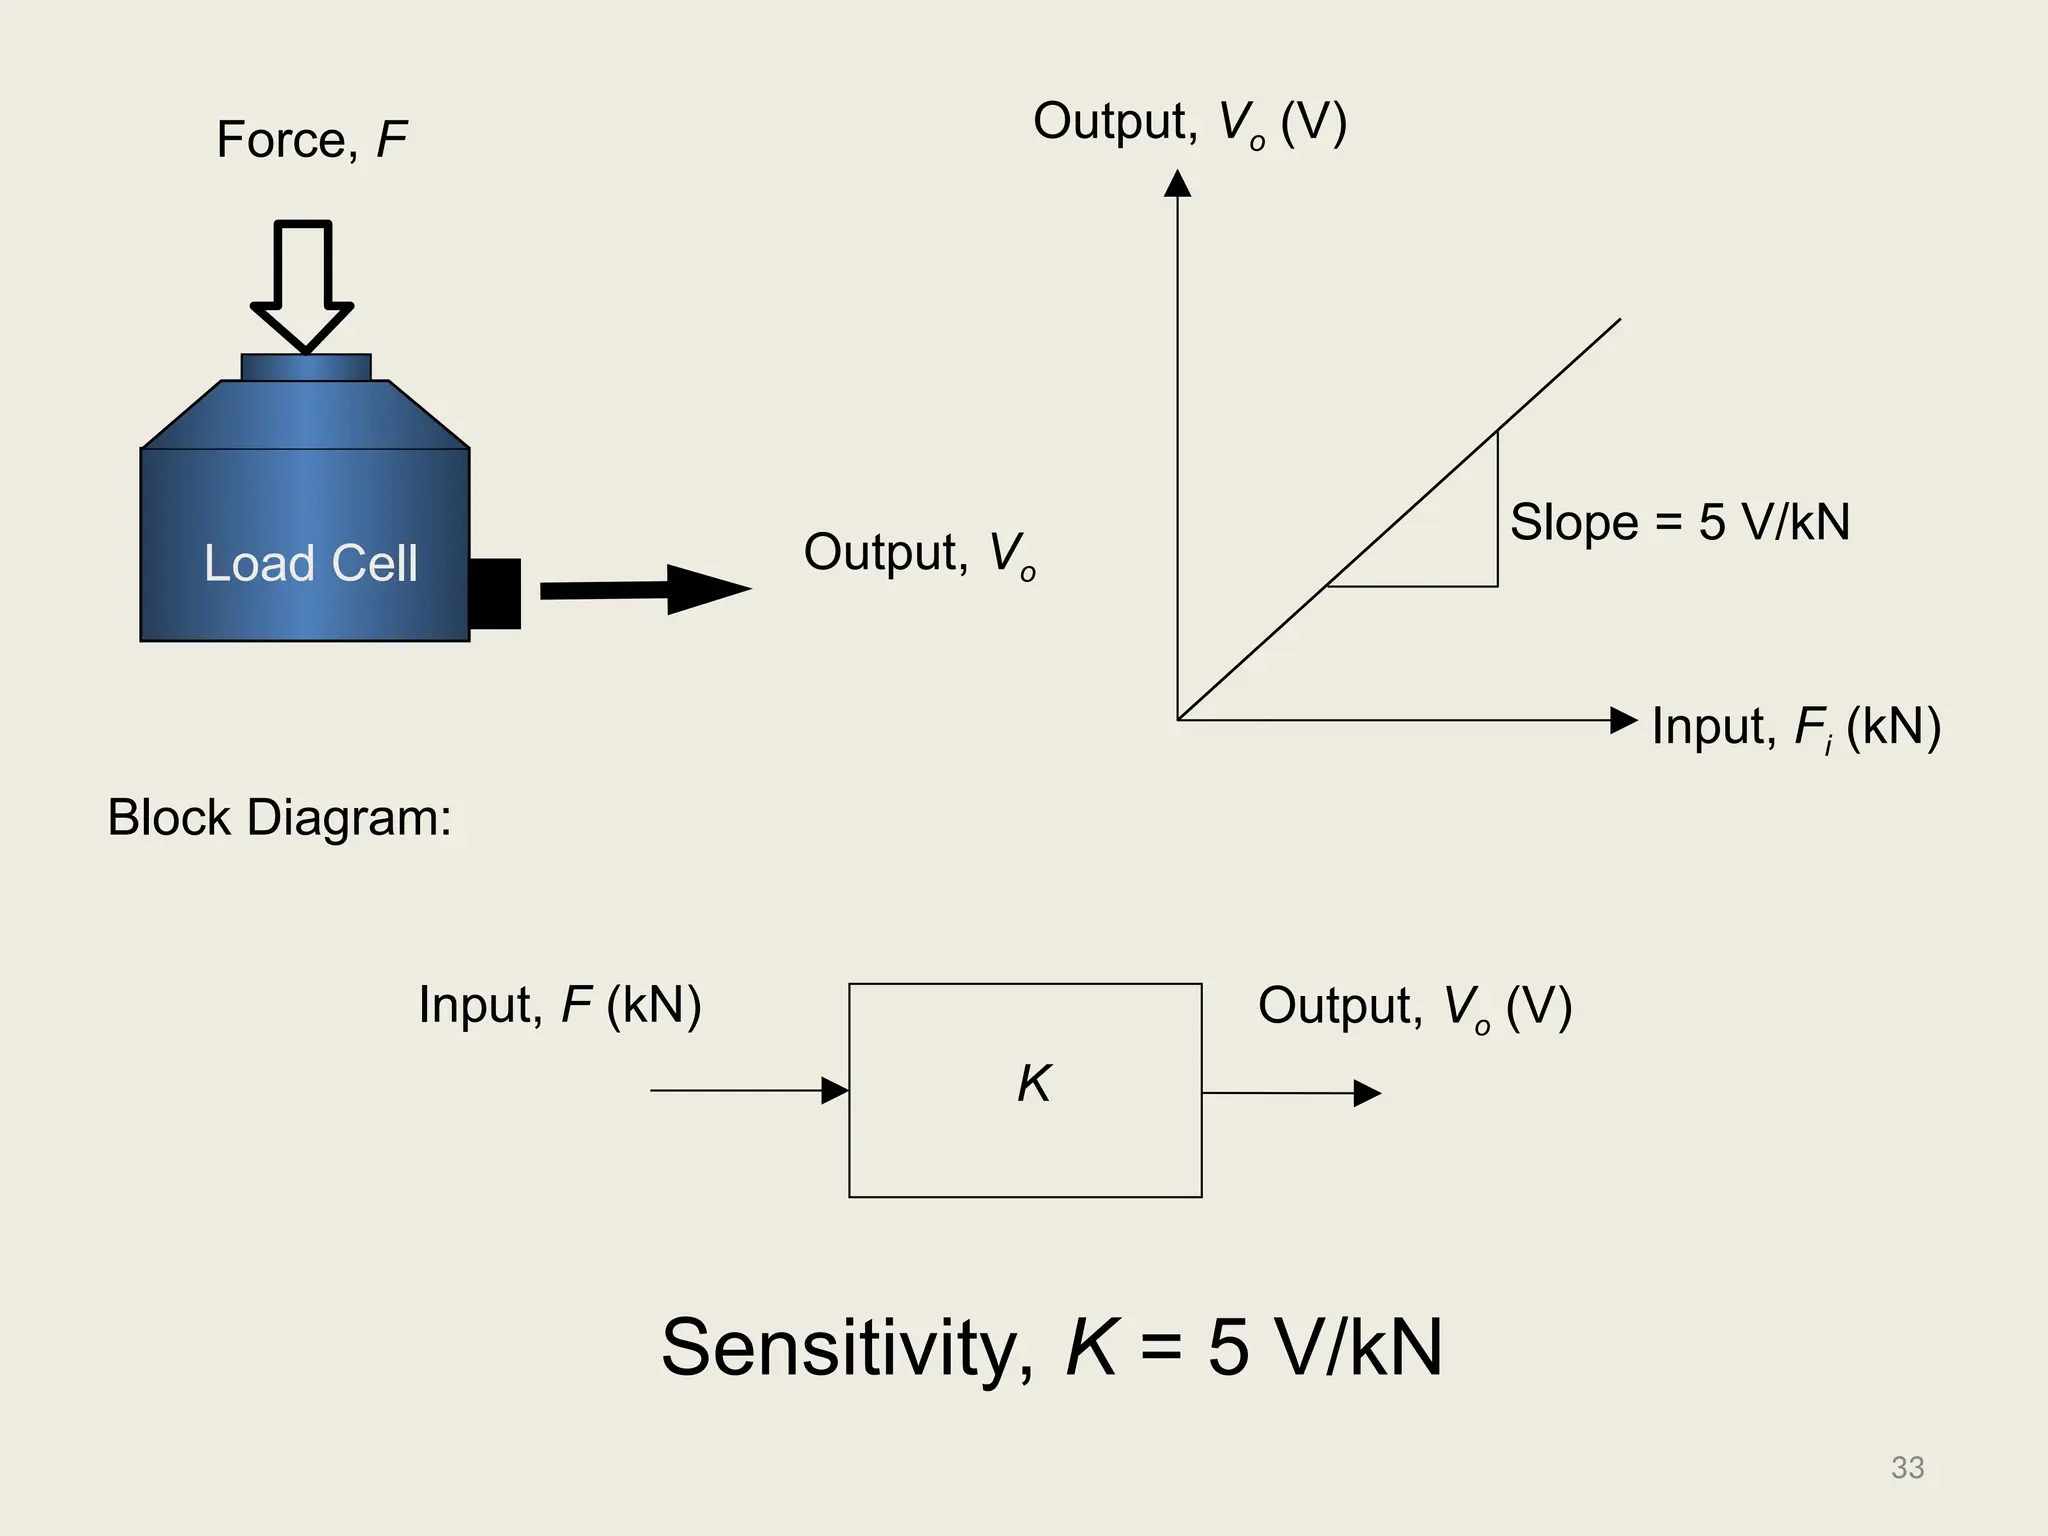
Load Cell
Force, F
Output,Vo
Output, Vo (V)
Input, Fi (kN)
Slope = 5 V/kN
K
Input, F (kN) Output, Vo (V)
Sensitivity, K = 5 V/kN
Block Diagram:
33
34.
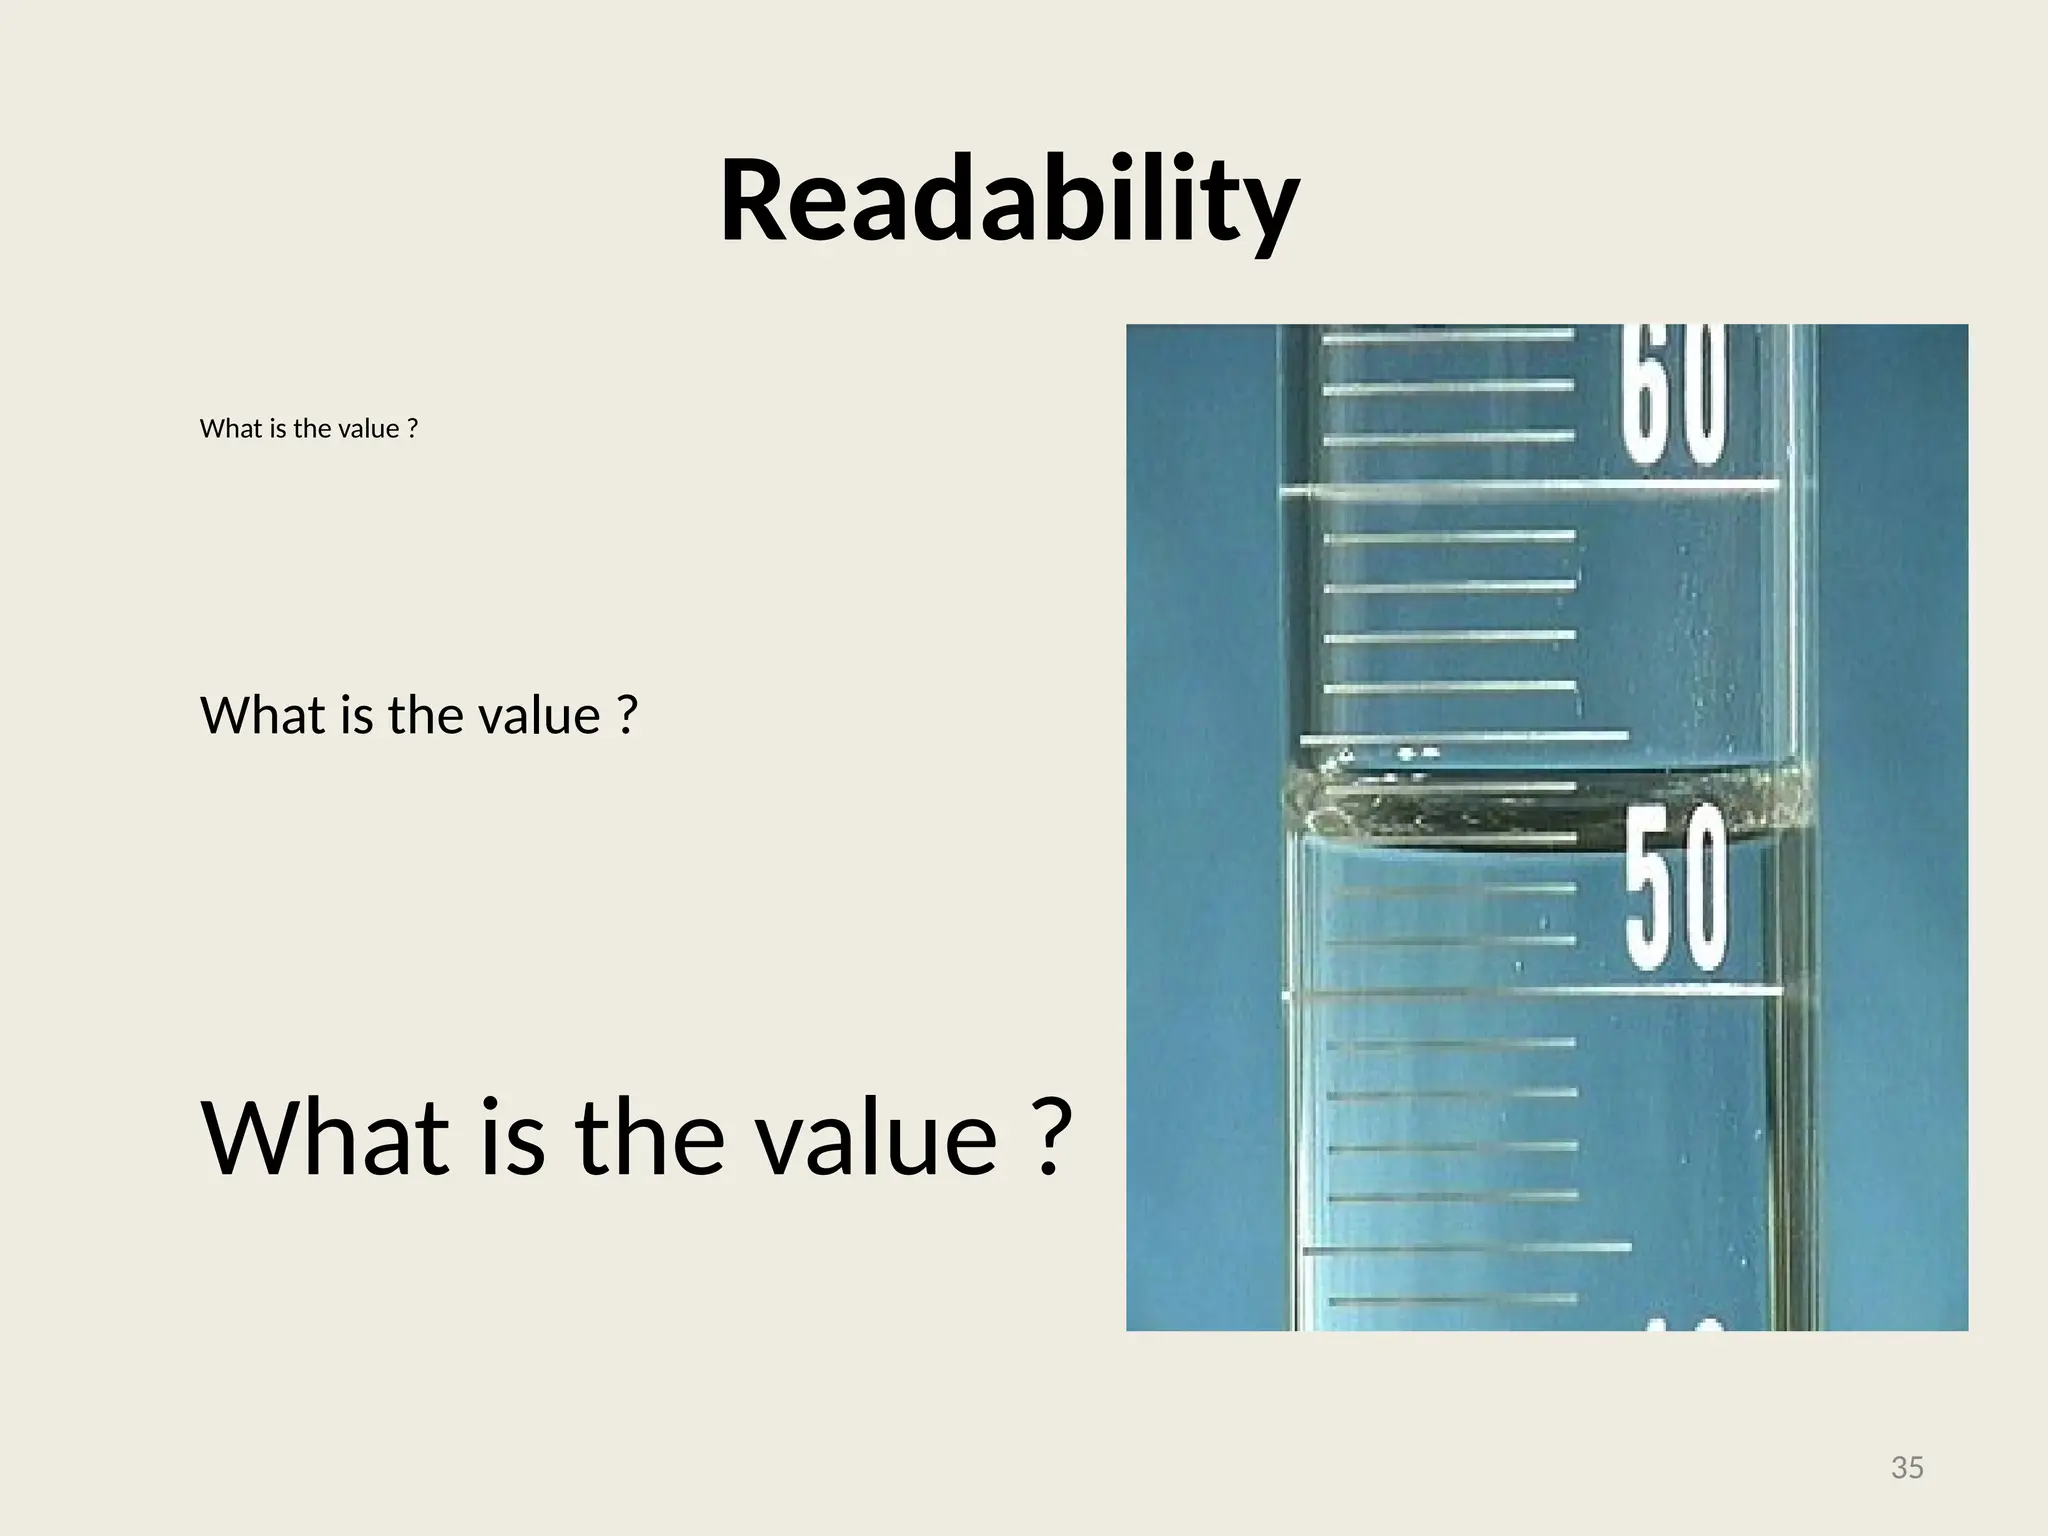
Readability
• Readability isdefined as the ease with which
readings may be taken with an instrument.
• Readability difficulties may often occur due to
parallax errors when an observer is noting the
position of a pointer on a calibrated scale
34
Accuracy
• Accuracy the extent to which a measured
value agrees with a true value
• The difference between the measured value &
the true value is known as ‘Error of
measurement’
• Accuracy is the quality of conformity
• Accuracy is Zero in absolute cases
36
37.
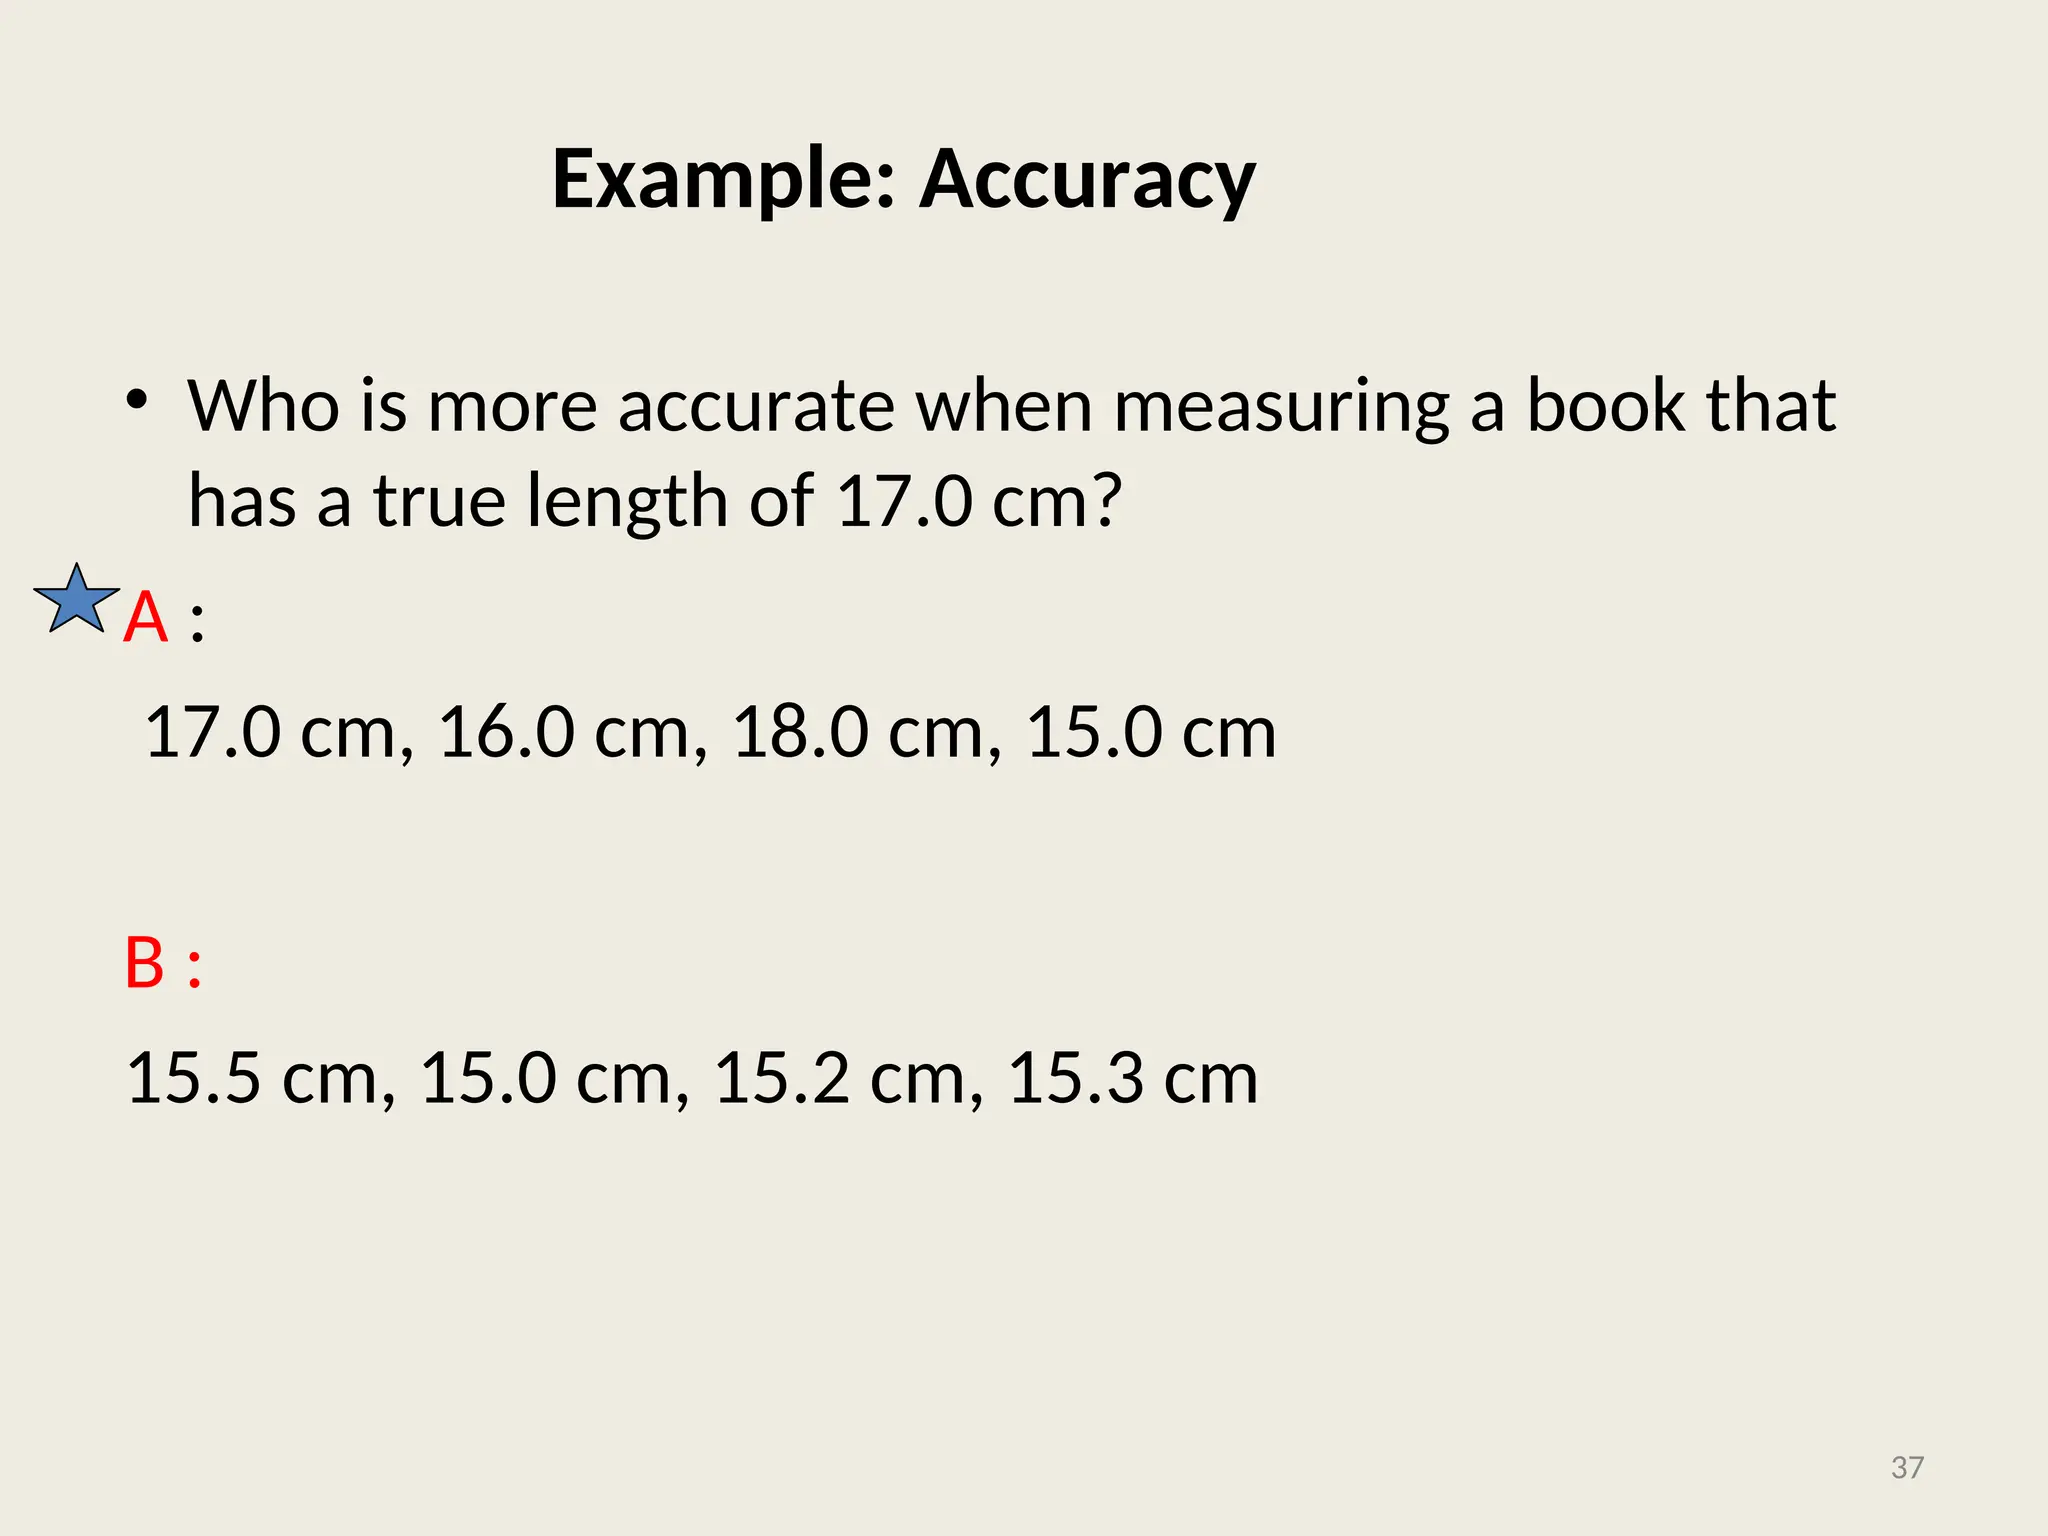
Example: Accuracy
• Whois more accurate when measuring a book that
has a true length of 17.0 cm?
A :
17.0 cm, 16.0 cm, 18.0 cm, 15.0 cm
B ::
15.5 cm, 15.0 cm, 15.2 cm, 15.3 cm
37
38.
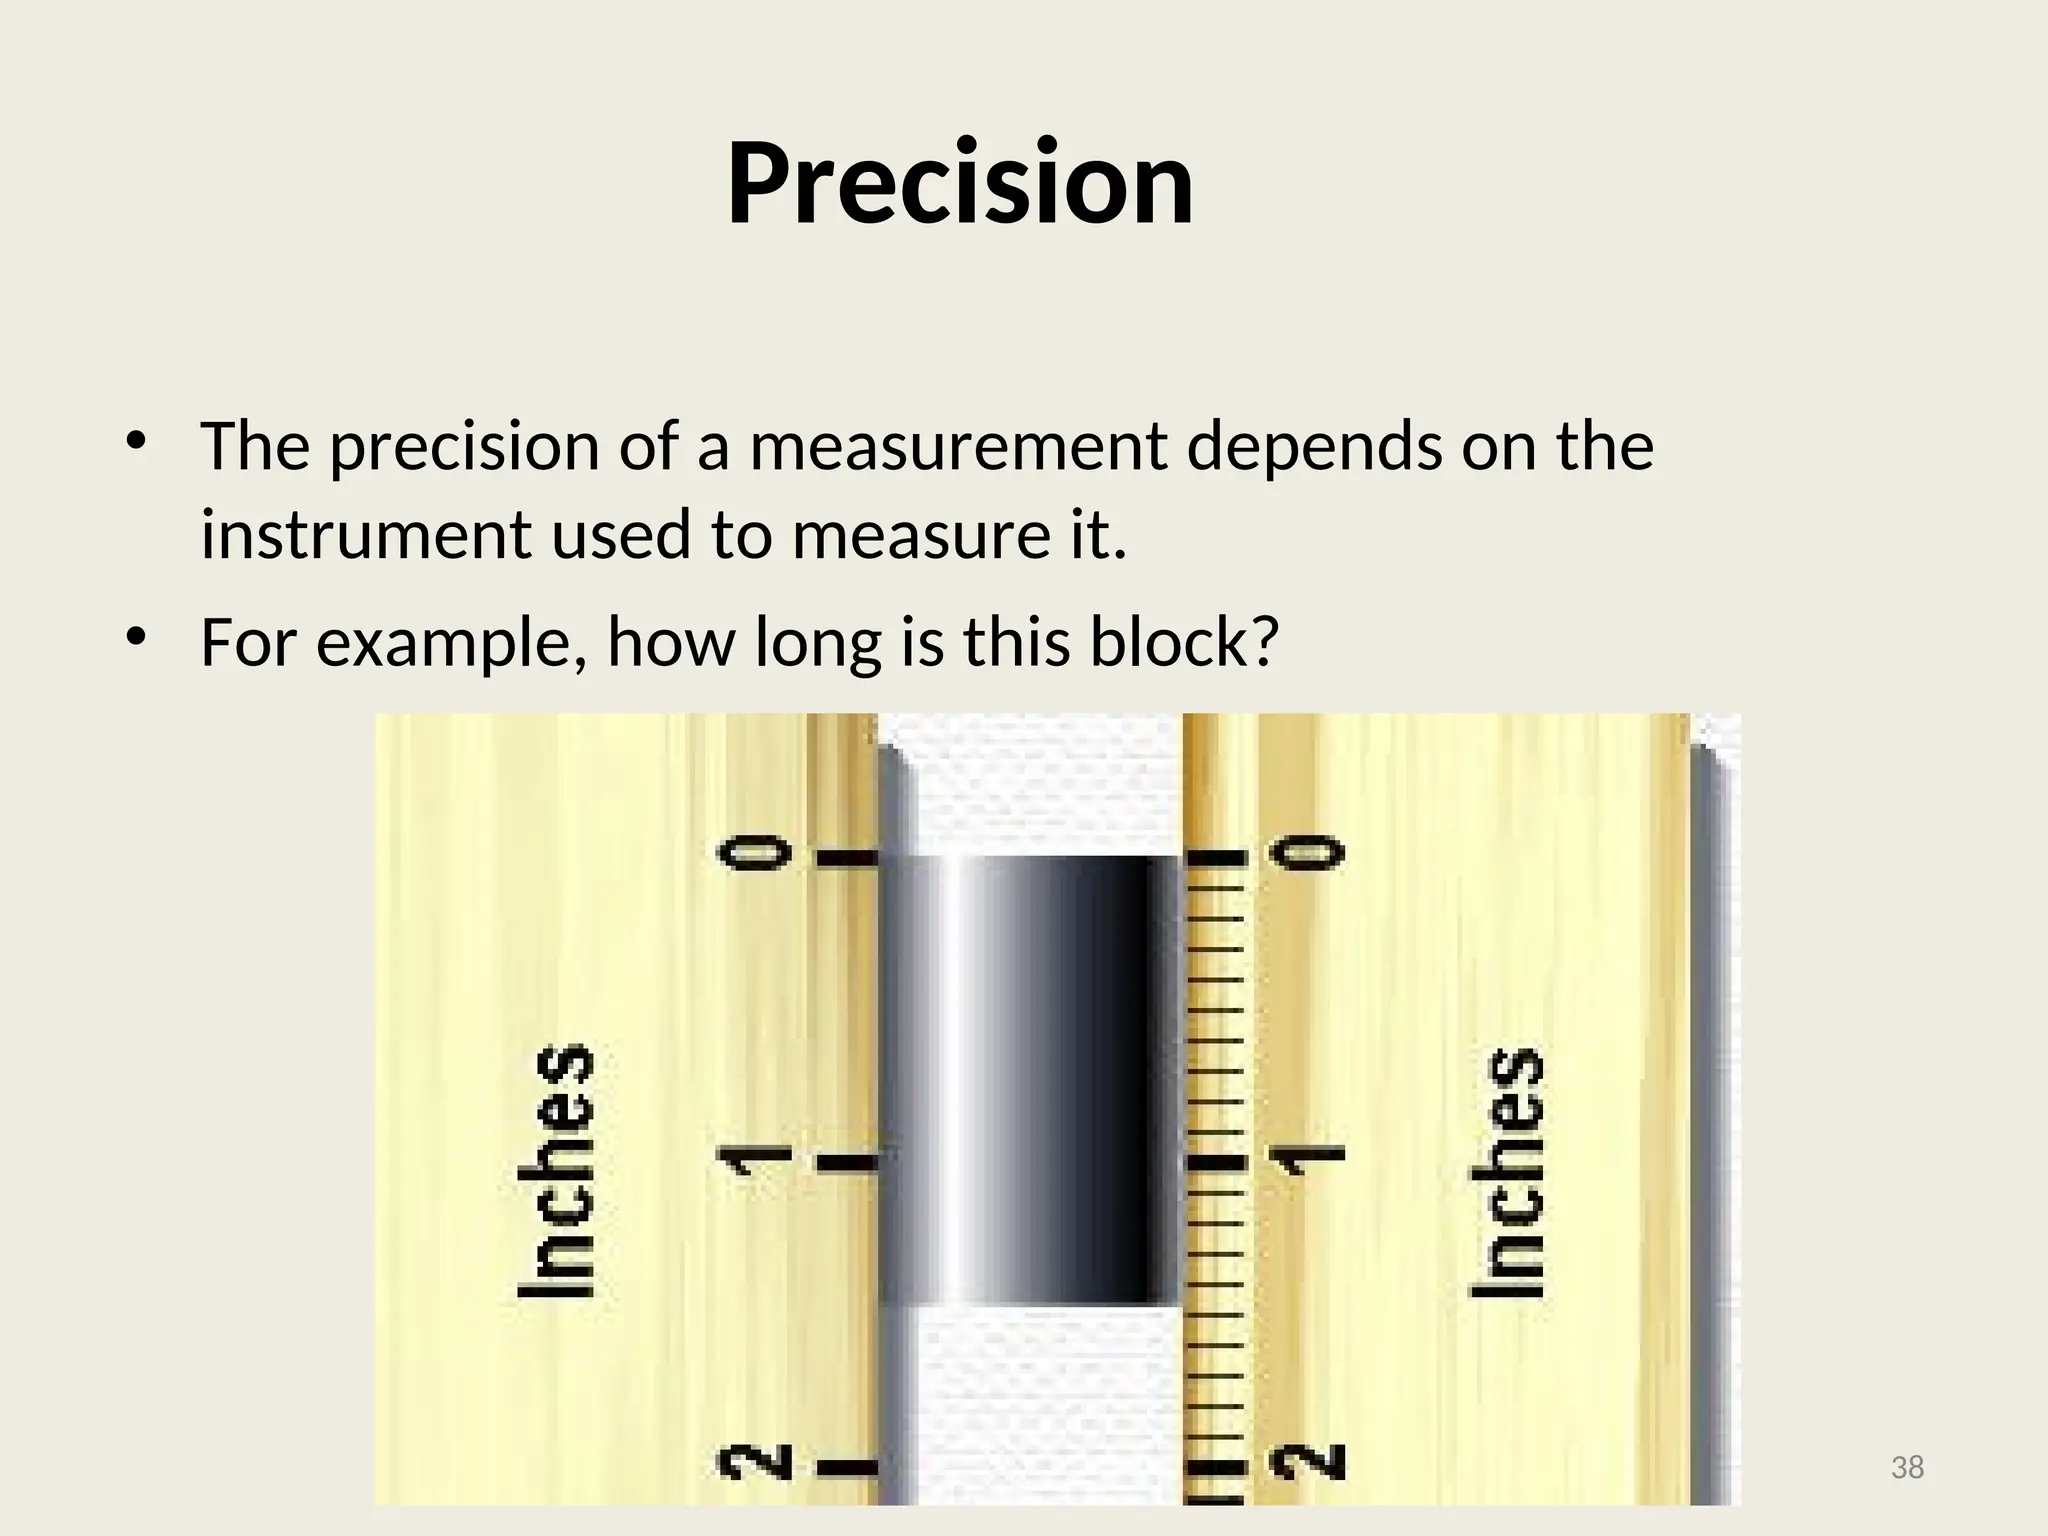
Precision
• The precisionof a measurement depends on the
instrument used to measure it.
• For example, how long is this block?
38
39.
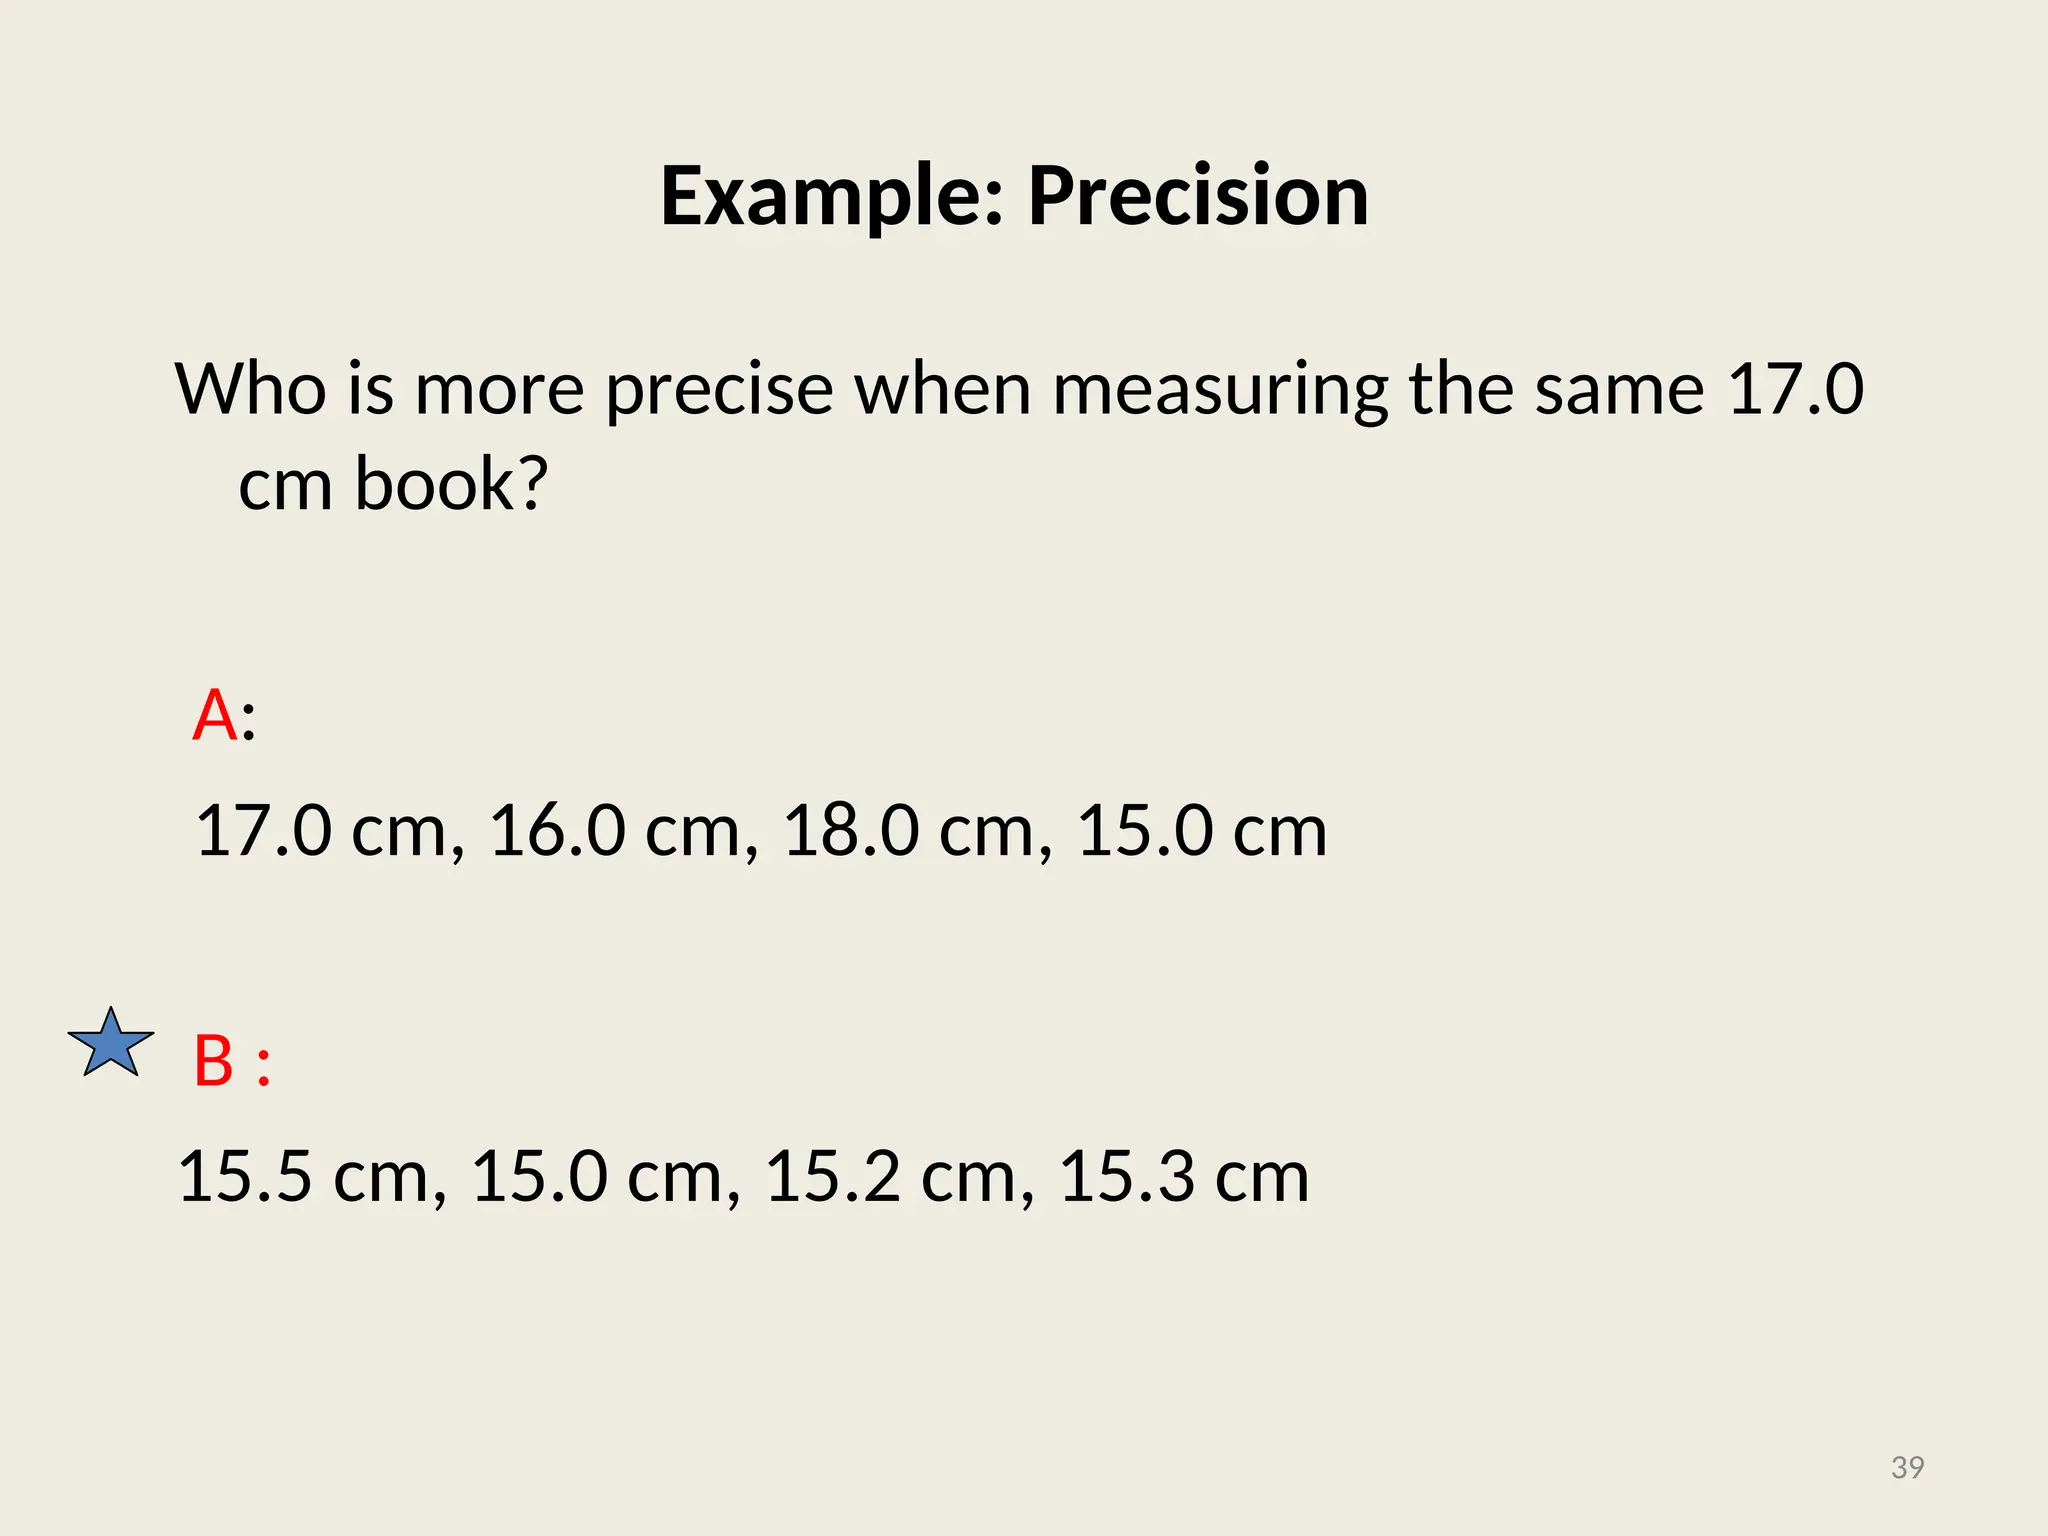
Example: Precision
Who ismore precise when measuring the same 17.0
cm book?
A:
17.0 cm, 16.0 cm, 18.0 cm, 15.0 cm
B ::
15.5 cm, 15.0 cm, 15.2 cm, 15.3 cm
39
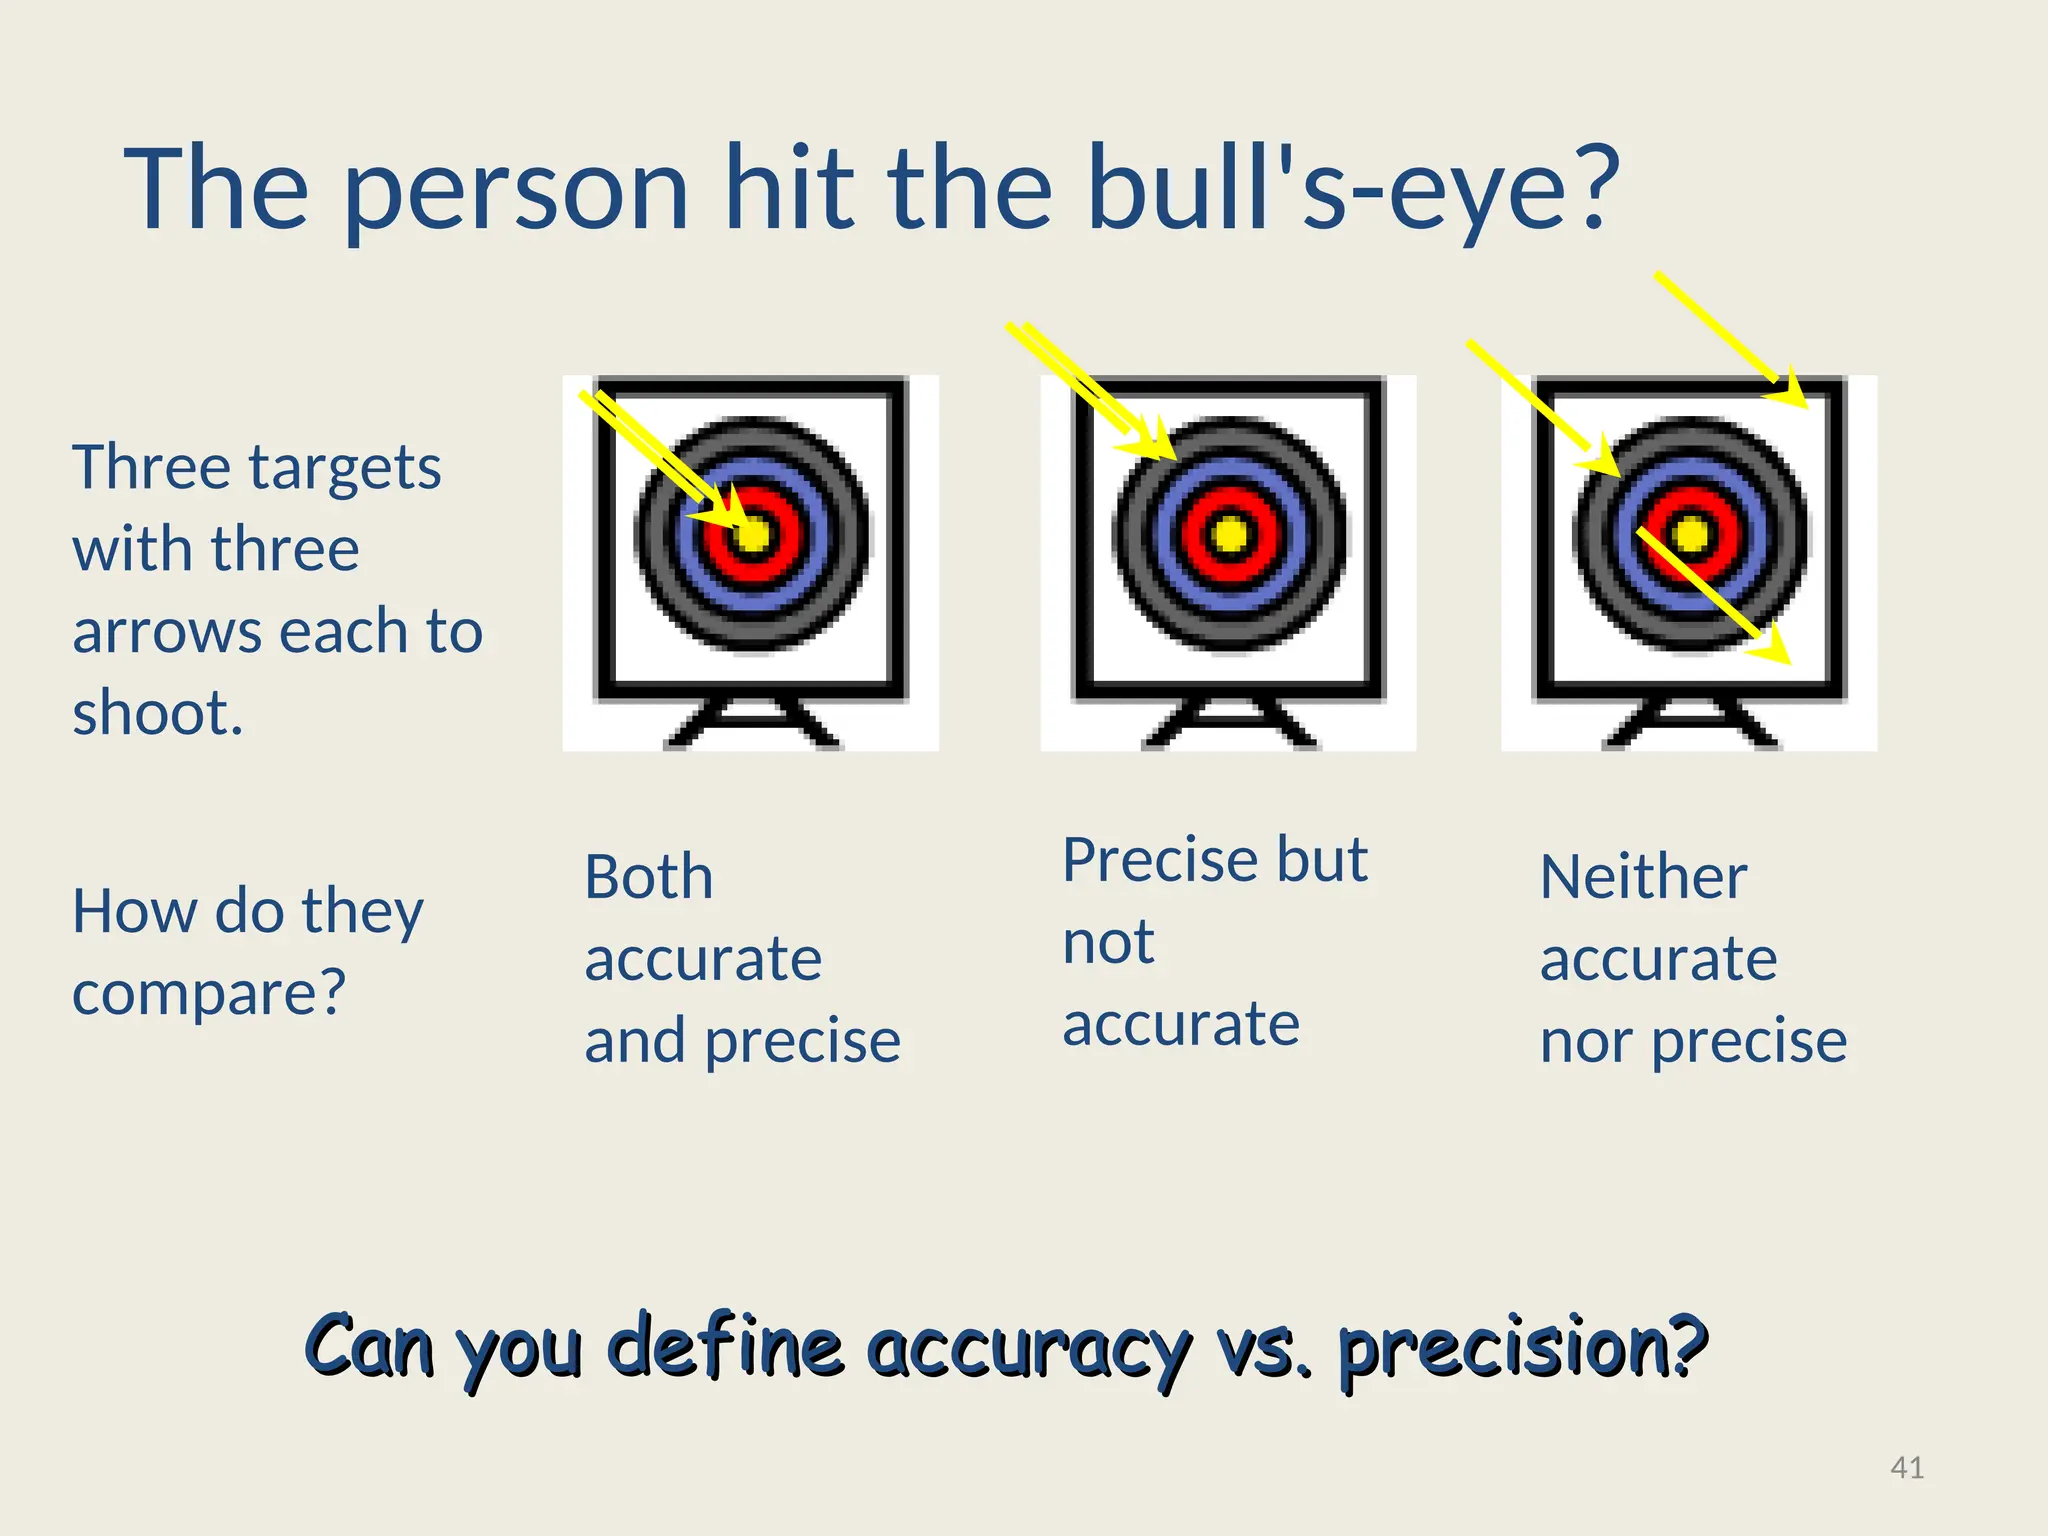
Three targets
with three
arrowseach to
shoot.
The person hit the bull's-eye?
Both
accurate
and precise
Precise but
not
accurate
Neither
accurate
nor precise
How do they
compare?
Can you define accuracy vs. precision?
Can you define accuracy vs. precision?
41
42.
Uncertainty
• The worduncertainty casts a doubt about the
exactness of the measurement results
• True value = Estimated value + Uncertainty
42
43.
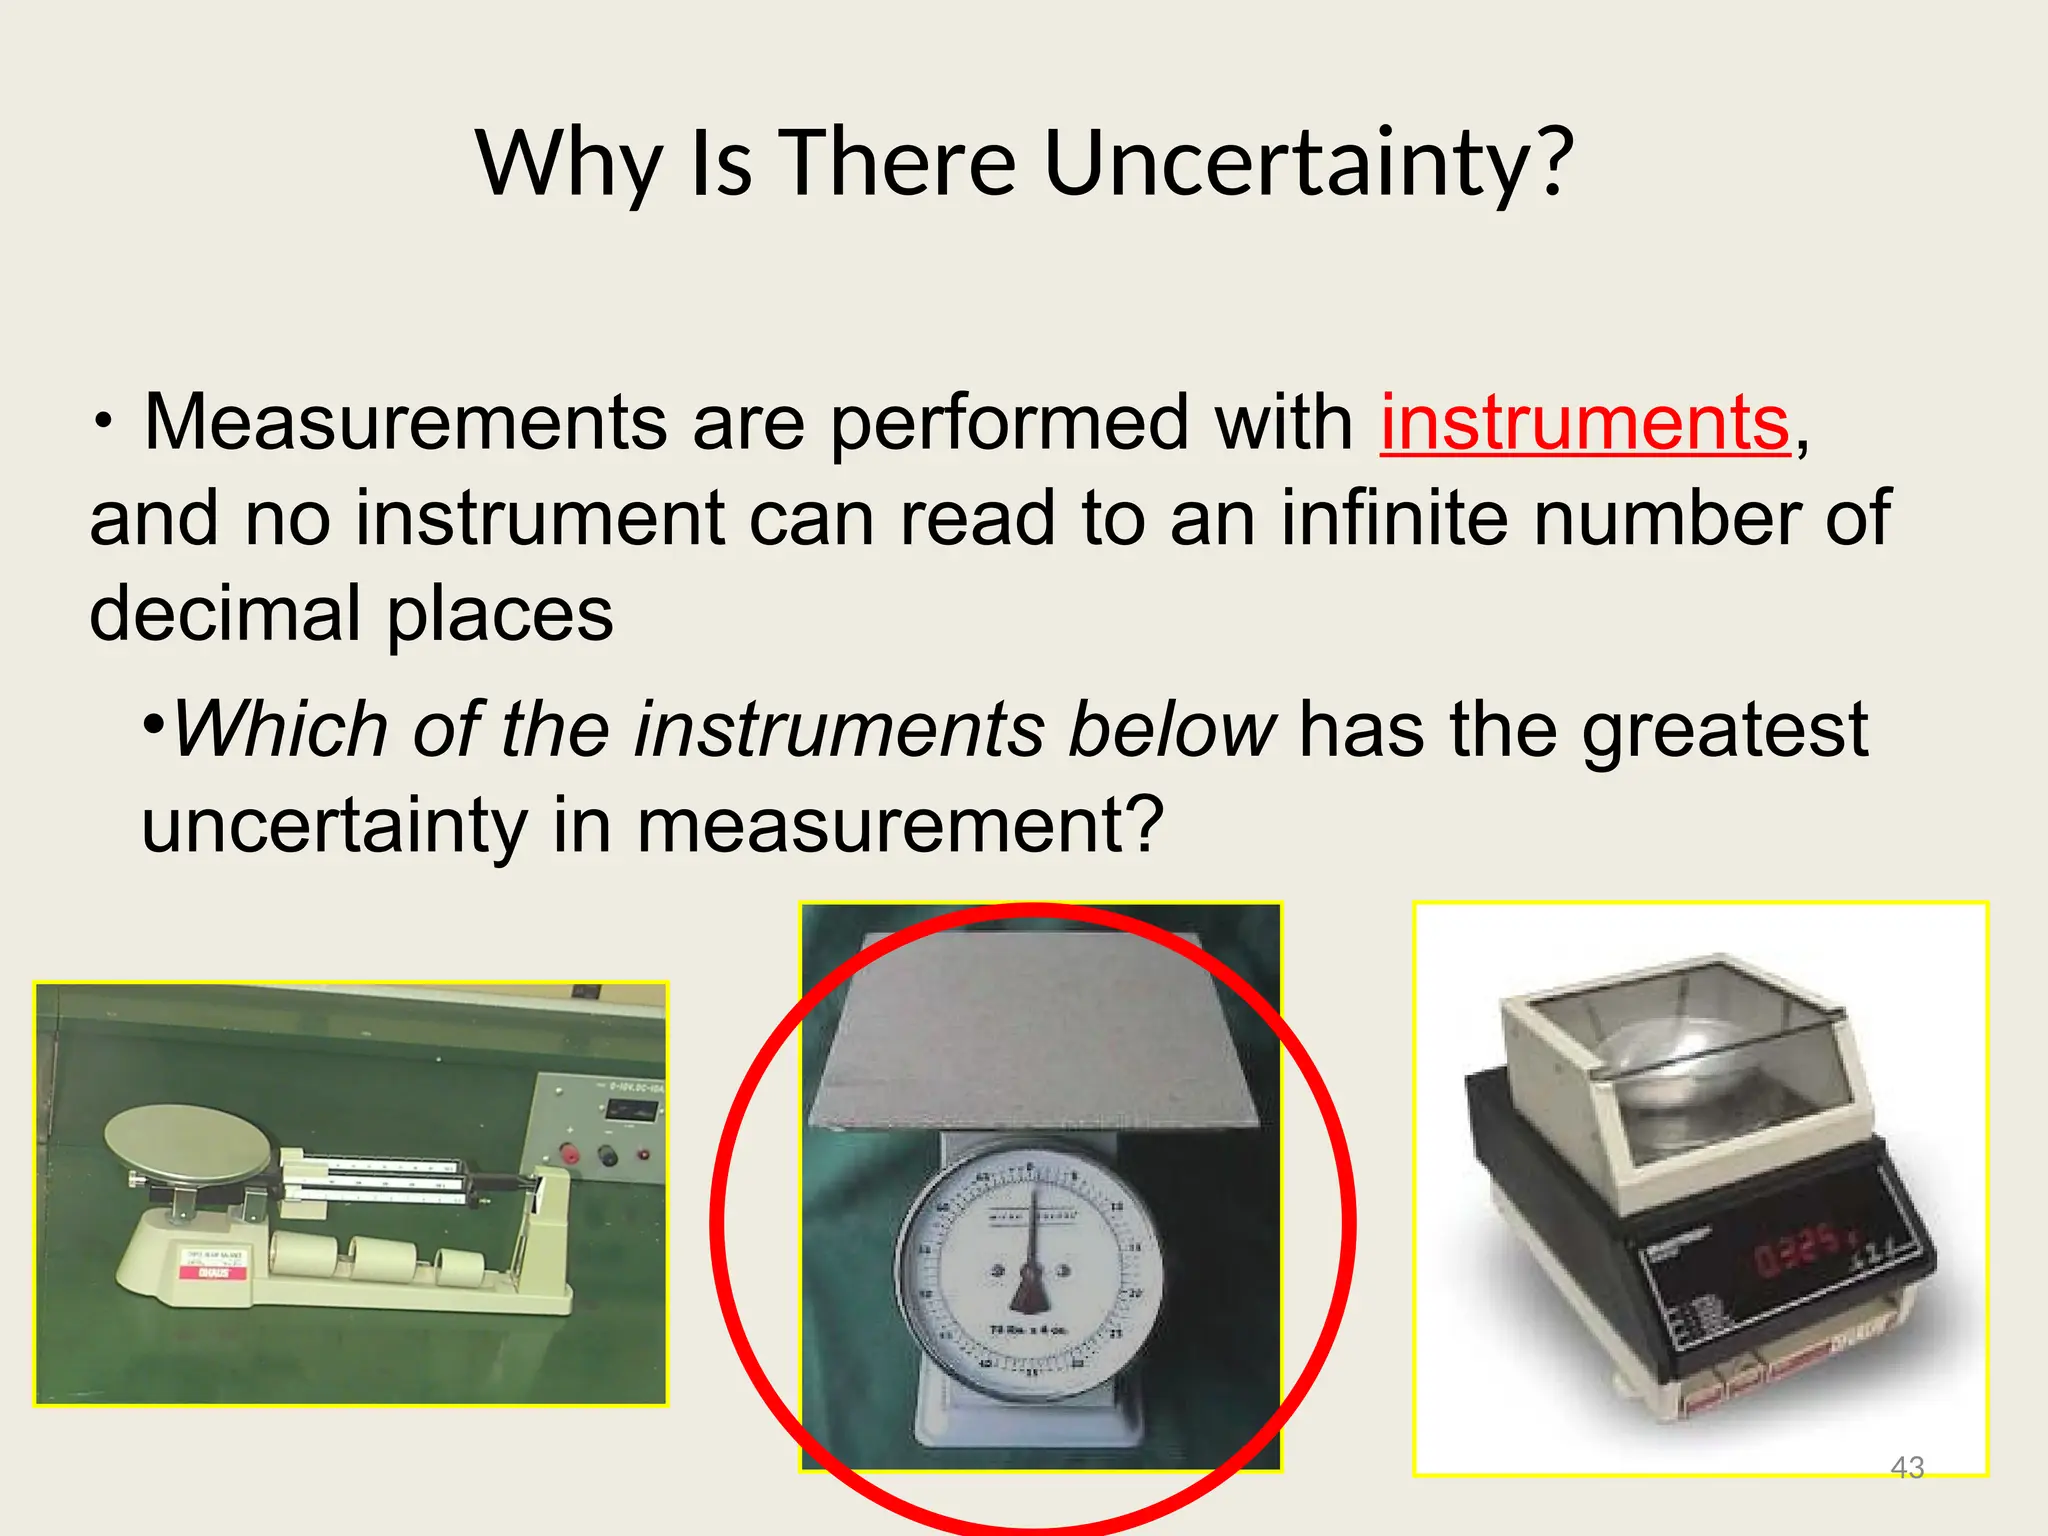
Why Is ThereUncertainty?
• Measurements are performed with instruments,
and no instrument can read to an infinite number of
decimal places
•Which of the instruments below has the greatest
uncertainty in measurement?
43
44.
Performance of Instruments
•All instrumentation systems are characterized
by the system characteristics or system
response
• There are two basic characteristics of
Measuring instruments, they are
– Static character
– Dynamic character
44
45.
Static Characteristics
• Theinstruments, which are used to measure
the quantities which are slowly varying with
time or mostly constant, i.e., do not vary with
time, is called ‘static characteristics’.
45
46.
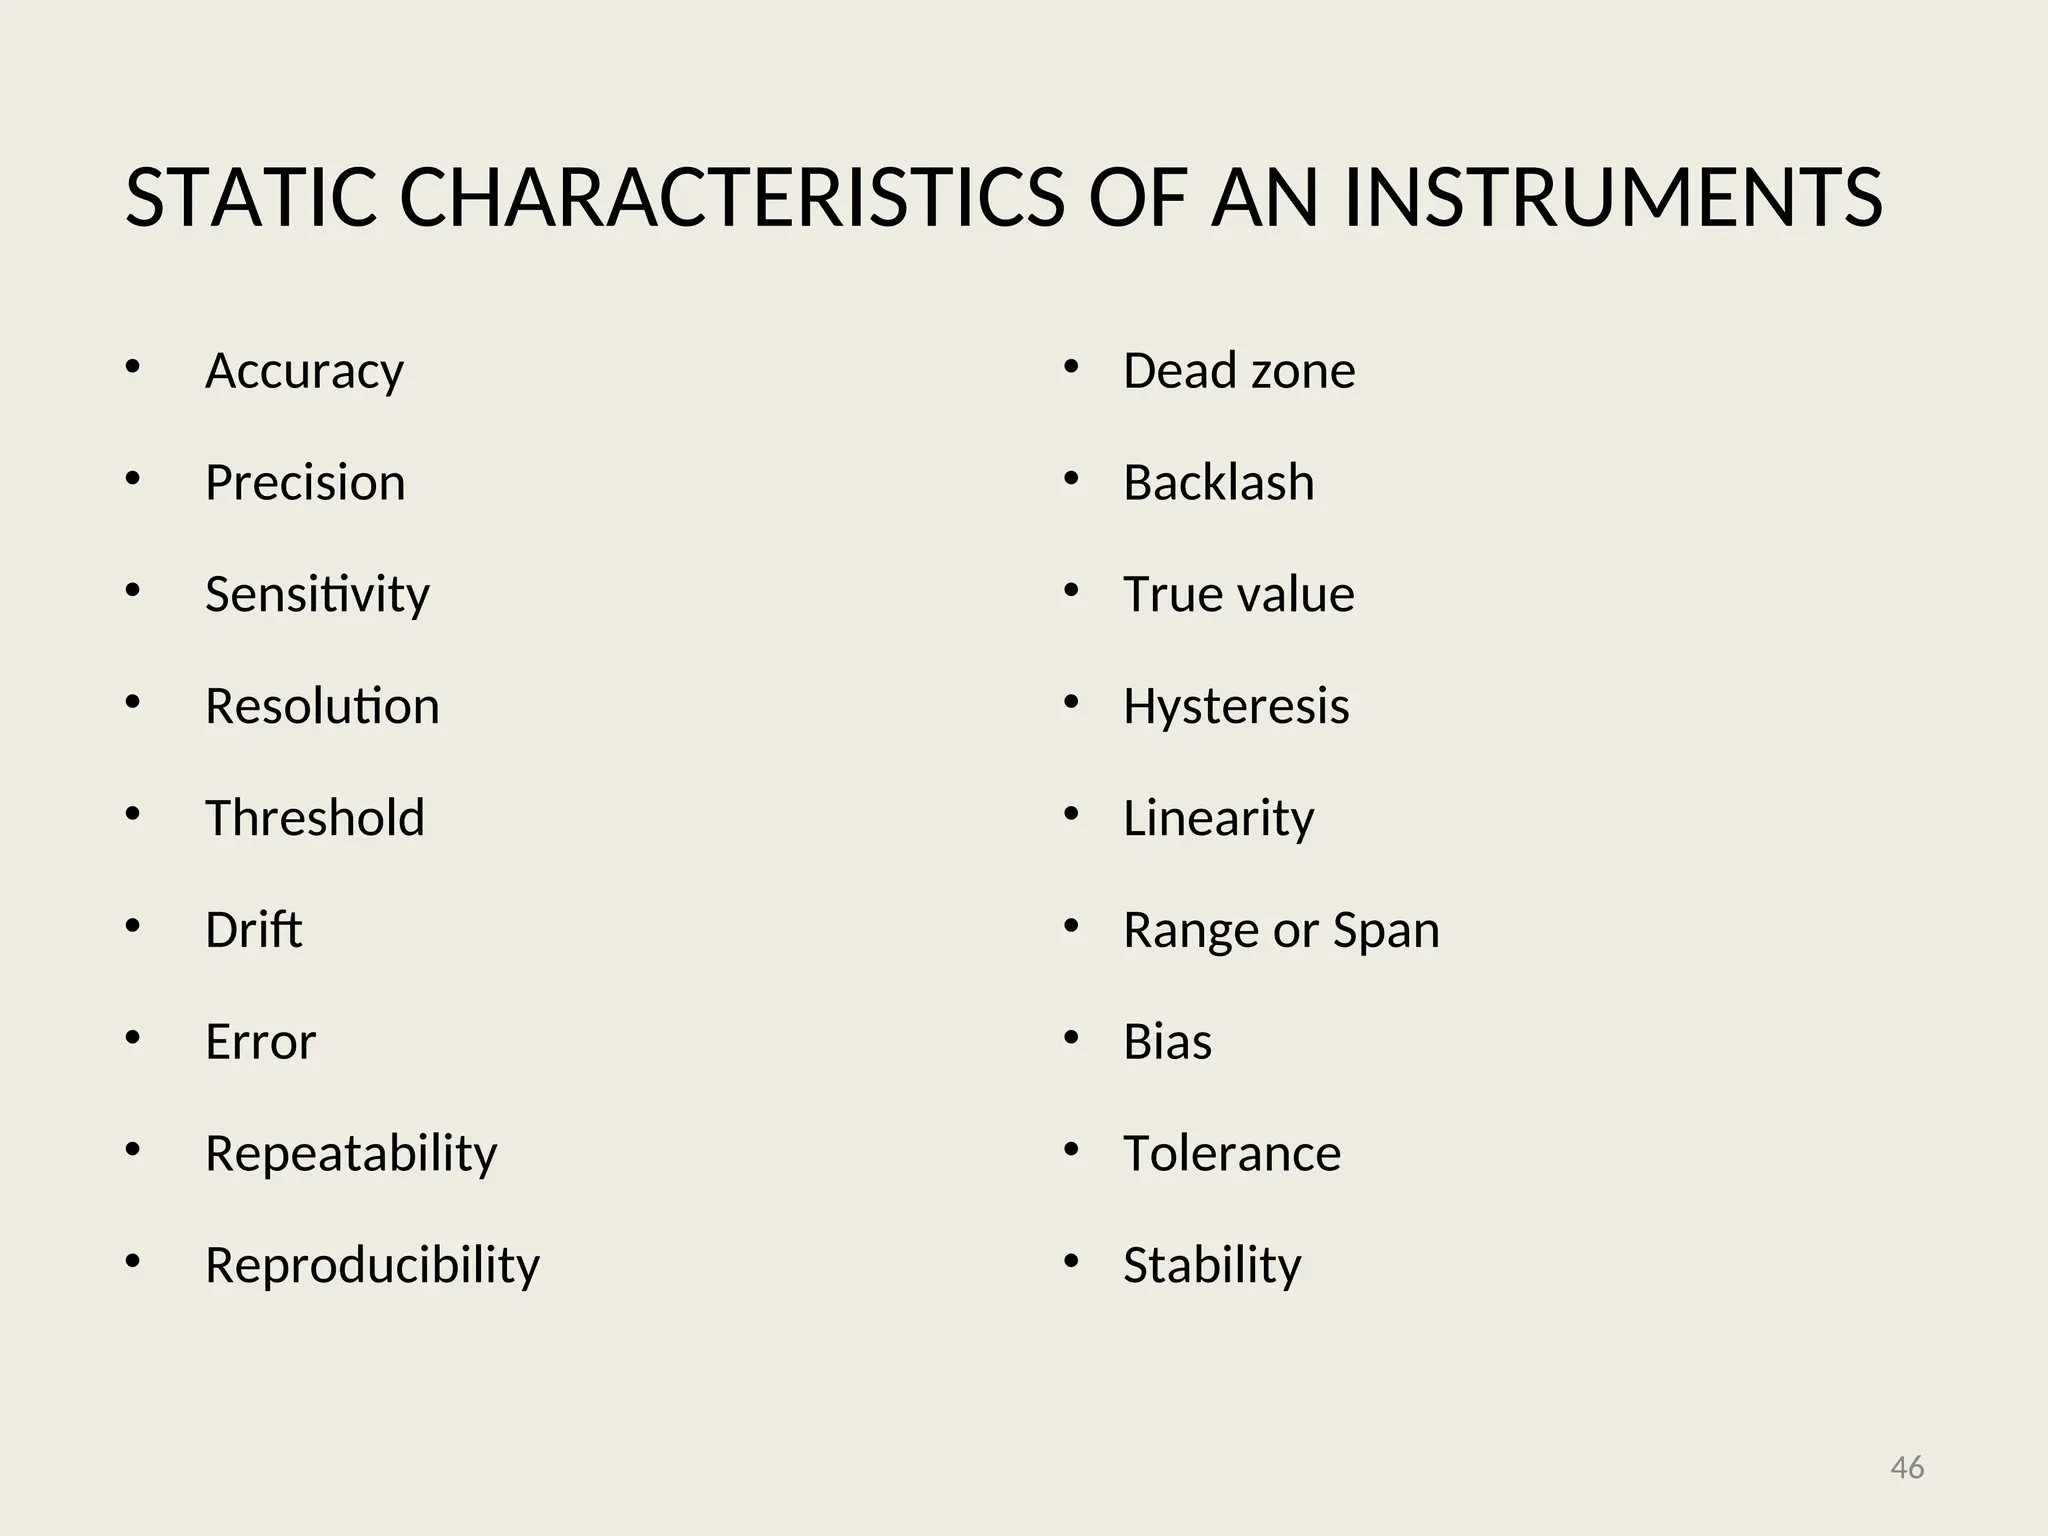
STATIC CHARACTERISTICS OFAN INSTRUMENTS
• Accuracy
• Precision
• Sensitivity
• Resolution
• Threshold
• Drift
• Error
• Repeatability
• Reproducibility
• Dead zone
• Backlash
• True value
• Hysteresis
• Linearity
• Range or Span
• Bias
• Tolerance
• Stability
46
47.
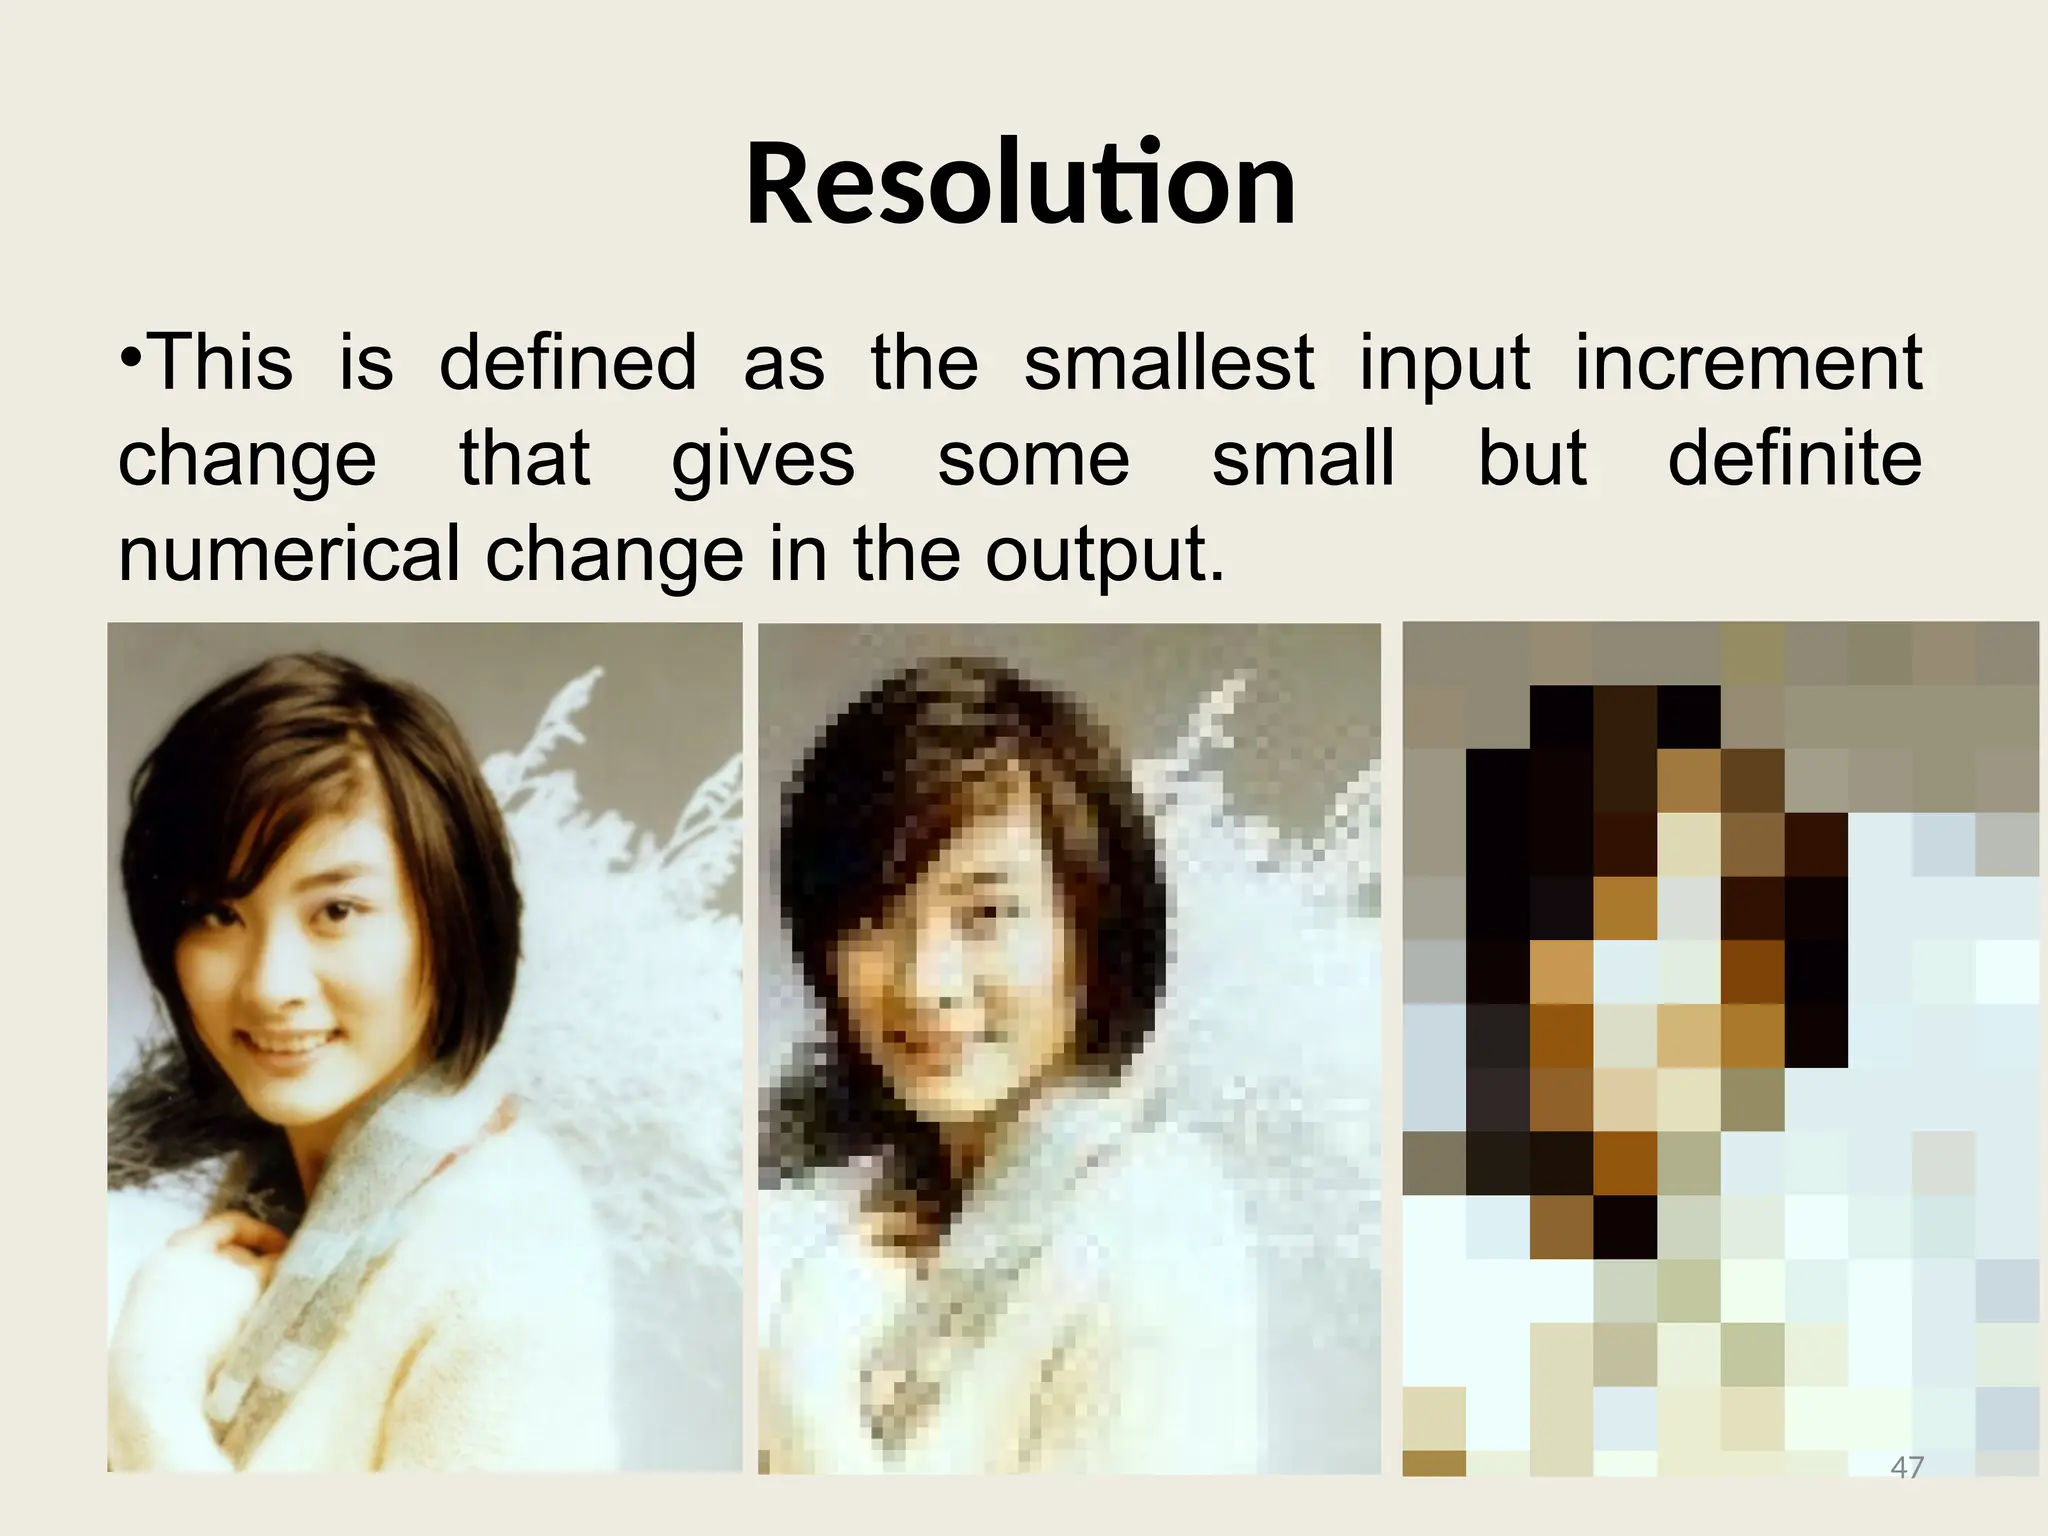
Resolution
•This is definedas the smallest input increment
change that gives some small but definite
numerical change in the output.
47
48.
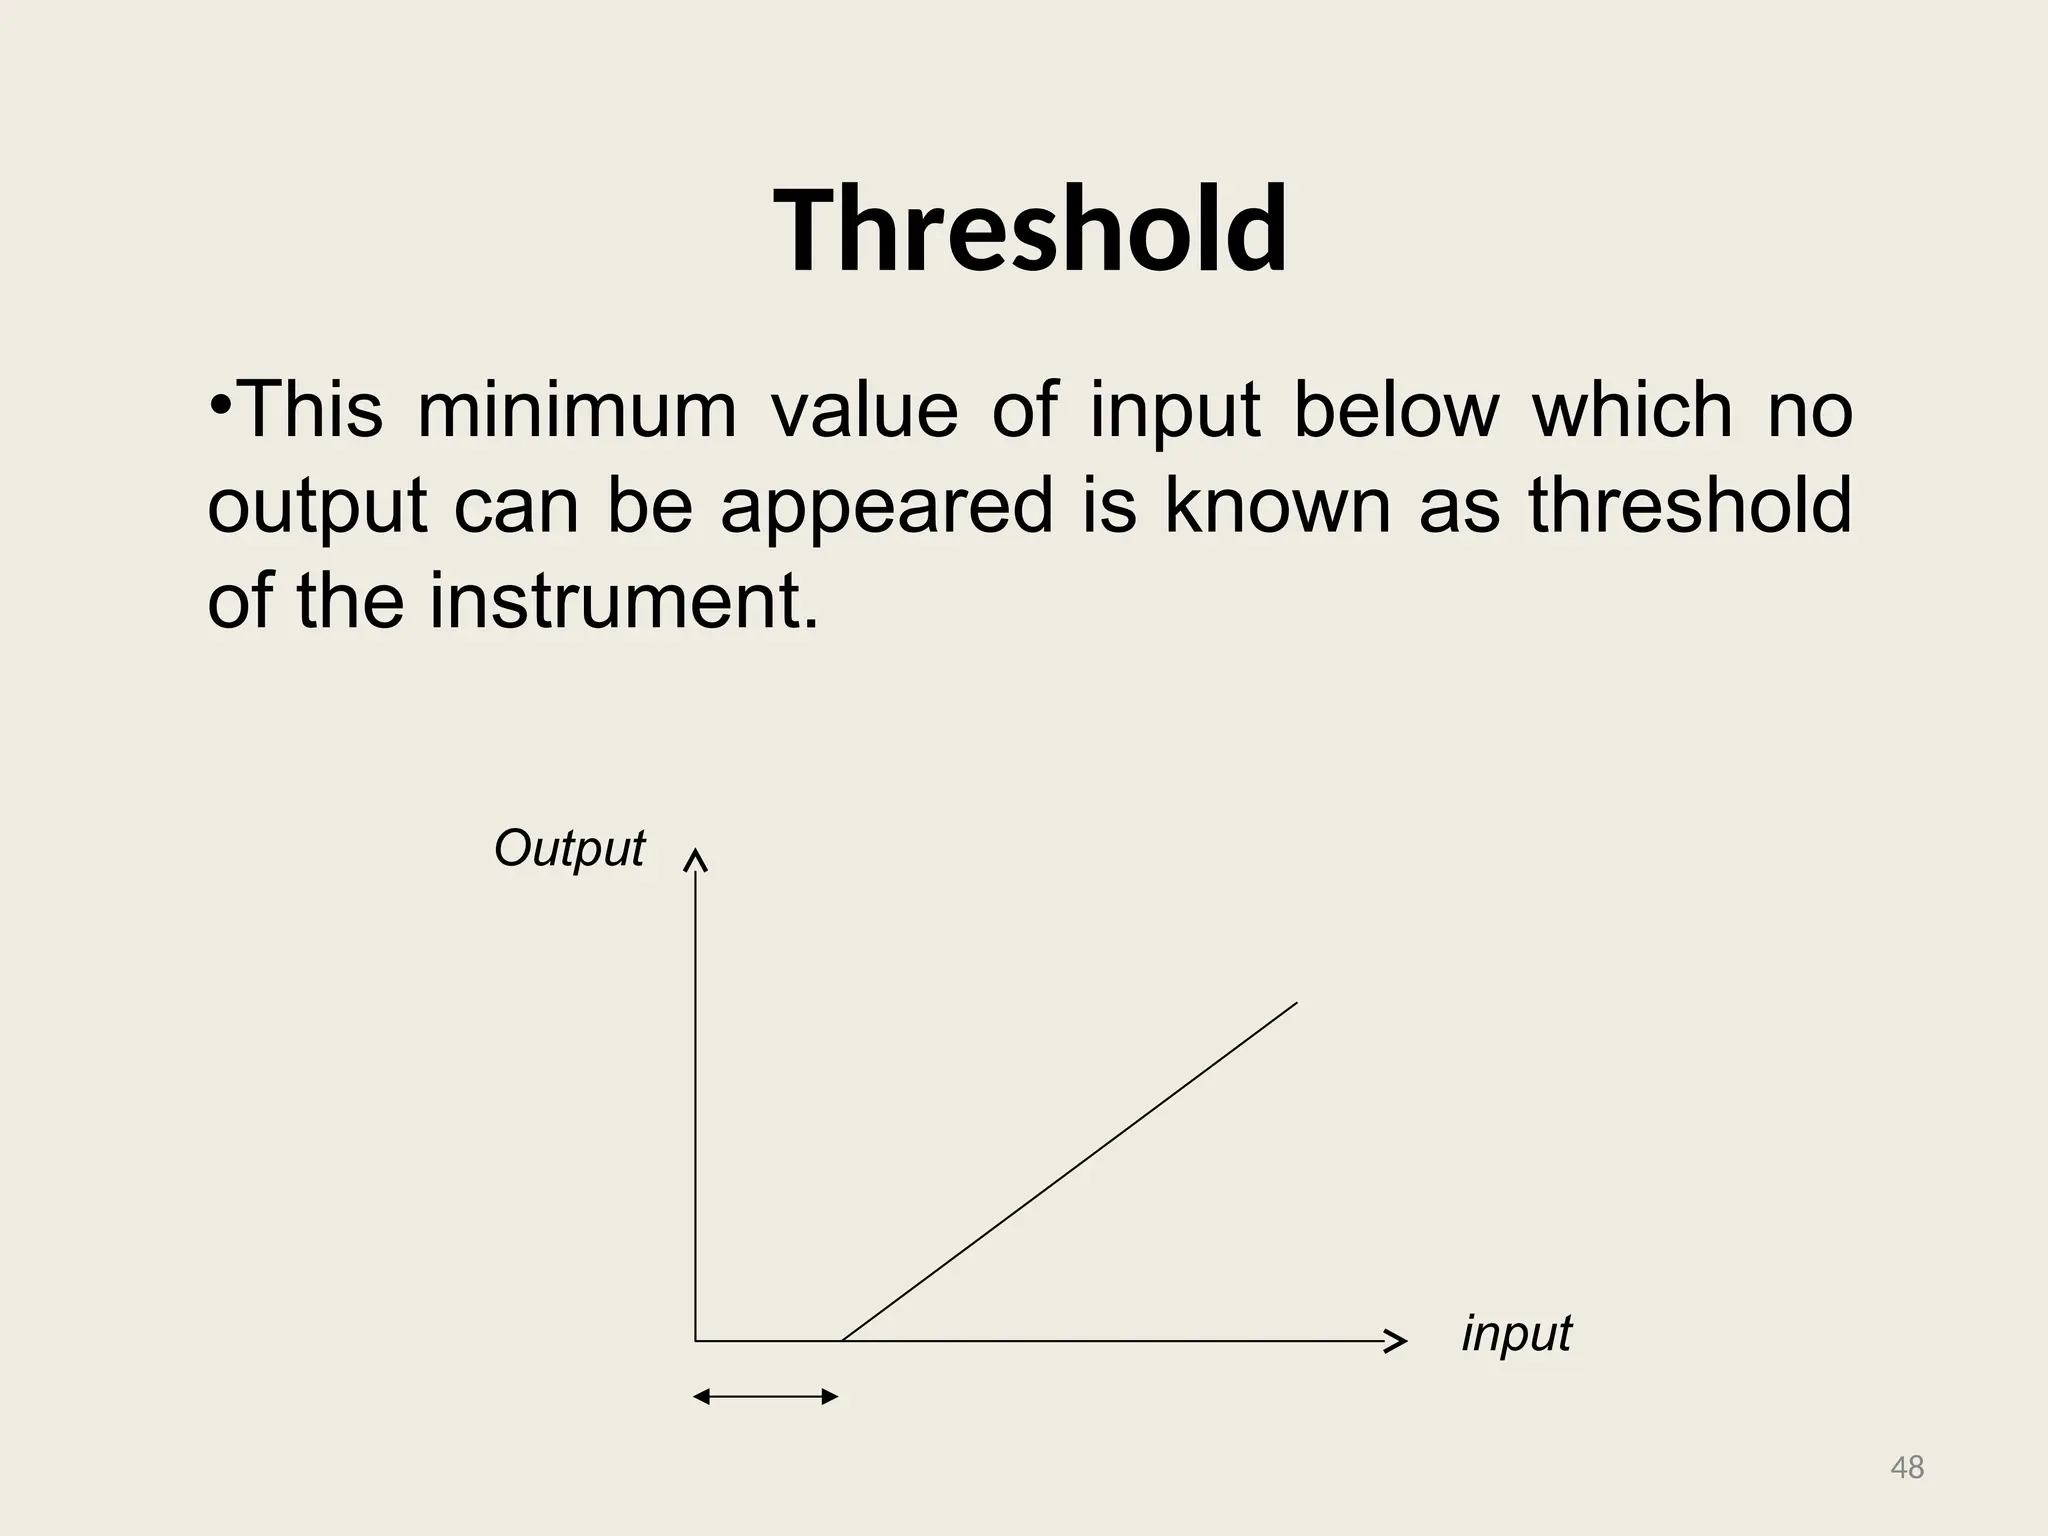
Threshold
•This minimum valueof input below which no
output can be appeared is known as threshold
of the instrument.
input
Output
48
49.
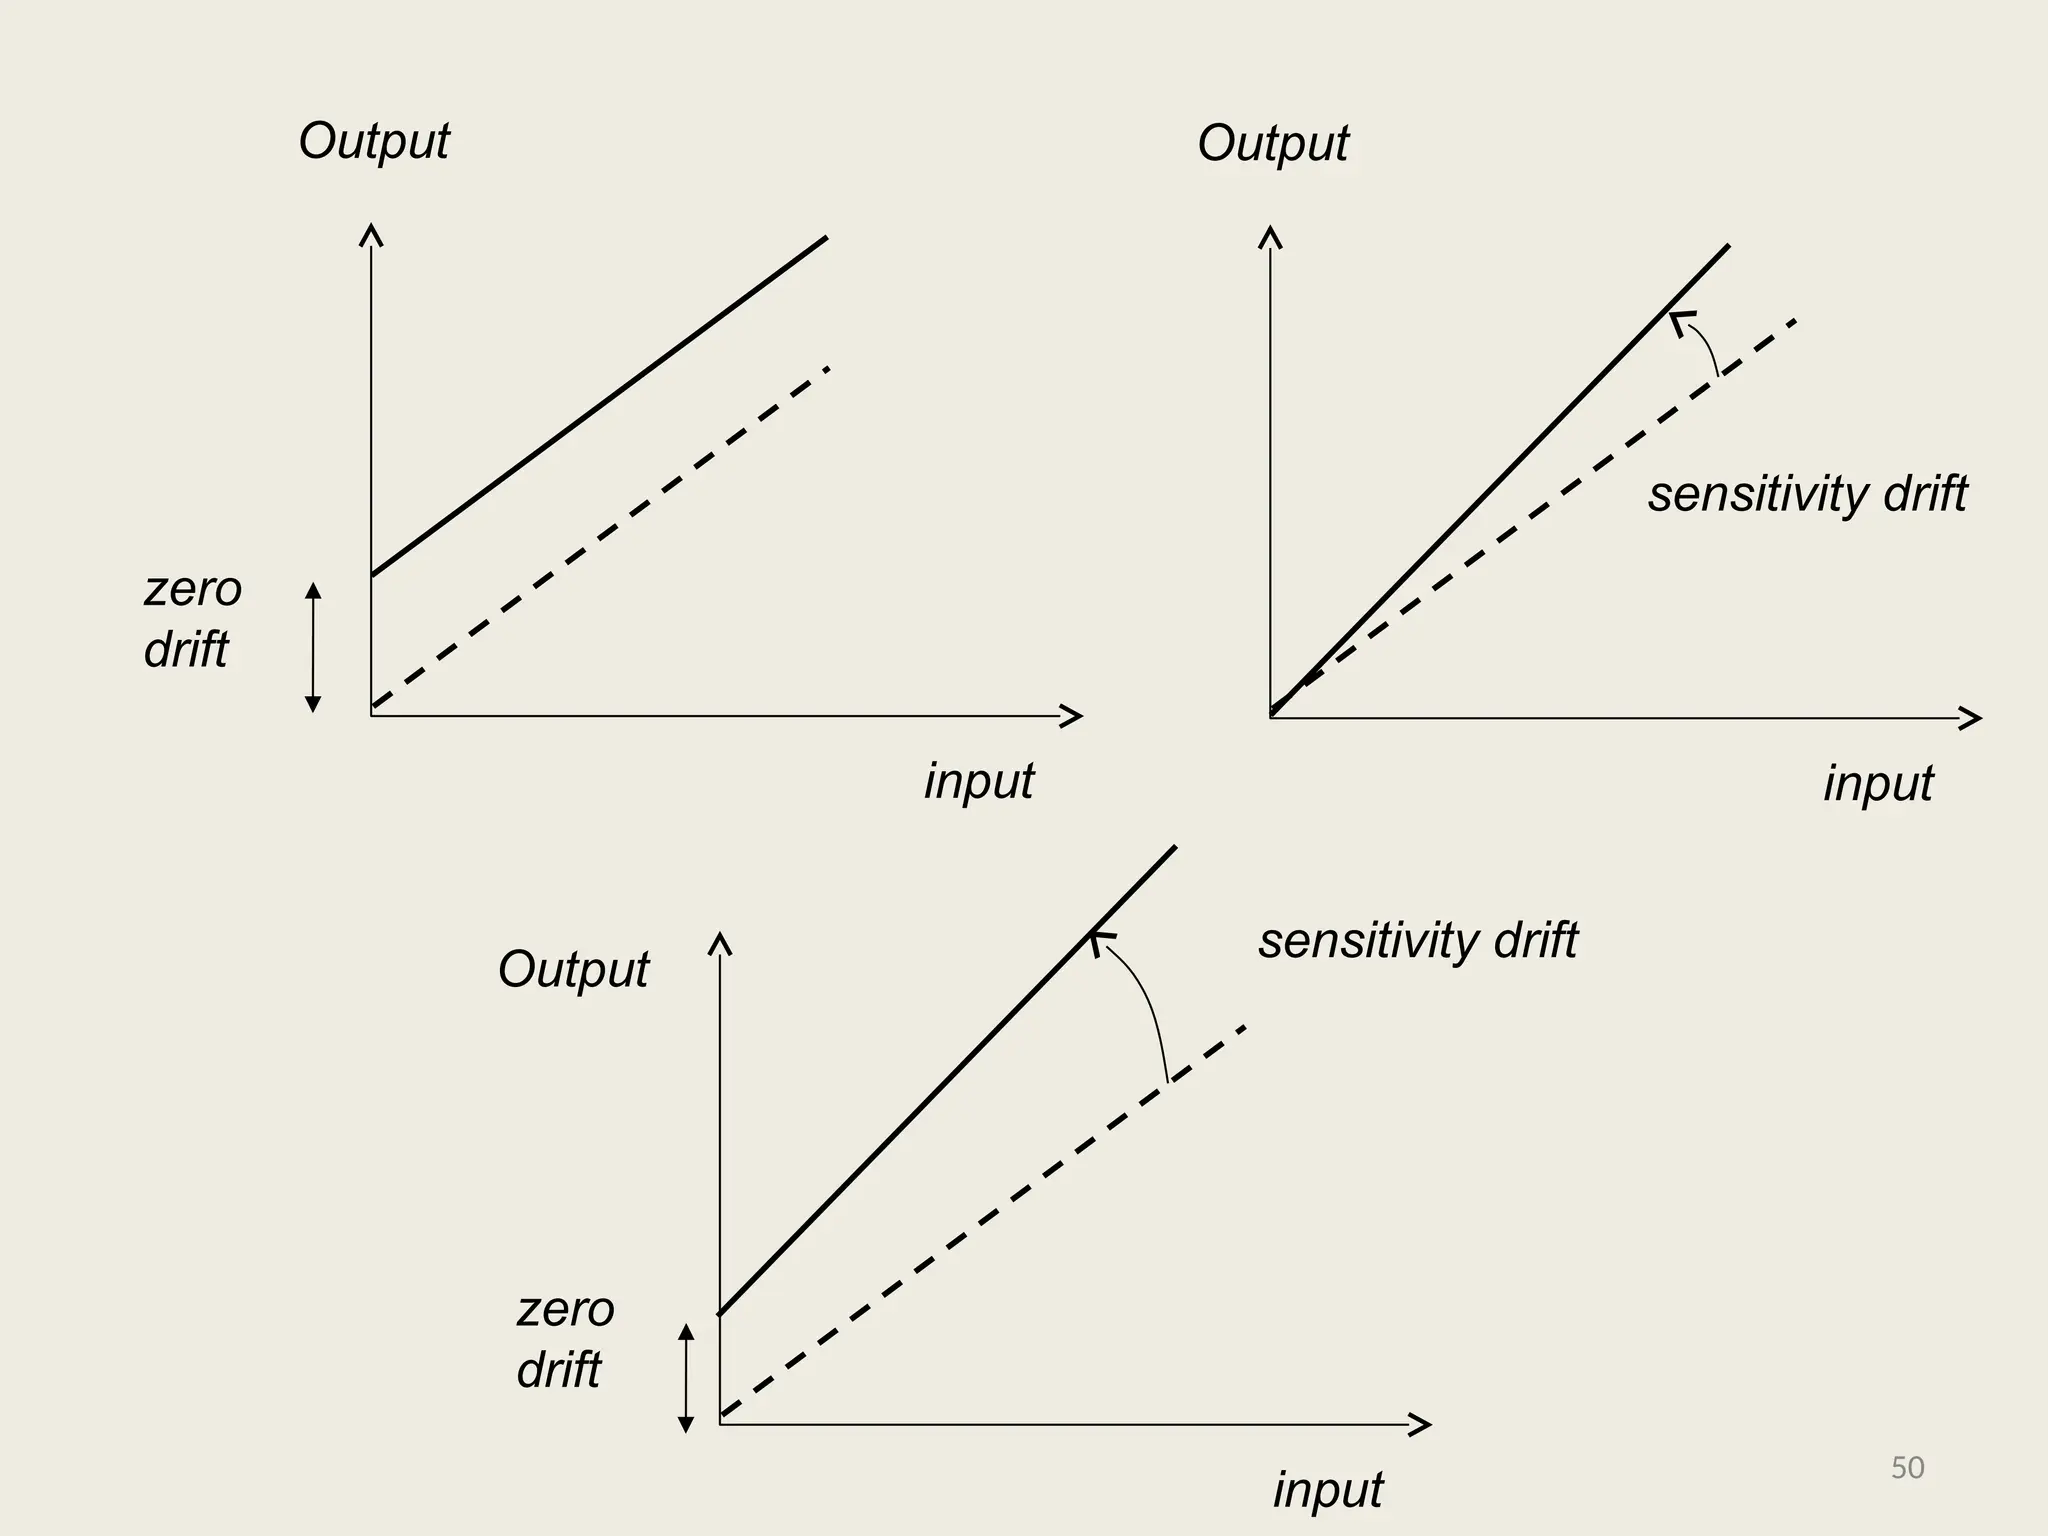
Drift
•Drift or Zerodrift is variation in the output of an
instrument which is not caused by any change in
the input; it is commonly caused by internal
temperature changes and component instability.
•Sensitivity drift defines the amount by which
instrument’s sensitivity varies as ambient
conditions change.
49
• Error –The deviation of the true value from the desired
value is called Error
• Repeatability – It is the closeness value of same output
for same input under same operating condition
• Reproducibility - It is the closeness value of same output
for same input under same operating condition over a
period of time
51
52.
Range
• The ‘Range’is the total range of values which
an instrument is capable of measuring.
52
53.
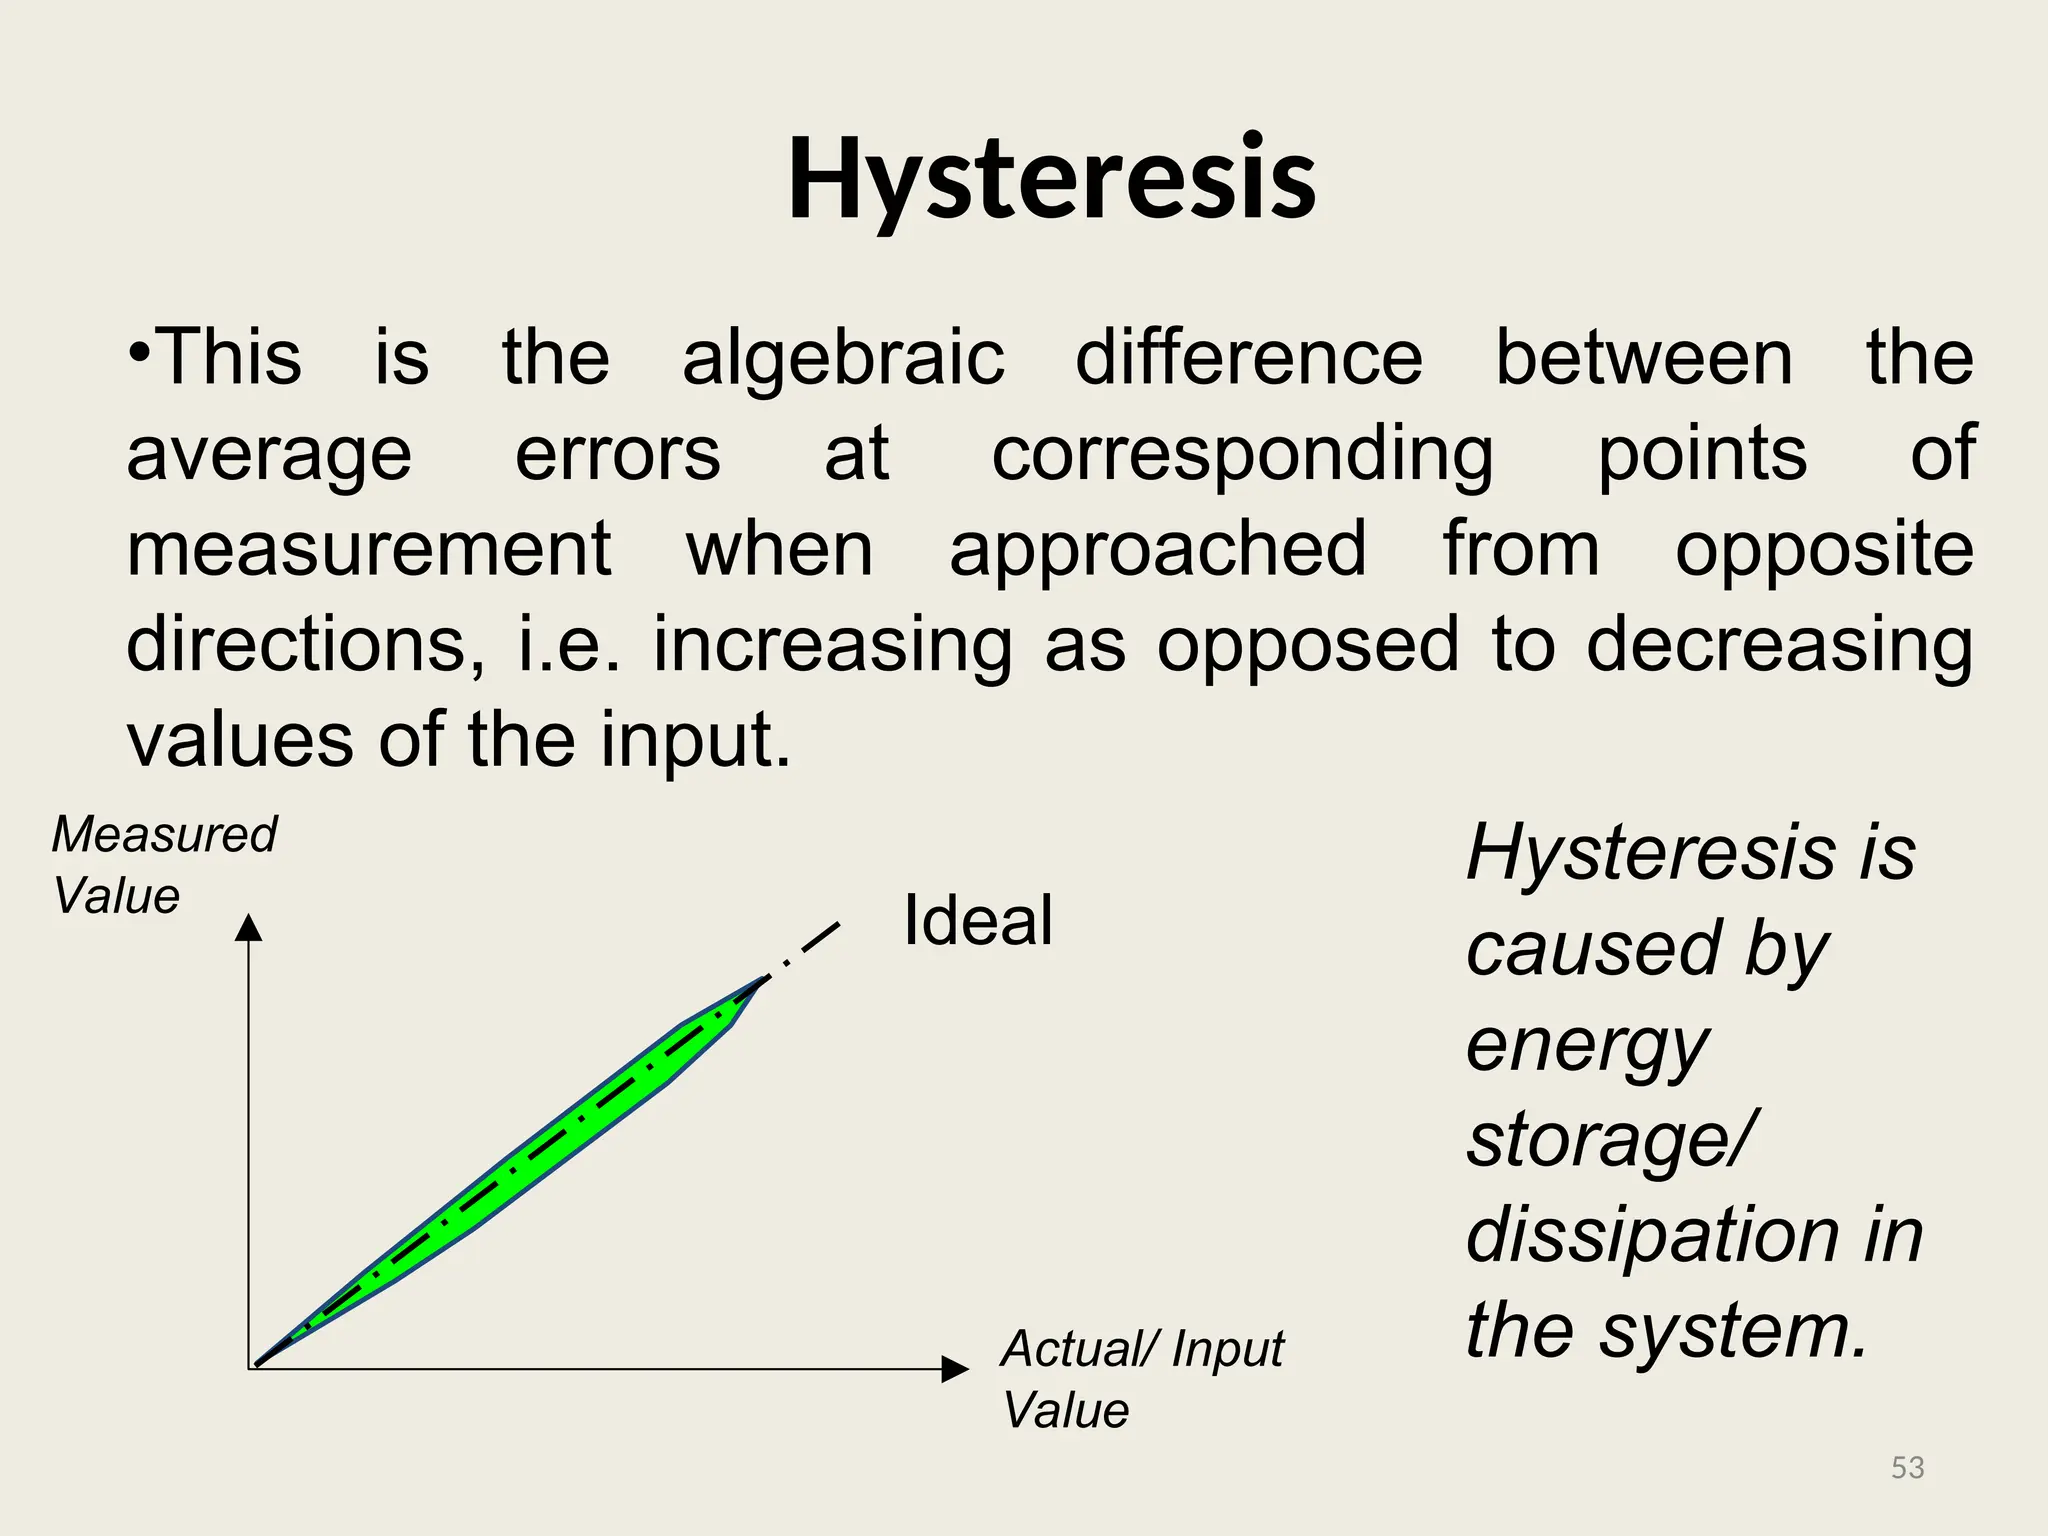
Hysteresis
•This is thealgebraic difference between the
average errors at corresponding points of
measurement when approached from opposite
directions, i.e. increasing as opposed to decreasing
values of the input.
Actual/ Input
Value
Measured
Value
Ideal
Hysteresis is
caused by
energy
storage/
dissipation in
the system.
53
54.
Zero Stability
•The abilityof the instrument to return to zero
reading after the measured has returned to zero
54
55.
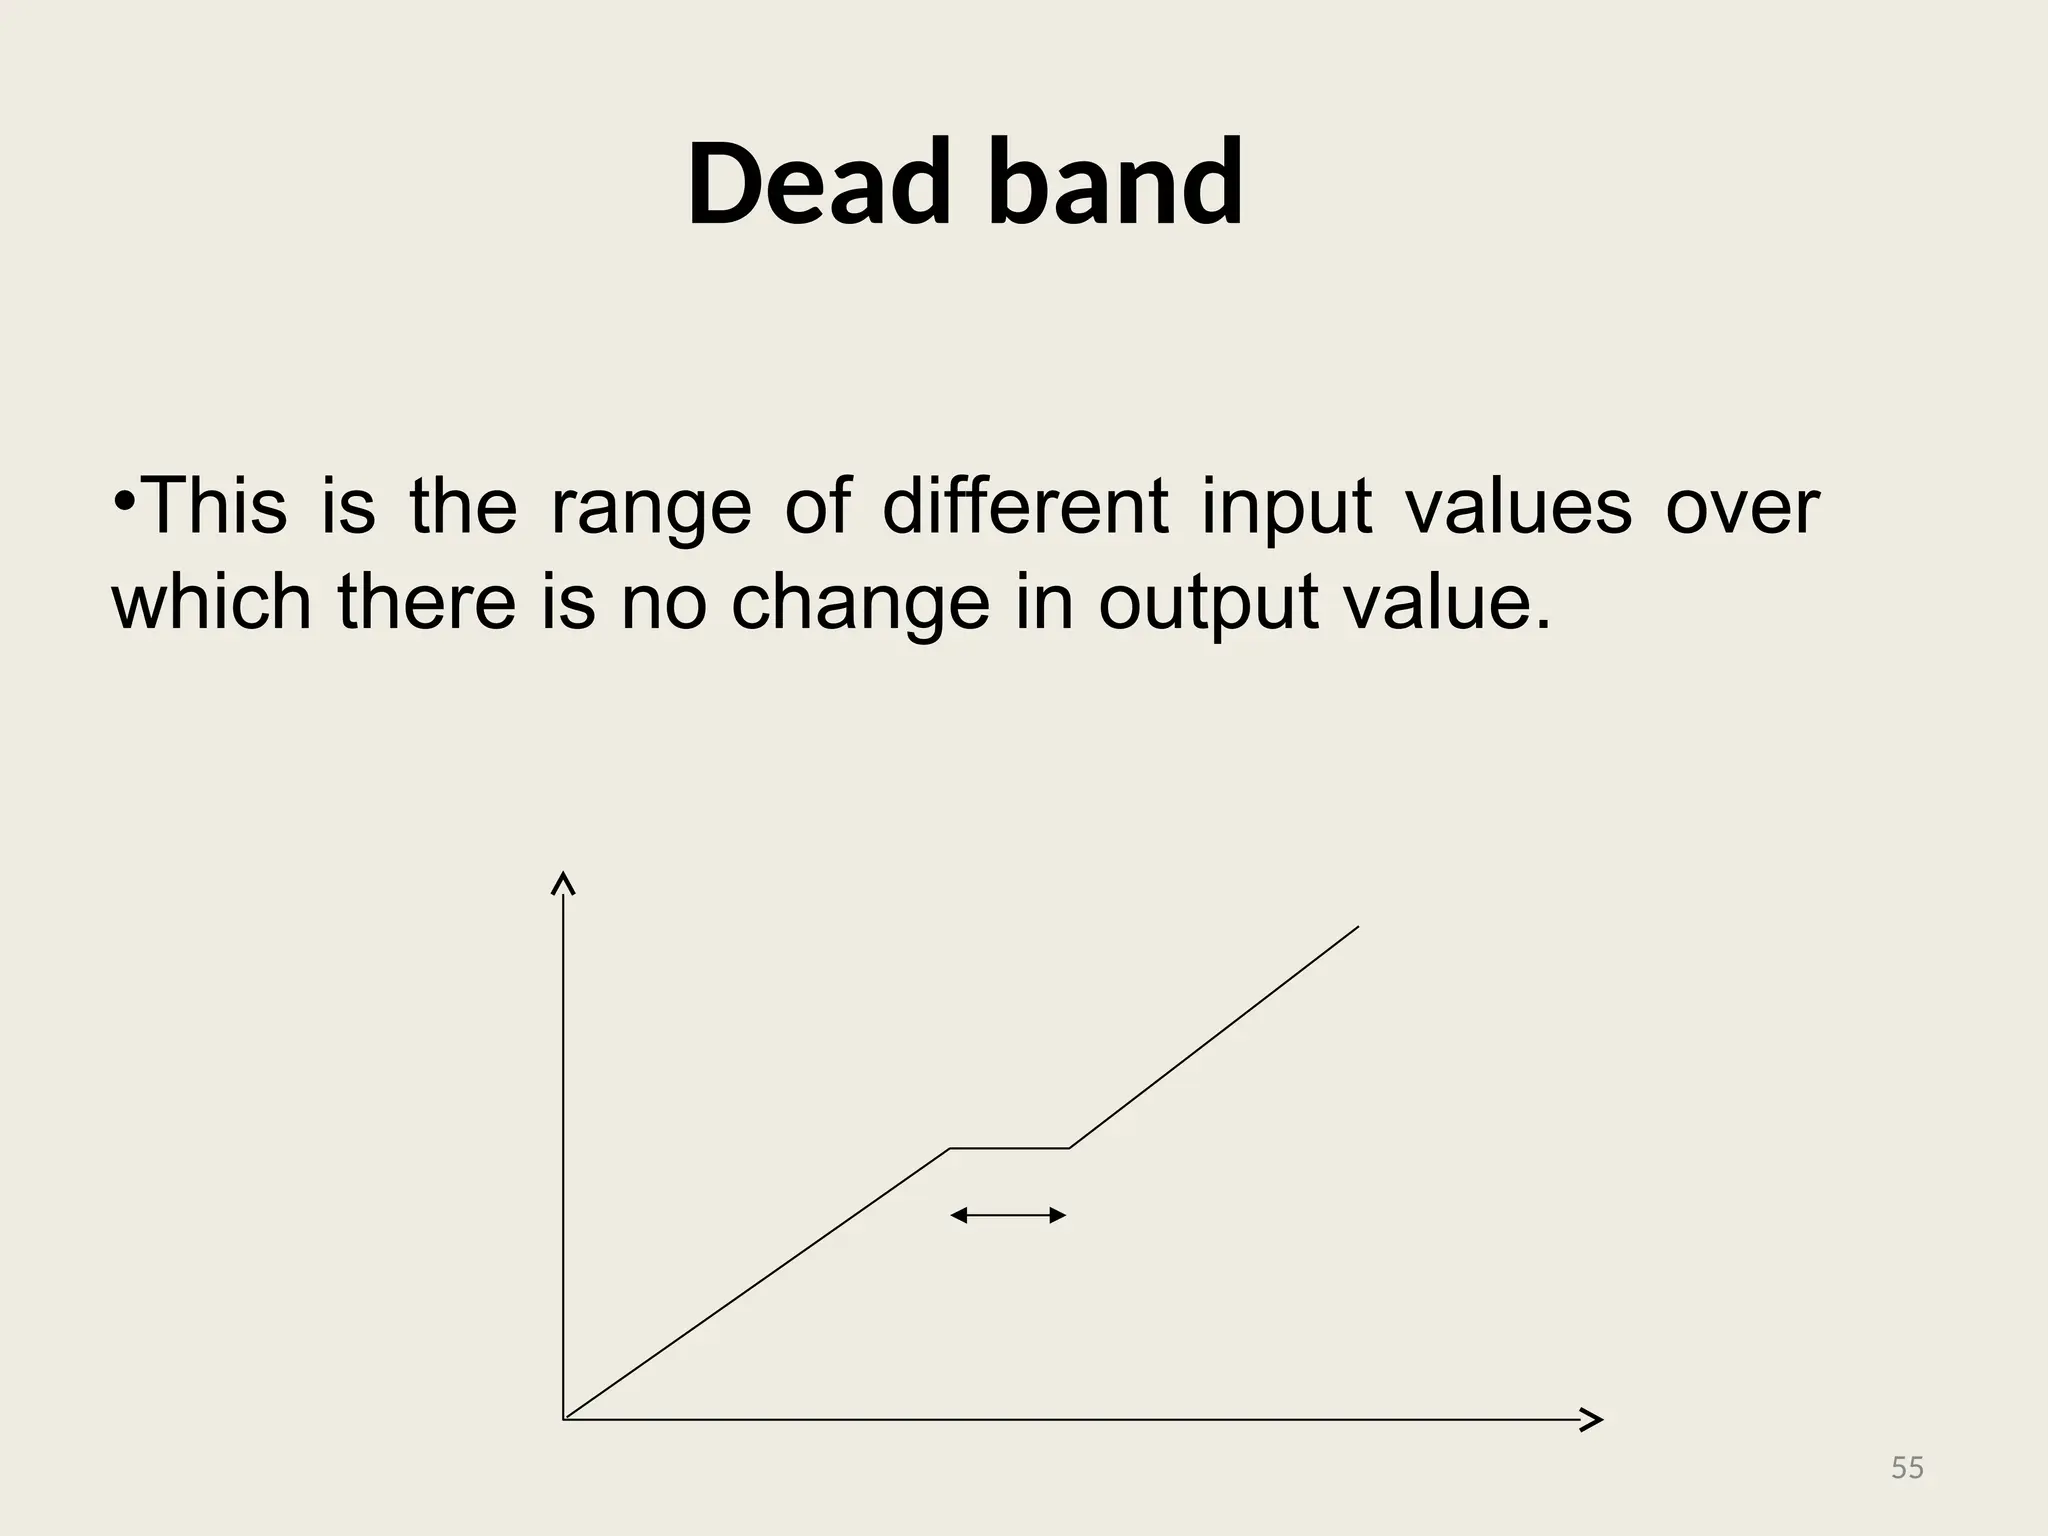
Dead band
•This isthe range of different input values over
which there is no change in output value.
55
56.
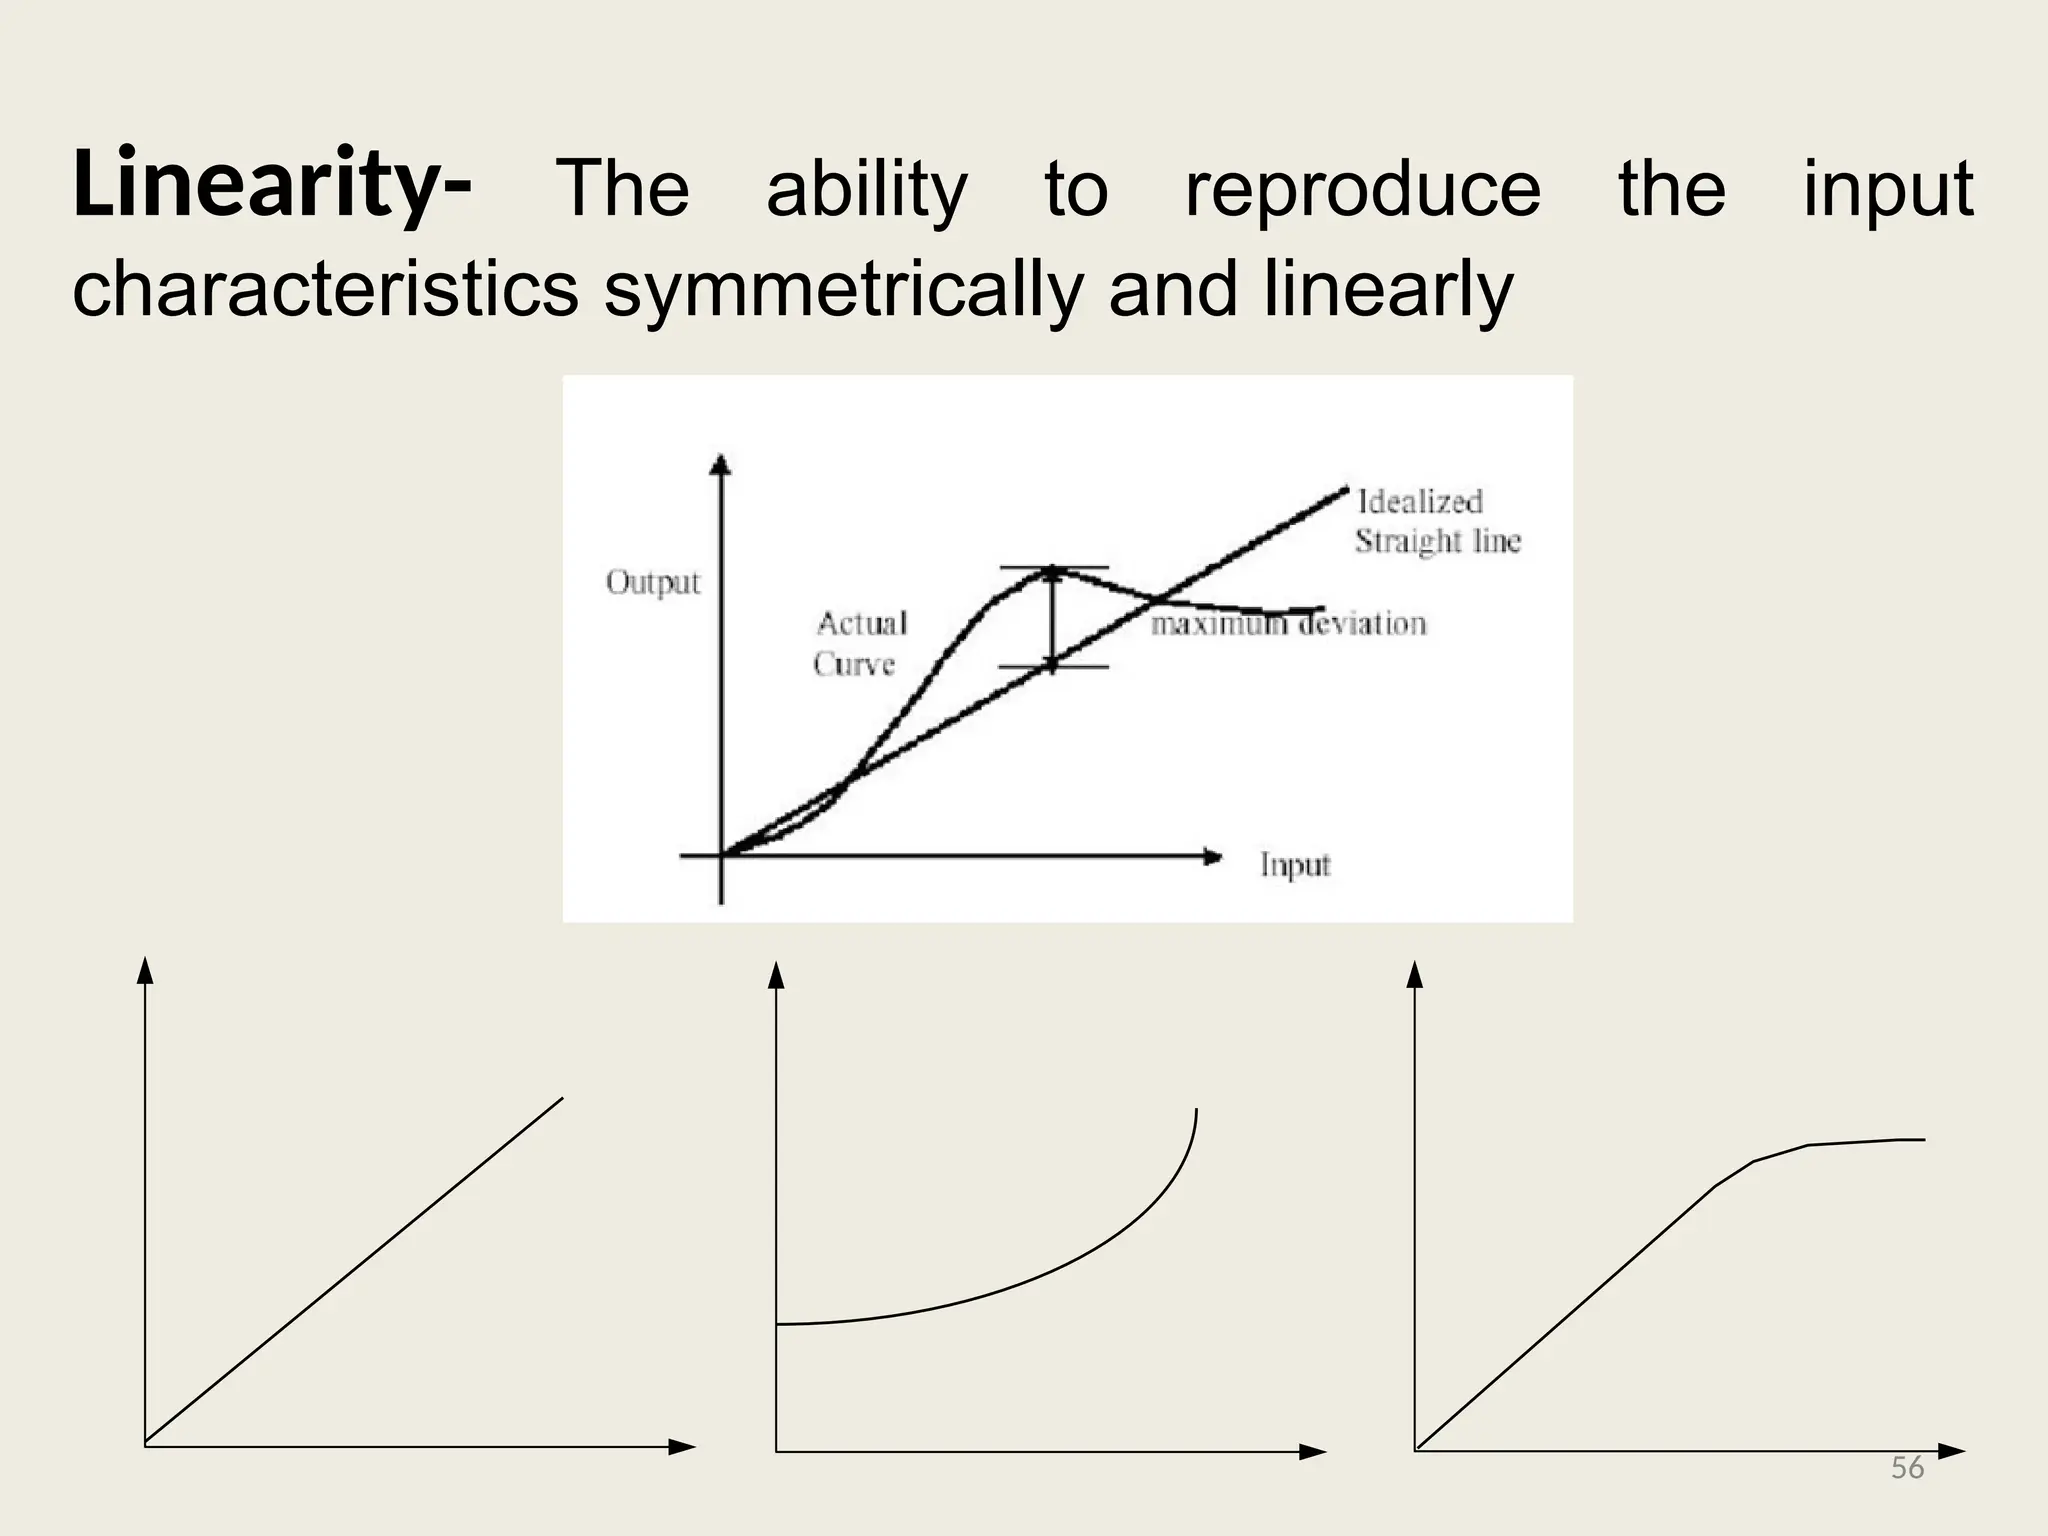
Linearity- The abilityto reproduce the input
characteristics symmetrically and linearly
56
57.
• Backlash –Lost motion or free play of
mechanical elements are known as backlash
• True value – The errorless value of measured
variable is known as true value
• Bias – The Constant Error
• Tolerance – Maximum Allowable error in
Measurement
57
58.
Dynamic Characteristics
• Theset of criteria defined for the
instruments, which are changes rapidly with
time, is called ‘dynamic characteristics’.
58
• Steady stateperiodic – Magnitude has a definite
repeating time cycle
• Transient – Magnitude whose output does not
have definite repeating time cycle
• Speed of response- System responds to changes
in the measured quantity
60
61.
• Measuring lag
–Retardation type :Begins immediately after the
change in measured quantity
– Time delay lag : Begins after a dead time after the
application of the input
• Fidelity – The degree to which a measurement
system indicates changes in the measured
quantity without error
• Dynamic error – Difference between the true
value of the quantity changing with time & the
value indicated by the measurement system
61
62.
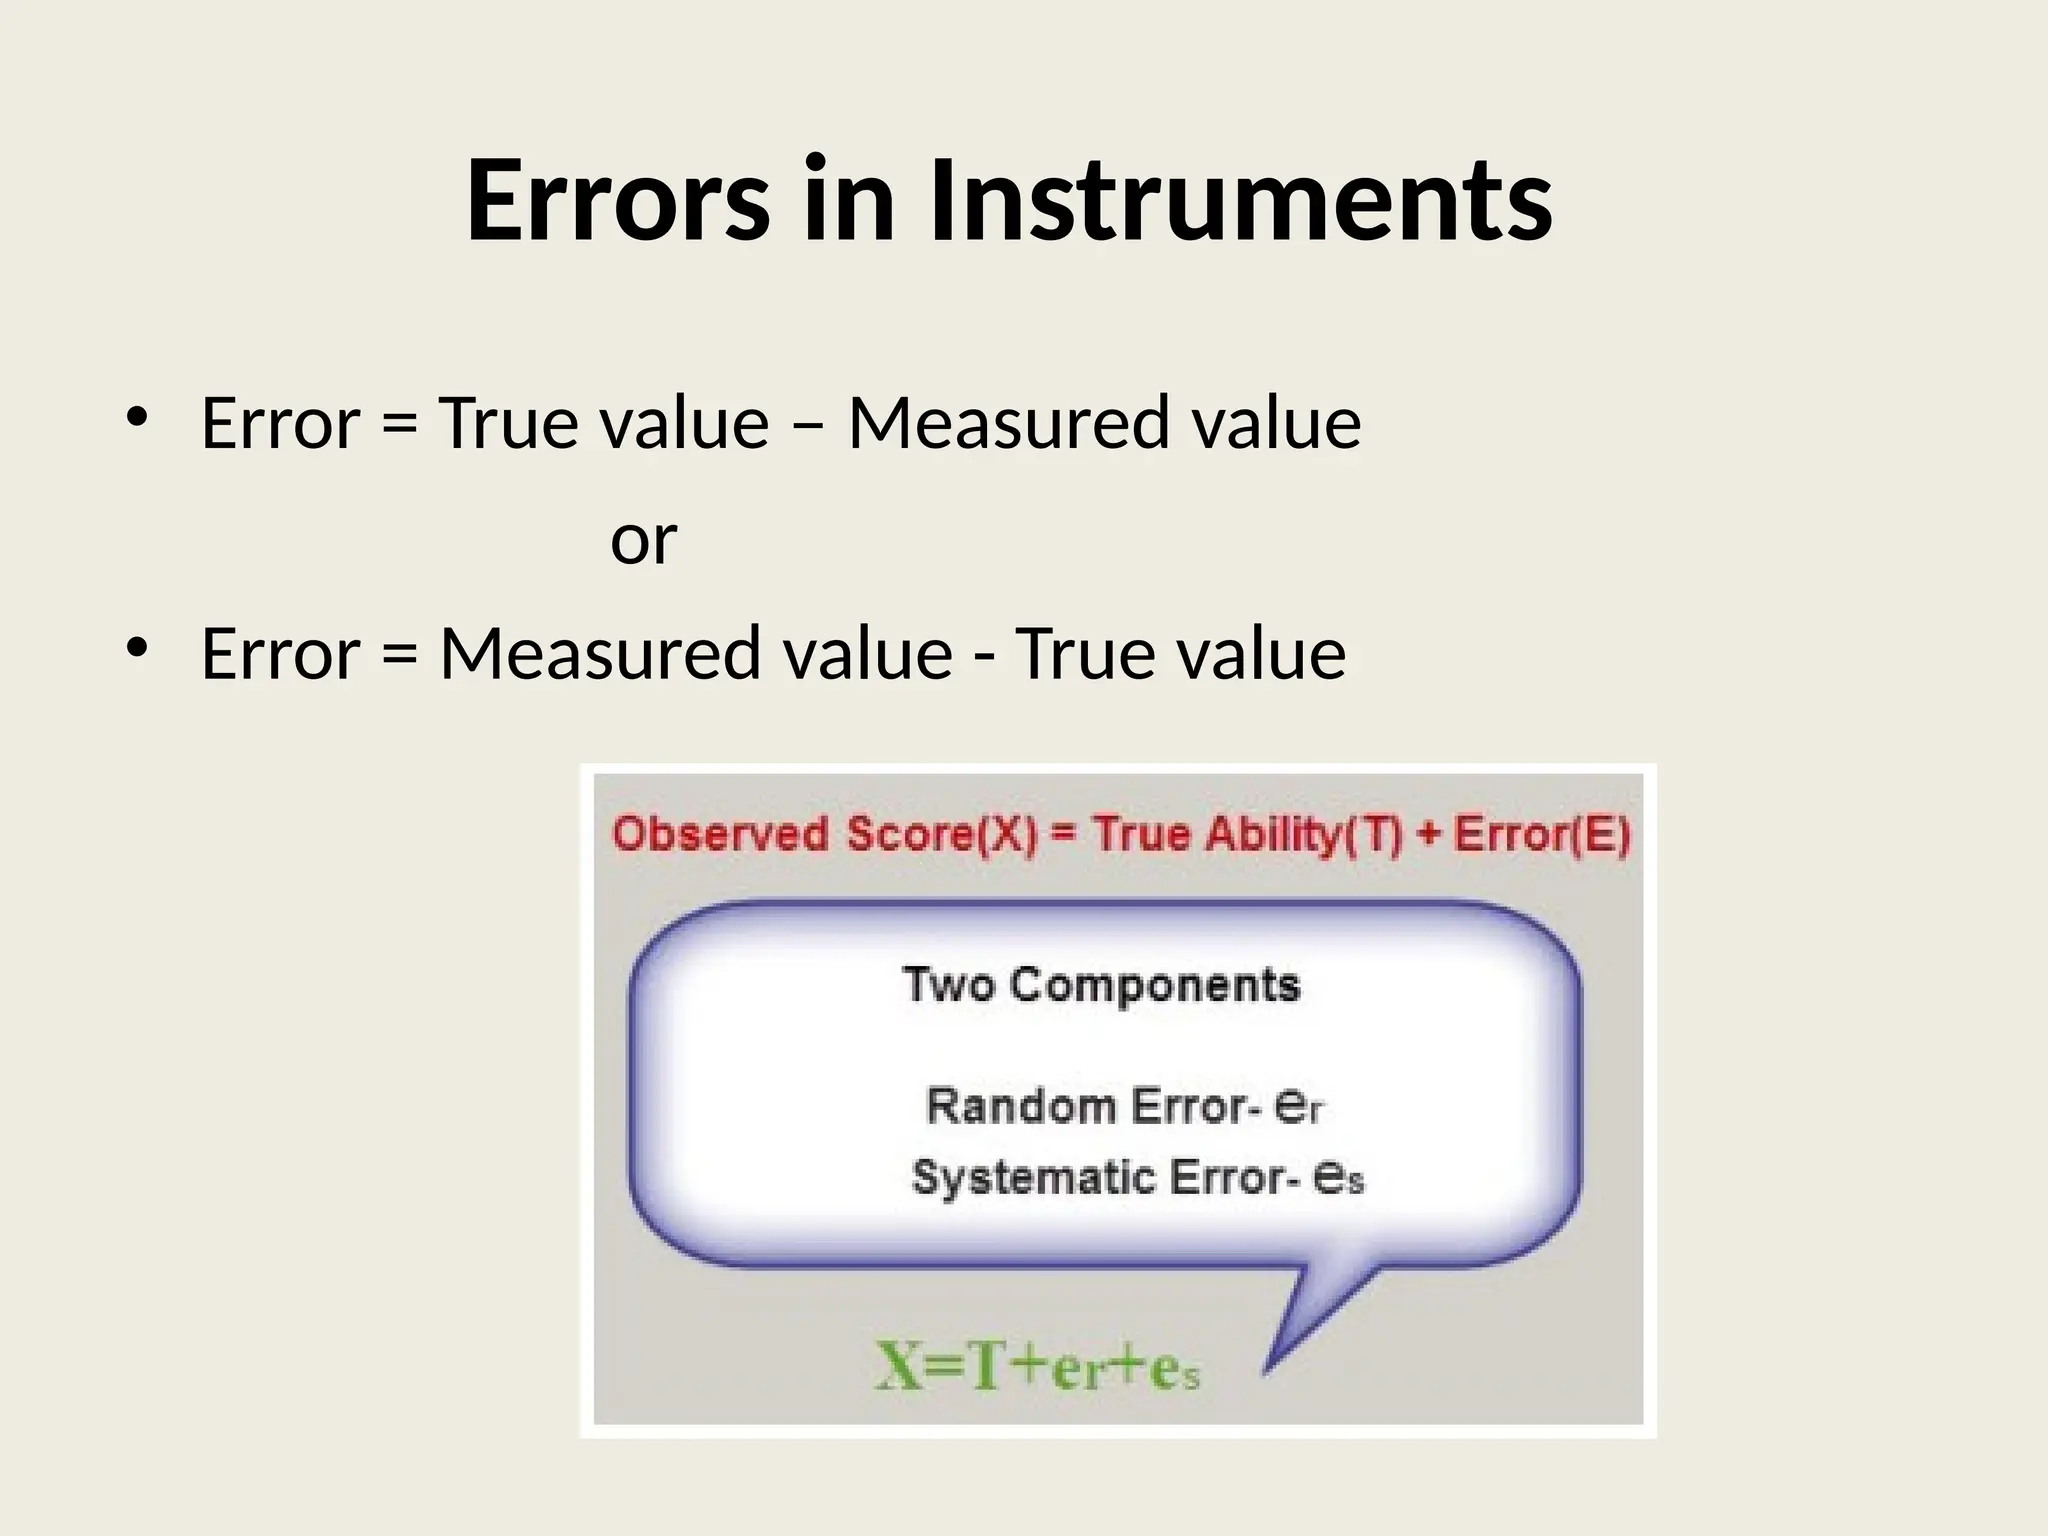
Errors in Instruments
•Error = True value – Measured value
or
• Error = Measured value - True value
63.
Types of Errors
•Classified into 3 types generally based on
Nature of Errors as:
– Gross Errors
– Blunders
– Measurement Errors
64.
Types of Errors– Contd…
• Classified into 2 types based on Control
– Controllable errors
• Calibration errors
• Environmental (Ambient /Atmospheric Condition)
Errors
• Stylus pressure errors
• Avoidable errors
– Non - Controllable errors
65.
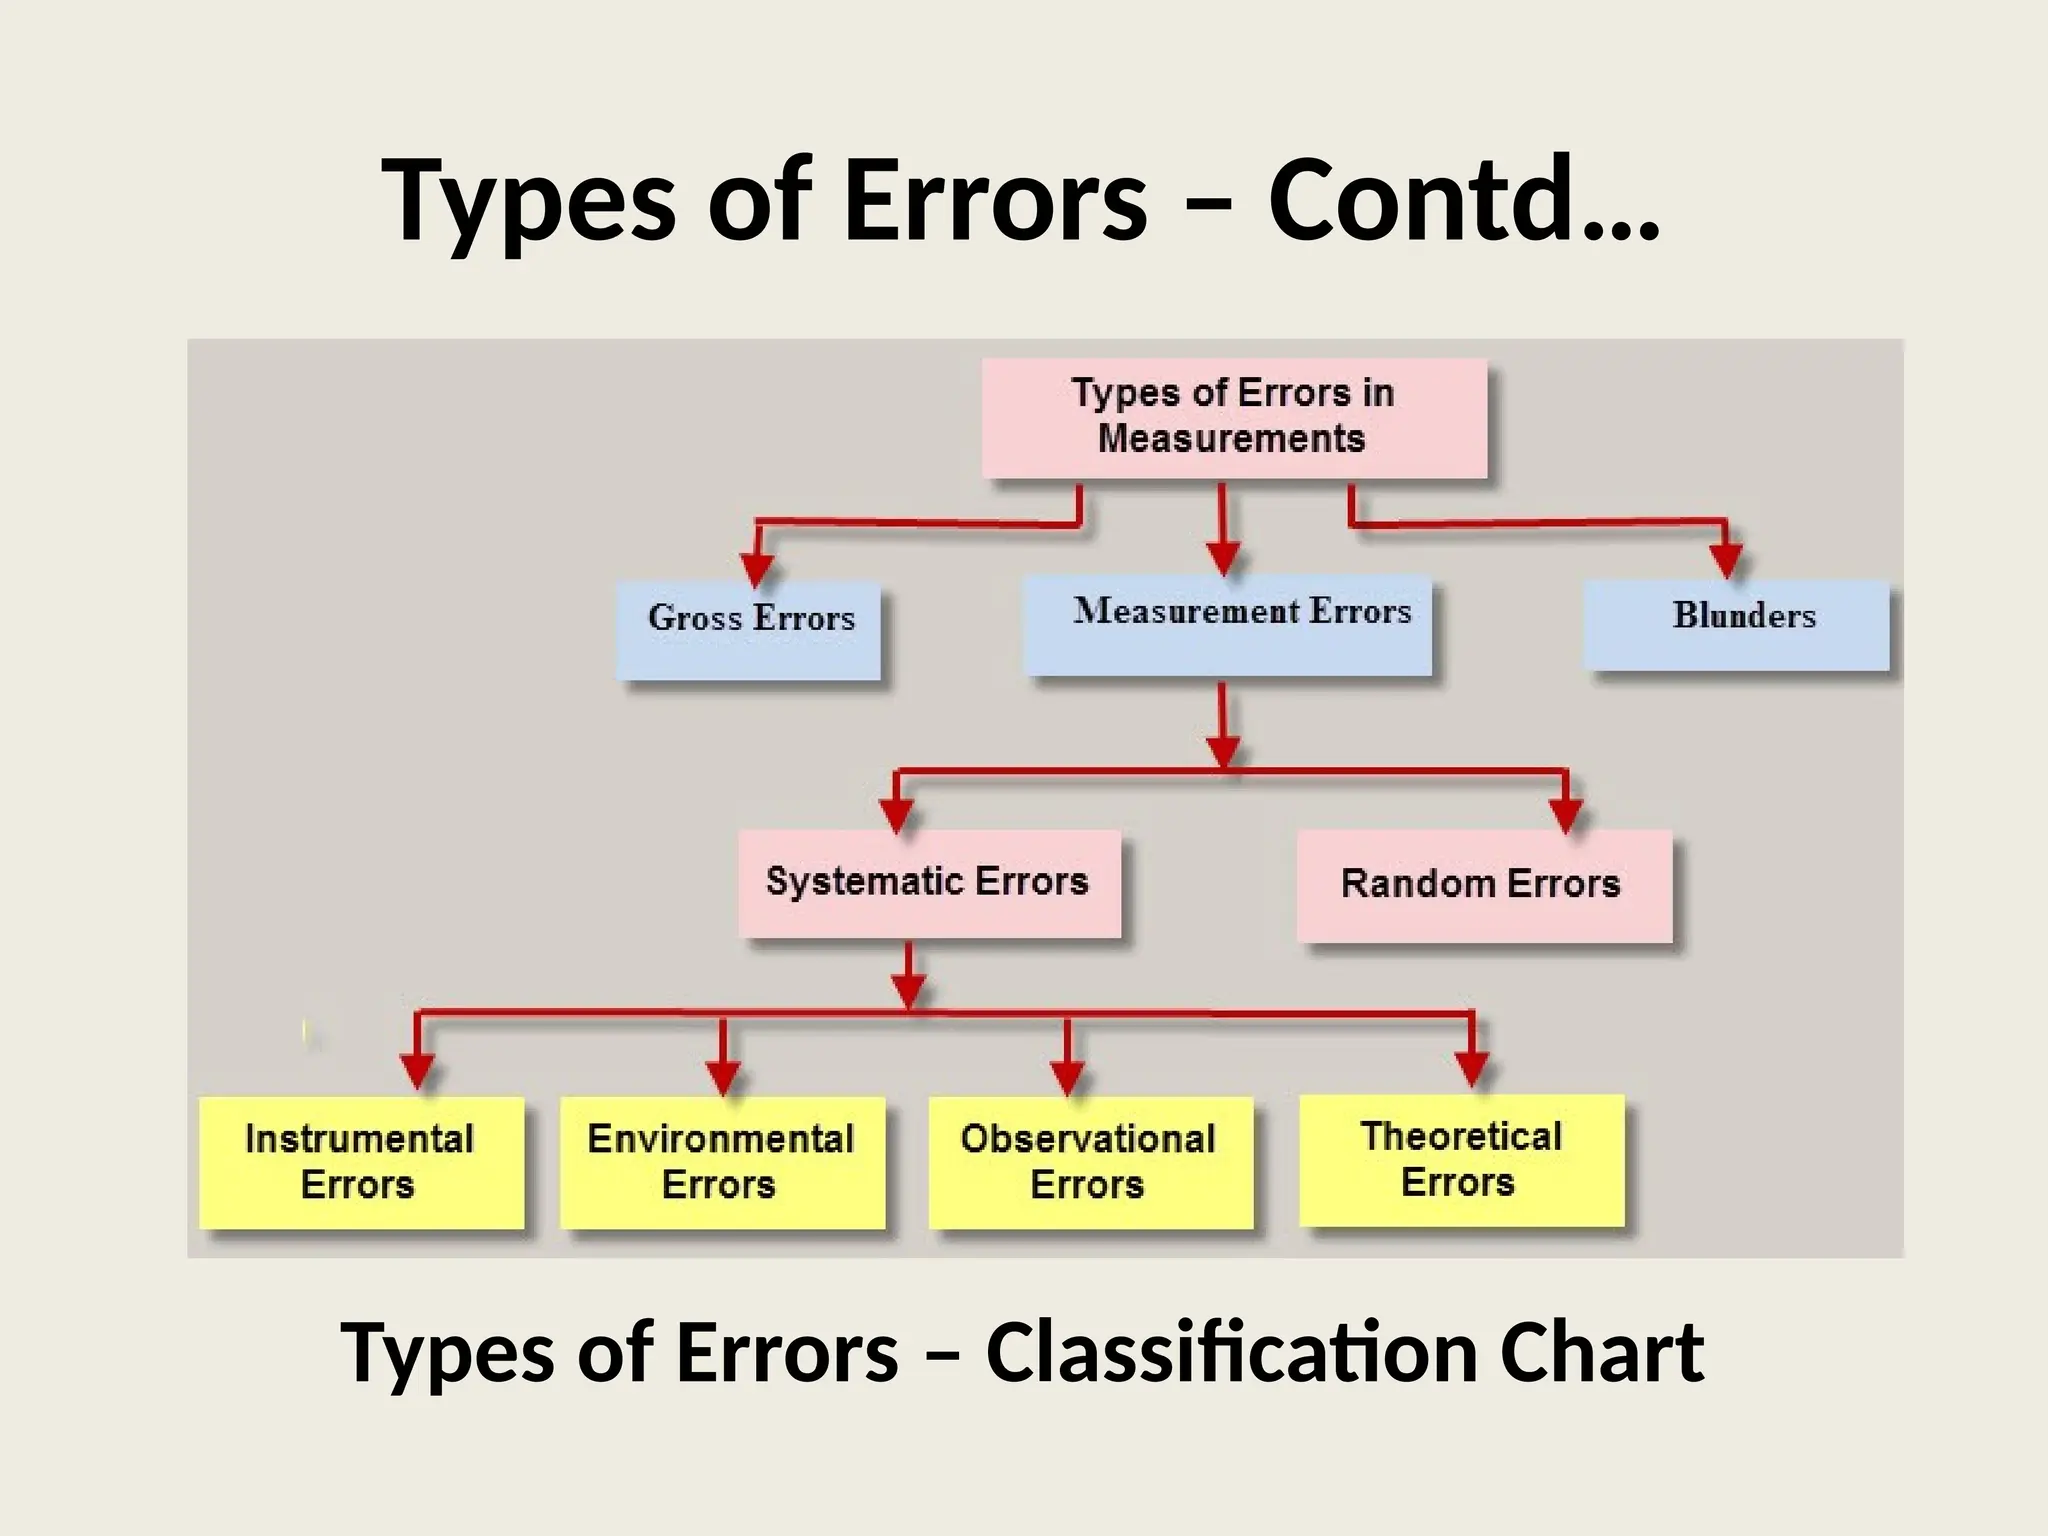
Types of Errors– Contd…
Types of Errors – Classification Chart
66.
Gross Errors
• Errorscaused by mistake while:
– Using instrument meters
– Calculating measurements
• Eg: Calculating using the value 1.01 N/m2
instead of 1.10 N/m2
67.
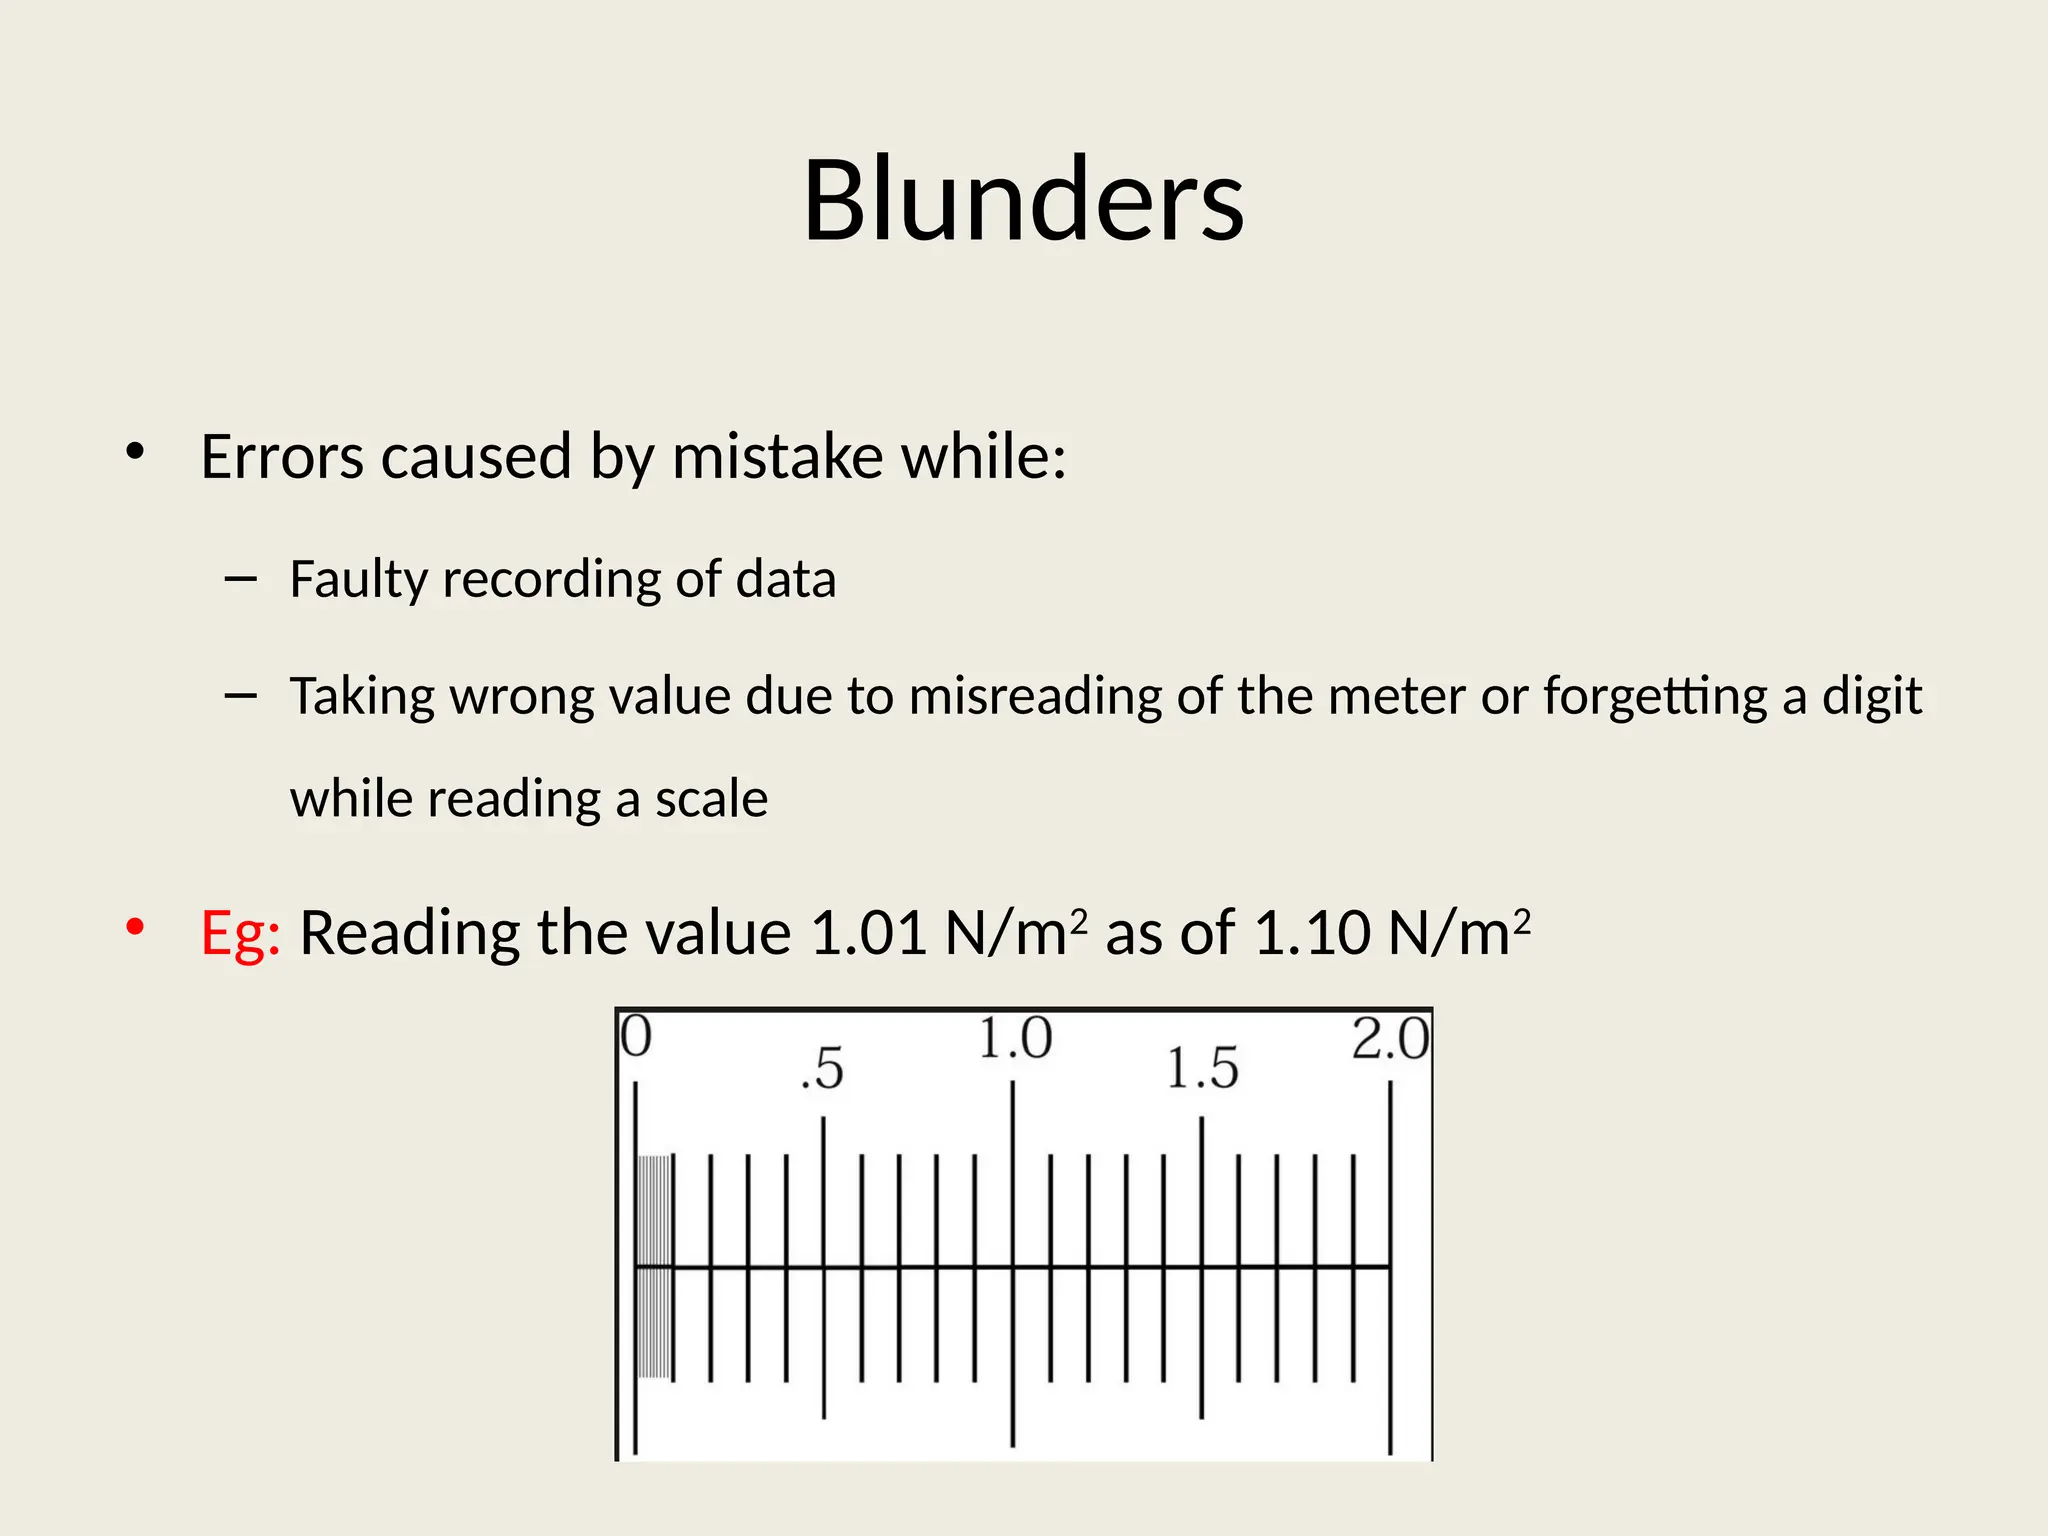
Blunders
• Errors causedby mistake while:
– Faulty recording of data
– Taking wrong value due to misreading of the meter or forgetting a digit
while reading a scale
• Eg: Reading the value 1.01 N/m2
as of 1.10 N/m2
68.
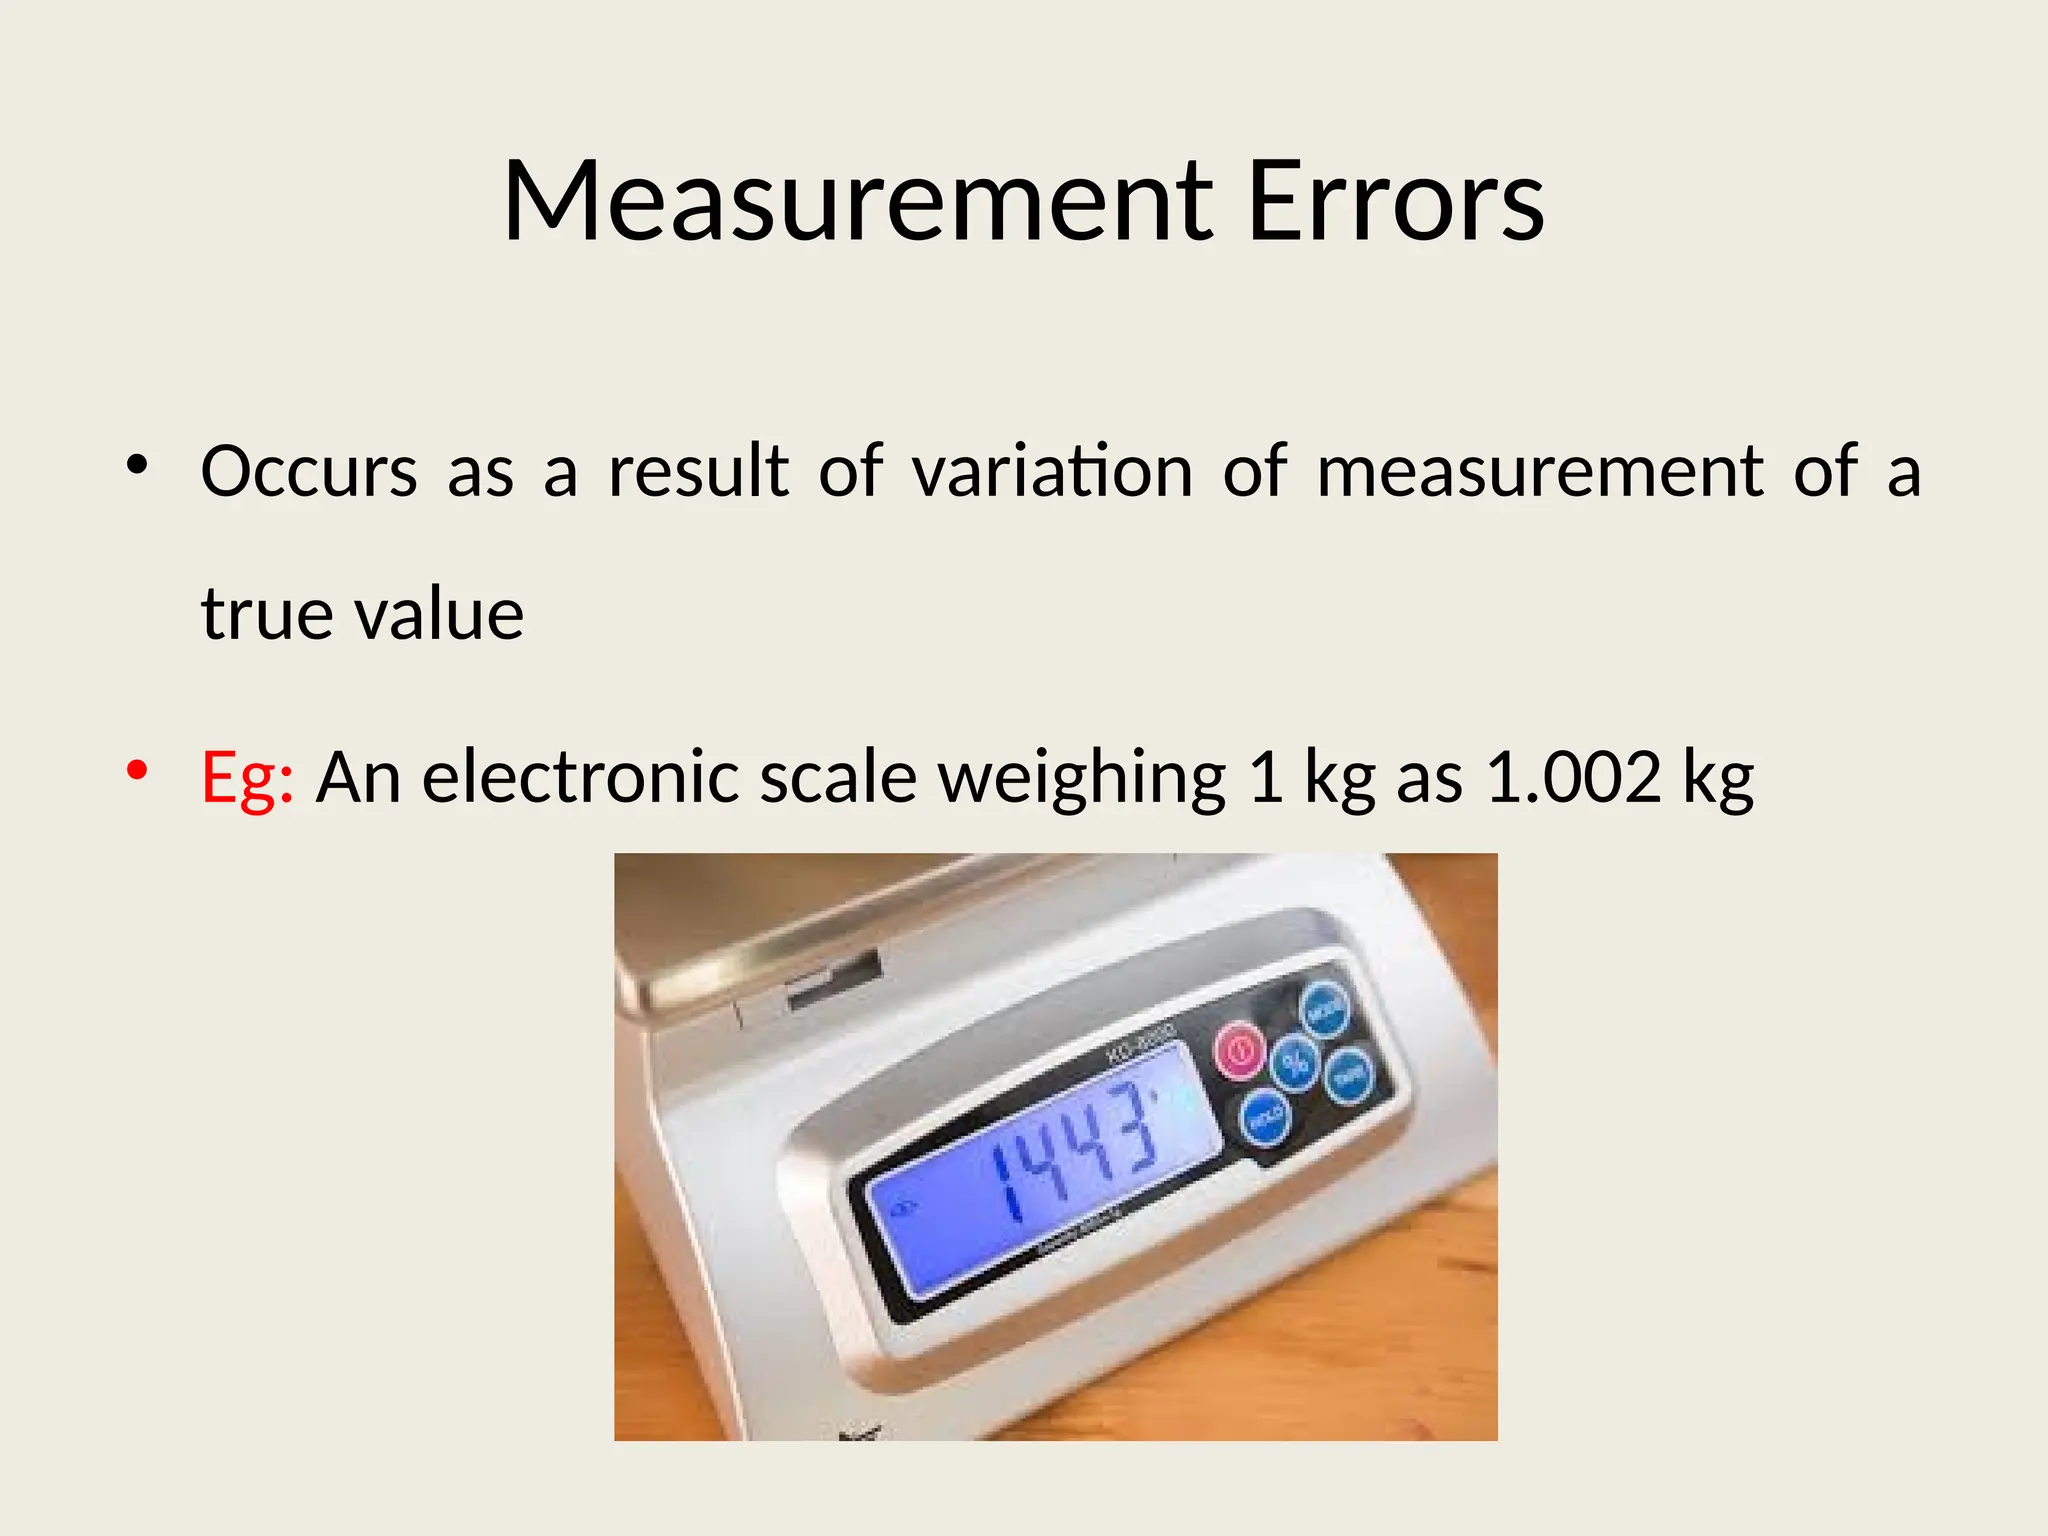
Measurement Errors
• Occursas a result of variation of measurement of a
true value
• Eg: An electronic scale weighing 1 kg as 1.002 kg
69.
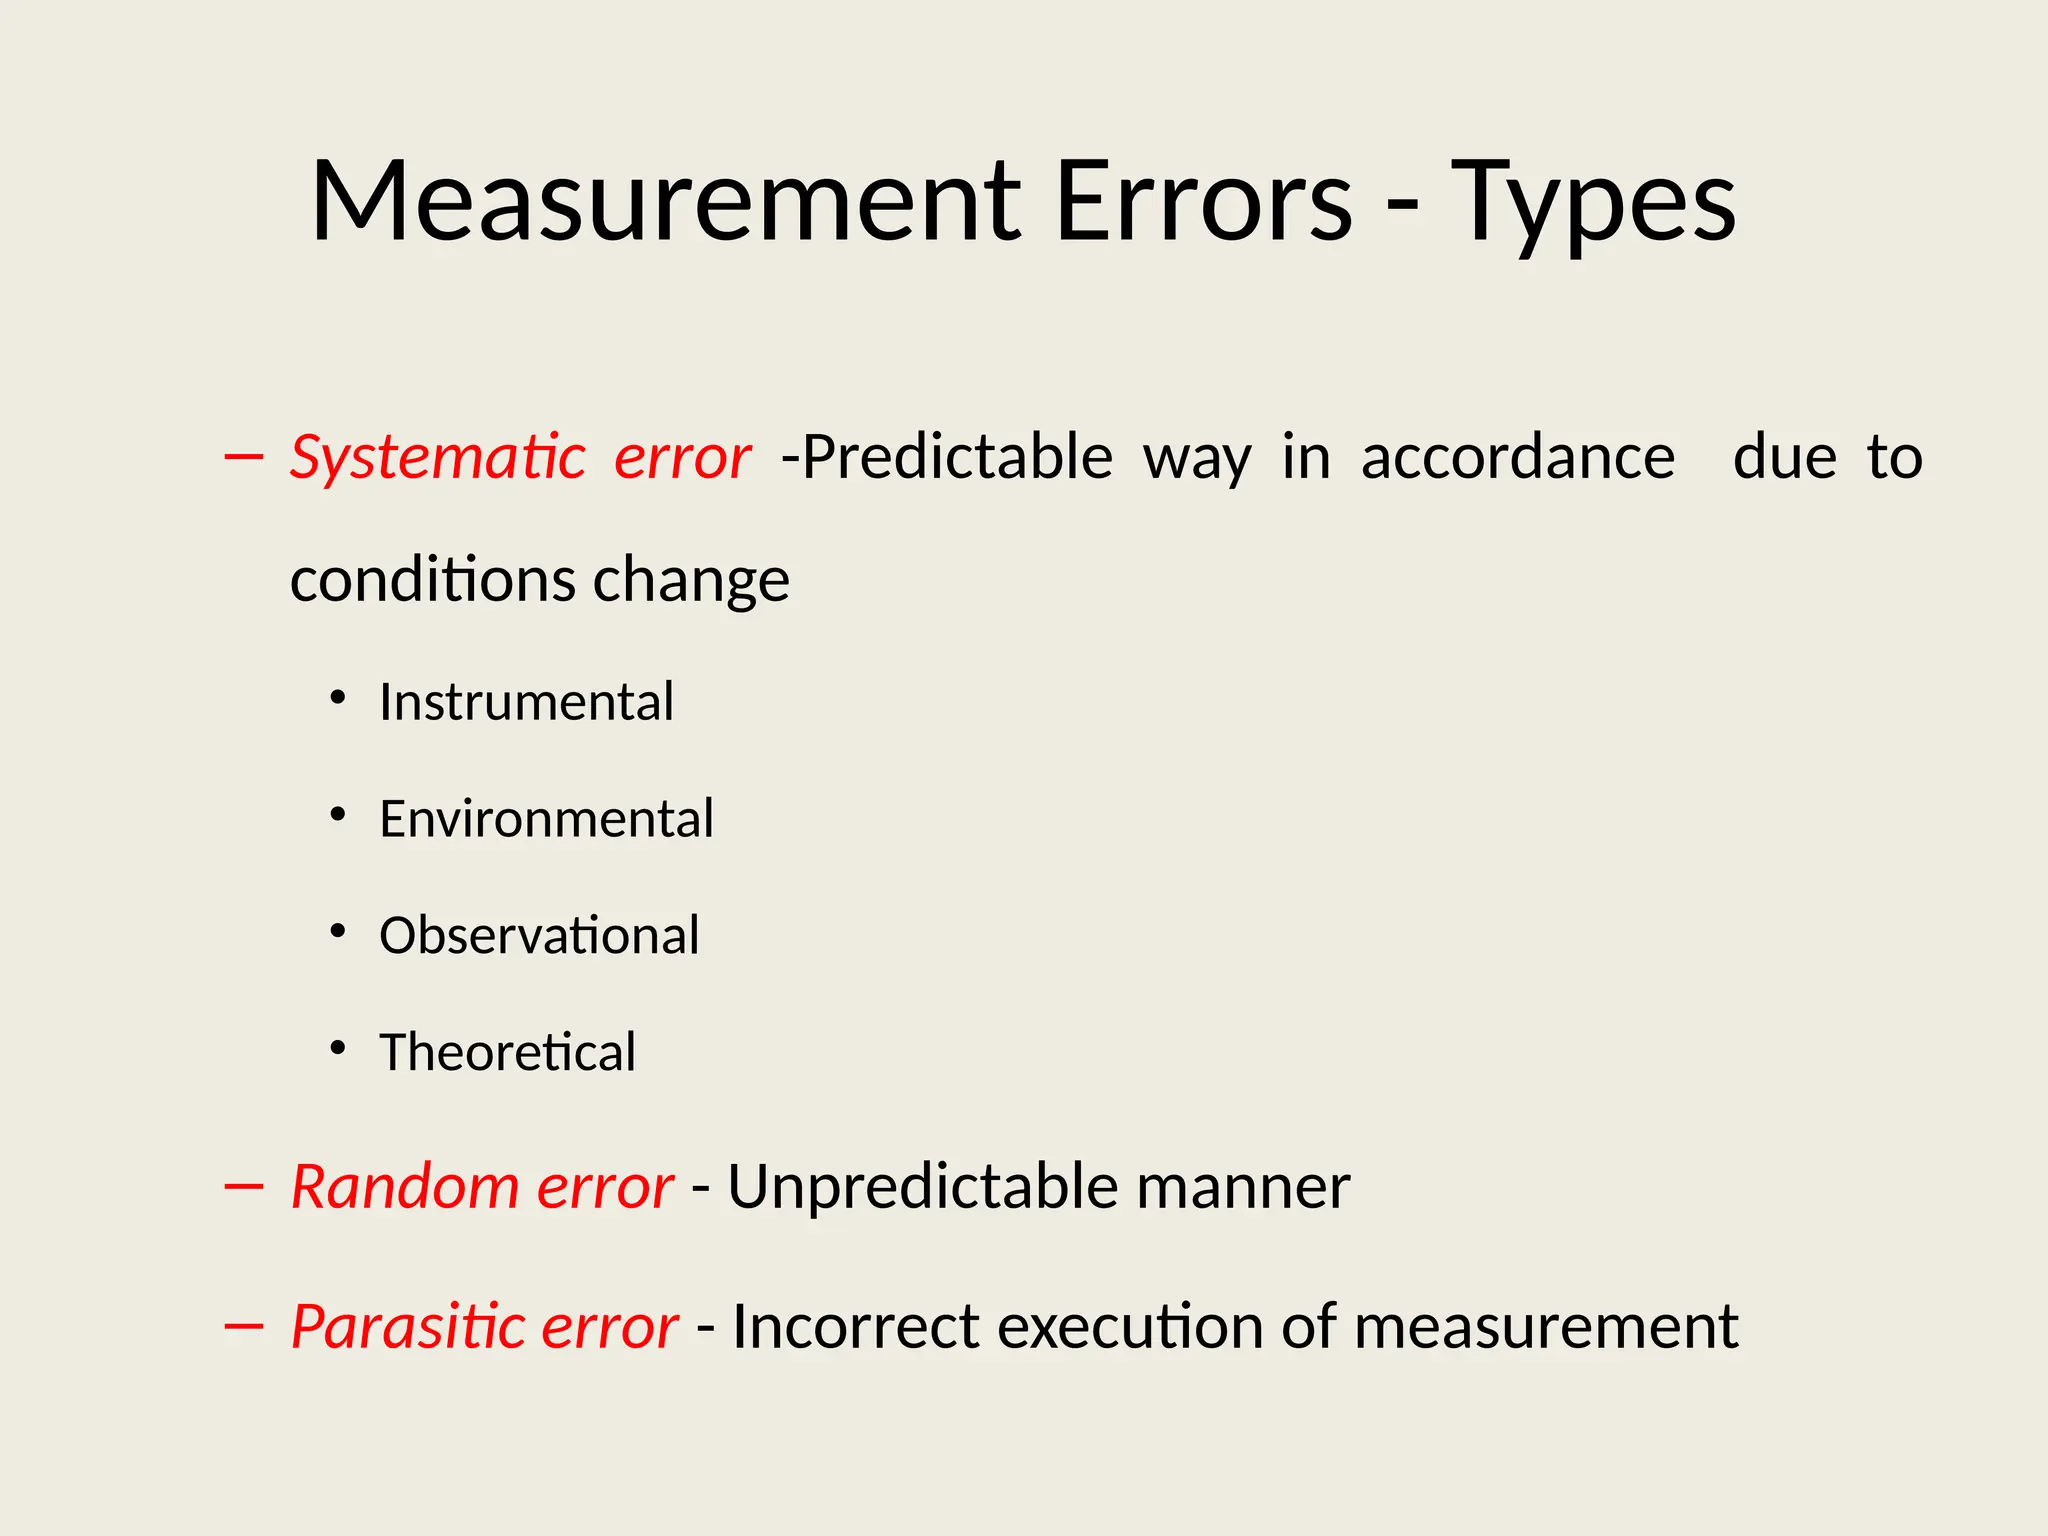
Measurement Errors -Types
– Systematic error -Predictable way in accordance due to
conditions change
• Instrumental
• Environmental
• Observational
• Theoretical
– Random error - Unpredictable manner
– Parasitic error - Incorrect execution of measurement
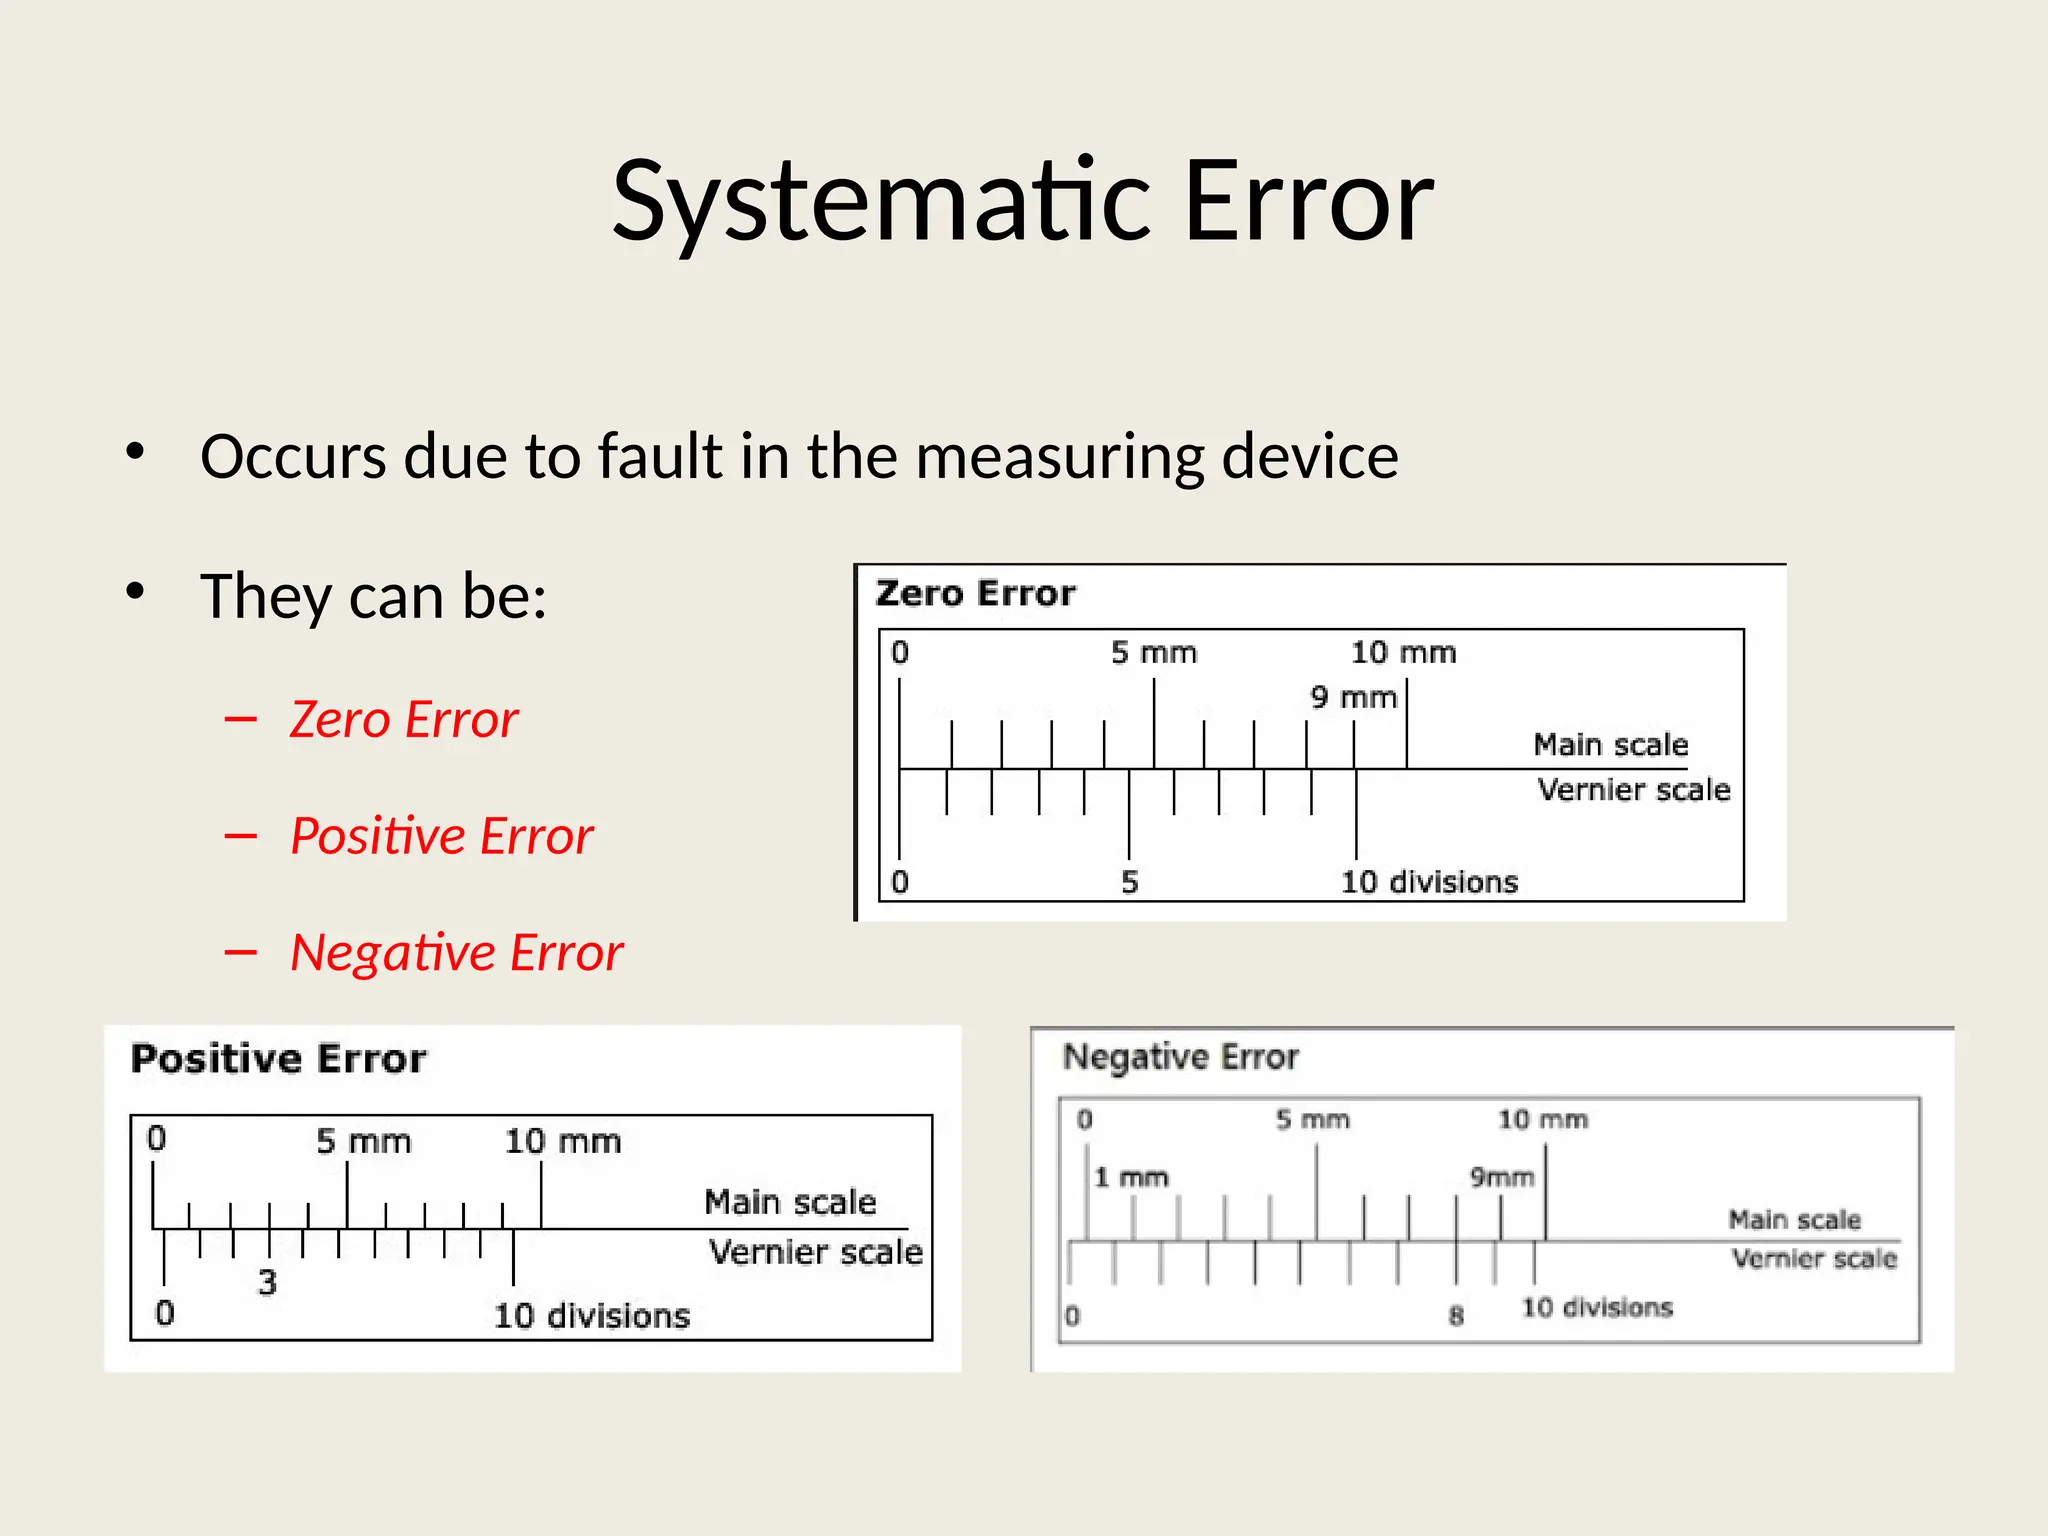
70.
Systematic Error
• Occursdue to fault in the measuring device
• They can be:
– Zero Error
– Positive Error
– Negative Error
71.
Instrumental Error
• Occursdue to Incorrect construction of instrument
– Error of a measuring mechanism
– Error in indication of a measuring instrument
– Effect of loading
– Misuse of instruments
– Error due to friction or hysteresis
• Can be corrected to an extent, but in extreme cases
recalibration or reconstruction of the instrument is needed
72.
Environmental Error
• Occursdue to adverse external environmental conditions
– Pressure
– Temperature
– Humidity
– Magnetic Fields
• Can be corrected by
– Maintaining Temperature & Humidity in the laboratory as a constant
– Ensure NO Electrostatic or Magnetic Fields around the instruments
73.
Observational Errors
• Occursduring observation of the reading from the
instruments due to:
– Reading error
– Parallax error
– Interpolation error
74.
Theoretical Errors
• Occurswhen theoretical considerations are applied practically
while:
– Simplification of the model/instrument theoretically
• Eg: Measuring temperature of a liquid at its surface compared
to mid section or deep section
75.
Correction
• Correction isdefined as a value which is added
algebraically to the uncorrected result of the
measurement to compensate to an assumed
systematic error.
• Eg: Vernier Caliper, Micrometer
75
76.
Calibration
• Calibration isthe process of determining and
adjusting an instruments accuracy to make sure its
accuracy is with in manufacturing specifications.
76
77.
Interchangeability
• A partwhich can be substituted for the component
manufactured to the small shape and dimensions is
known a interchangeable part.
• The operation of substituting the part for similar
manufactured components of the shape and
dimensions is known as interchangeability.
77
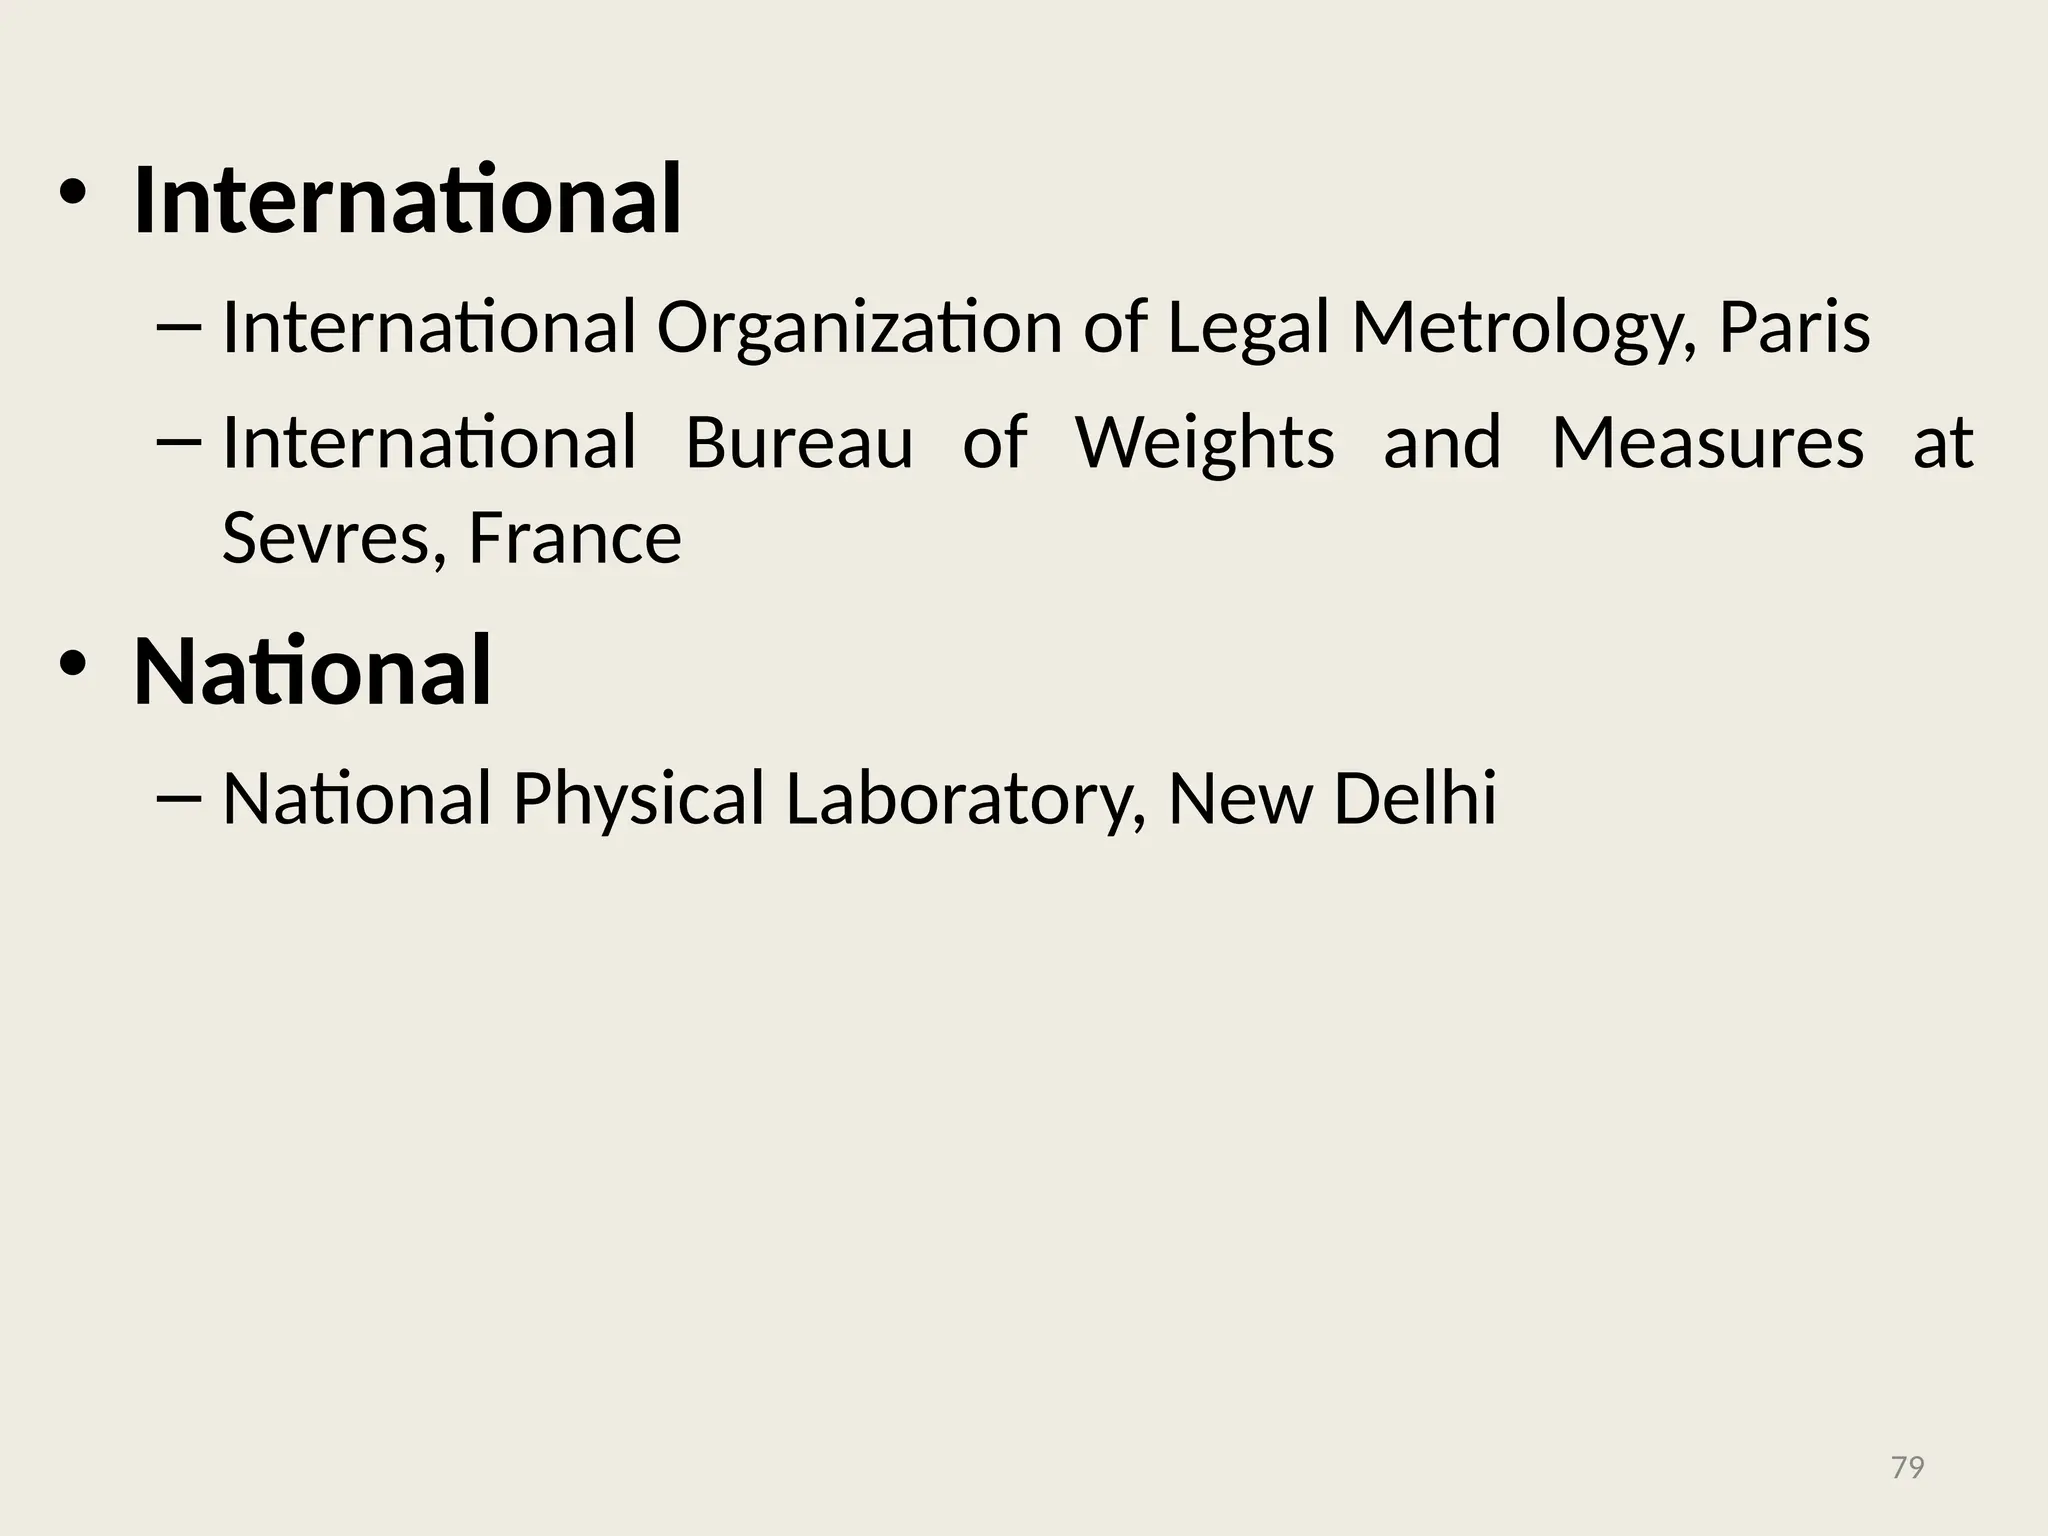
• International
– InternationalOrganization of Legal Metrology, Paris
– International Bureau of Weights and Measures at
Sevres, France
• National
– National Physical Laboratory, New Delhi
79
#26 A galvanometer is a type of ammeter: an instrument for detecting and measuring electric current. It is an analog electromechanical transducer that produces a rotary deflection of some type of pointer in response to electric current flowing through its coil in a magnetic field.