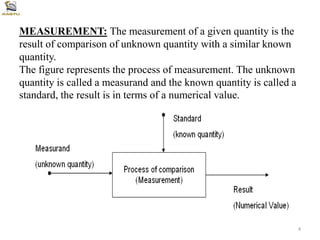
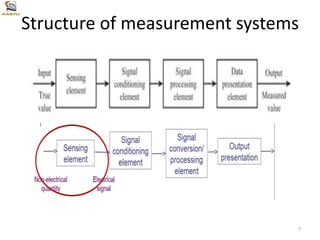
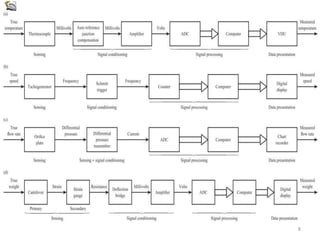
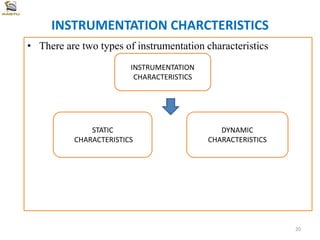
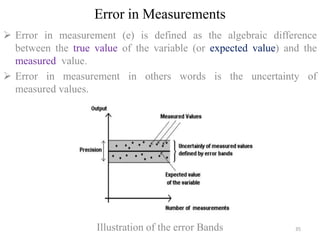
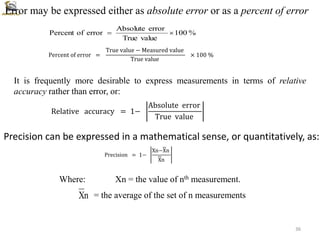
Program Education Objective (PEO)
PEO1: The graduates will become professional engineers.
PEO2: The graduates will establish their own start-up companies.
PEO3: The graduates will be employed in high-ranking companies and universities
locally and internationally.
PEO4: The graduates will be involved in research, design, and development works.
1
CHAPTER 1
General Principles of Measurement
Dept. of Electrical and computer Eng.
AASTU
Instructor:- Biruk T.
2
1.1 Basic Concepts of
Measurement & Instr’n
Discussion on Topics
3
MEASUREMENT: The measurement of a given quantity is the
result of comparison of unknown quantity with a similar known
quantity.
The figure represents the process of measurement. The unknown
quantity is called a measurand and the known quantity is called a
standard, the result is in terms of a numerical value.
4
INSTRUMETATION : Instrumentation is a technology of
measurement.
INSTRUMENT :
• It is a device that transforms a physical variable of
interest (measurand) into a form that is suitable for
recording(measurement)
• It is a device or mechanism used to determine the
present value of the quantity under measurement.
5
 The necessary requirements for any measuring instruments are:
1. The quantity to be measured should not get affected due to the
instrument used.
2. The power consumed by the instruments for their operation
should be as small as possible.
Why Do We Measure?
For process industries and industrial
manufacturing.
To improve the quality of the product
To improve the efficiency of production
To maintain the proper operation.
In order for the measurement to have consistent meaning, it is
necessary to employ a standard system of units.
6
Structure of measurement systems
7
8
Sensing element
• Elements which generate variation of electrical quantities (EQ) in
response to variation of non-electrical quantities (NEQ)
Examples of EQ: - Temperature, displacement, humidity, fluid flow, speed, pressure,…
 Thermocouple where mill volt e.m.f. depends on temperature
 Strain gauge where resistance depends on mechanical strain
 Orifice plate where pressure drop depends on flow rate
Signal conditioning element: more suitable for further
processing, usually a D.C. voltage, D.C. current or frequency signal;
 Deflection Bridge which converts an impedance change into a
voltage change
 Amplifier which amplifies mill volts to volts
 Oscillator which converts an impedance change into a variable
frequency voltage
9
Signal processing element
 Analogue-to-digital converter (ADC) which converts a voltage into
a digital form for input to a computer
 Computer which calculates the measured value of the variable from
the incoming digital data
Data presentation element
 Simple pointer–scale indicator
 Chart recorder
 Seven Segment Display
 Liquid Crystal Display
 Light Emitting Diode Display
10
TYPES OF INSTRUMENTS
1. MECHANICAL INSTRUMENTS : These are very reliable under
static and stable conditions only. But unable to respond under
dynamic and transient conditions. Because these instruments have
moving parts which are rigid, heavy and bulky, and also having
large mass.
Disadvantages:- a) large mass b) produce noise pollution
Ex:- all machines
2. ELECTRICAL INSTRUMENTS : These are more rapid than
mechanical instruments. These instruments take a limited time to
respond as these are having mechanical meter movement.
The respond time is slow i.e. 0.2 sec to 0.5 sec
Ex:- all meters (Voltmeter,Ammeter,Ohmmeter etc.)
3. ELECTRONIC INSTRUMENTS : These instruments give fast
response. Its monitoring time is mille seconds to microseconds. It is
suitable for dynamic condtions.These instruments use
semiconductor devices.
Ex:-CRO
11
CRO displays the voltage
signal as a function of
time on its screen
12
FUNCTIONS OF INSTRUMENTS &
MEASUREMENT SYSTEMS
1. INDICATING FUNCTION: Information is obtained as a
deflection of a pointer of a measuring instrument.
Ex:- The deflection of a pointer in a speedometer.
2. RECORDING FUNCTION: Information is usually obtained
on paper or chart in a written form.
Ex:- Potentiometric type of recorder – records room
temperature
3. CONTROLLING FUNCTION: In this information is
used by the Instrument or the system to control the original
measurand quantity.
13
TYPES OF INSTRUMENTAION SYSTEMS
Dumb Instrumentation System
• In this system, after
measurement , the data is
processed by the observer
.
Intelligent Instrumentation System
• In this system , after
measurement, the data is
processed by intelligent
instruments like
microprocessors/digital
computers.
14
15
SI Units (International Systems of Unites): The most widely used
s/m of measurement.
Two different units are defined:
- Fundamental Units
- Derived Units
STANDARDS
• Standards: are fundamental reference for a system of measures.
• A known accurate measure of a physical quantity is termed as a
standard.
• Standards are used to determine the values of other physical
quantities by the comparison methods.
There are different standards
1. International standards
2. Primary standards
3. Secondary standards
4. Working standards
16
17
Examples of Standard Bodies
 International Organization for Standardization (ISO)
 International Electrotechnical Commission (IEC)
 American National Standards Institute (ANSI)
 Standards Council of Canada ( SCC)
 British Standards (BS)
 Institute of Turkish Standards (TSE)
International Standards
• Defined by international agreement
• Maintained by IOS – International organization for standards,
Paris – France
• Periodically evaluated and checked by absolute measurements
in terms of fundamental units of Physics.
Primary standards
• Function : calibration and verification of secondary standards.
• Maintained at National Standards Laboratories in different
countries
18
Secondary Standards
• Reference standards used by measurement and calibration
laboratories in industries.
• Maintained by particular industries
• Periodically calibrated and compared against Primary standards
Working standards
• Principal tools of a measurement laboratory
• Check and calibrate laboratory instrument for accuracy and
performance
19
INSTRUMENTATION CHARCTERISTICS
• There are two types of instrumentation characteristics
INSTRUMENTATION
CHARACTERISTICS
STATIC
CHARACTERISTICS
DYNAMIC
CHARACTERISTICS
20
STATIC AND DYNAMIC CHARACTERISTICS
Some applications involve the measurement of quantities that
are either Constants or varies slowly with time .These criteria
arecalledStaticcharacteristics.
 Some measurements are concerned with rapidly varying
quantities and therefore performance criteria based upon
dynamicrelationsconstitutetheDynamiccharacteristics.
21
STATIC CHARACTERISTICS
 Accuracy
 Precision
 Repeatability
 Sensitivity
 Linearity
 Hysteresis
 Resolution
 Range/Span
 Threshold
 Dead zone
22
Accuracy
• It is the closeness of the instrument output to the true value of the measured quantity.
• It is also defined as the percentage deviation of measurement from the true value.
• Percentage of true value = measured value – true value x 100
true value
• Percentage of full-scale deflection = measured value – true value x 100
maximum scale value
Precision
Precision is a term that describes an instrument’s degree of freedom from random errors.
• It is defined as the ability of the instrument to reproduce a certain set of readings
within a given accuracy.
• A highly precision instrument is one that gives a same o/p information, for a given i/p
information when the reading is repeated for large number of times.
• Precision in fact depends on Repeatability
R e p e a t a b i l i t y : I t is defined as the ability of the instrument to reproduce a group of
measurements of the same measured quantity , made by the same observer, using same
instrument, under the same conditions.
23
24
Sensitivity
Sensitivity: The sensitivity of an instrument or an instrumentation system is
the ratio of the change in the magnitude of the output quantity to the
magnitude of input quantity .
– Its units are millimeter per micro ampere , counts per volt etc .,
depending upon the type of input and output
– Deflection factor or inverse sensitivity is defined as the ratio of
magnitude of the input to the magnitude of the output
Static sensitivity = Infinitesimal change in output
Infinitesimal change in input
Δ q0
= --------------
Δ qi
• Deflection factor/Inverse sensitivity = Δ qi / Δ q0
25
HYSTERESIS
The non-coincidence between loading and unloading curves is known as
hysteresis.
• It is a phenomenon which depicts different output effects when loading and
unloading whether it is a mechanical system or an electrical system and for that
matter any system.
26
LINEARITY & NON-LINEARITY
• Linearity : it is normally desirable that the o/p reading of an
instrument is linearly proportional to the quantity being measured.
• Non–Linearity : it is defined as the maximum deviation of any of the
o/p reading from this straight line. N(I)= O(I) – (KI+a), O(I) = KI + a + N(I)
• Non-Linearity(%fsd) = max. deviation of the o/p from the straight line X100
actual reading or output span
27
• Dead zone: It is defined as the largest change of input quantity for which
there is no output of the instrument.
• Dead time: it is defined as the time required by the measurement system
to begin to respond to a change in the measured.
DEAD ZONE & DEAD TIME
28
Resolution or discrimination: It is defined as the smallest
increment in input which can be detected with certainty by an
instrument is its resolution.
The discrimination of an instrument is the amount of change
of a reference value that an instrument can detect and faithfully
indicate. This is also known as readability and resolution.
Threshold: It is defined as the minimum value below which no
output change can be detected is called as threshold of the
instrument
Note: Resolution defines the smallest measurable input Change while
thethresholddefinessmallest measurable Input
• RANGE/SPAN : It defines the minimum and maximum
values of a quantity that the instrument is designed to
measure
29
Problem 1
A Wheatstone bridge requires a change of 7 ohms in the unknown
arm of the bridge to produce a change in deflection of 3mm of
the galvanometer. Determine the sensitivity and also the
deflection factor?
Sol. Sensitivity = 3mm/7 Ω = 0.429 mm/ Ω
Deflection factor = 7 Ω/3mm = 2.33 Ω/mm
Problem 2
• The dead zone in a certain pyrometer is 0.125% of span. The
calibration is 4000 C to 10000 C .What temperature change
might occur before it is detected?
Sol. Span = 10000 - 4000 = 6000 C
Dead zone = (0125/100) x 6000C = 0.75oC
Hence a change of 0.75oC must occur before it is detected.
30
Problem 3
• A moving coil ammeter has a uniform scale with 50 divisions
and gives full scale reading of 5A.The instrument can read
upto (¼)th of a scale division with a fair degree of certainty?
Determine the resolution of the instrument in mA.
Sol. Full scale reading = 5A
Number of divisions on scale = 50
1 scale division = (5/50) = 0.1A
Resolution = (1/4) of a scale division = (1/4)x0.1 = 0.025A
or 25mA
31
Problem 4
32
DYNAMIC CHARACTERISTICS
1. Speed of response
2. Fidelity
3. Dynamic error
4. Measuring lag
Speed of response: It is defined as the rapidity
with which a measurement system responds
to changes in the measured quantity
33
Fidelity: It is defined as the degree to which a measurement
system indicates changes in the measured quantity
without dynamic error.
Dynamic Error/Measurement Error: It is the difference between
the true value of the quantity (under measurement) changing
with time and the value indicated by the measurement
system if no static error is assumed.
Measuring lag : It is the retardation or delay in the response of a
measurement system to changes in the measured quantity.
34
Error in Measurements
 Error in measurement (e) is defined as the algebraic difference
between the true value of the variable (or expected value) and the
measured value.
 Error in measurement in others words is the uncertainty of
measured values.
Illustration of the error Bands 35
%
100
value
True
error
Absolute
error
of
Percent 

Percent of error =
True value − Measured value
True value
× 100 %
Relative accuracy = 1−
Absolute error
True value
Error may be expressed either as absolute error or as a percent of error
It is frequently more desirable to express measurements in terms of relative
accuracy rather than error, or:
Precision = 1−
Xn−Xn
Xn
n
X
Precision can be expressed in a mathematical sense, or quantitatively, as:
Where: Xn = the value of nth measurement.
= the average of the set of n measurements
36
Types of Error
1. Gross error: These errors are generally human errors using the
instruments such as:
 misreading instrument
 incorrect adjustment
 improper application of instrument
 computation errors
2. Systematic errors: due to short comings of the instrument and changes
in external conditions affecting the measurement..
 Instruments errors: errors due to changes in the proprieties of the
components used in instrument such as:
 friction in the bearing of the meter movement
 incorrect spring tension
 improper calibration faulty instruments
Instruments errors can be reduced by proper maintenance, use, and
handling of instruments. 37
 Environmental errors: Subjecting instruments to harsh
environment such as:
 high temperatures
 pressure, or humidity
 strong electrostatic
 electromagnetic fields
 Observational errors: errors introduced by the observer.
Probably the most common observational errors are the parallax
error introduced in reading a meter scale and the error of estimation
when obtaining a reading from a meter scale
3. Random errors: Random errors are generally the accumulation of
a large number of small effects and may be of real concern only in
measurements requiring a high degree of accuracy. Such errors can
only be analyzed statistically.
38
Nosie and Interference
• under real time conditions the performance of the
measuring elements are influenced by undesirable
environmental effects (temperature, pressure, humidity, etc)
• besides the measurement is significantly affected by the
general random behavior of system such as;
 random variation in the input (Signal)
 random variation in the system (white noise)
 deterministic disturbances in the system (interference Power
frequency interference)
 switching circuit (sparking)
 RF generating circuit (inductor).
39
Ways of Reducing the Effects of Noise and Interference
 Shielding (isolation):this is usually done either by isolating the
instrument from these environmental effects or shielding the
instrument with specially fabricated material having the property
of isolating the instrument from any interfering or modifying input.
 Environmental insensitivity: another important technique is making
the instrument to be insensitive to any modifying or interfering input
(i.e. Km = 0, Ki = 0)
 Methods of opposing input: this is one of the most commonly applied
technique in which instruments make use a technique or means to
cancel the effects of undesired signals
 Filtering: filtering is a technique applied to signals so as to pass or
reject frequency of desire.
40
• Modulation: modulation can be thought of as a technique used
change the frequency content of the original signal so to transmit
or reduce the effect of undesired inputs.
• Averaging : As noise signals are unpredictable averaging
them may reduce the magnitude
• Correlation: A method used to detect the presence of any
periodic signal buried in random noise. It is used to obtain the
relation of the signal and its time shifted signal.
41
FACTORS TO SELECT INSTRUMENTS
1. Performance Requirements
 Range /Span
 Speed
 Power consumption
 Efficiency
 Size & Weight
 Test levels (Electromagnetic Interference, Vibration & Shock)
2. Sensitivity : It must be sensitive enough to produce detectable o/p.
3. Accuracy: Instrument should have high degree of accuracy
4. Errors : The instrument should maintain the expected input-output
relation ship as described by its transfer function so as to avoid errors
42
5. Electrical Aspects : Length & type of cable required for instruments,
6. Loading Effects: Instrument should have high input impedance and low
output impedance to avoid loading effect.
7. Static Characteristics:
• Low non-linearity
• Low hysteresis
• High resolution
• High degree of repeatability
8. Insensitivity to unwanted signals: The instrument should be minimally
sensitive to unwanted signals and highly sensitive to desired signals
9. Transient & Frequency response : The instrument should meet the time-
domain specifications like rise time ,settling time, small dynamic error.
It should have flat frequency response curve and should have wide
bandwidth.
10. Stability & Reliability : The instrument should have a high degree of
stability to be operative during its operation and storage life.
43

CHAPTER 1.pptx

  • 1.
    Program Education Objective(PEO) PEO1: The graduates will become professional engineers. PEO2: The graduates will establish their own start-up companies. PEO3: The graduates will be employed in high-ranking companies and universities locally and internationally. PEO4: The graduates will be involved in research, design, and development works. 1
  • 2.
    CHAPTER 1 General Principlesof Measurement Dept. of Electrical and computer Eng. AASTU Instructor:- Biruk T. 2
  • 3.
    1.1 Basic Conceptsof Measurement & Instr’n Discussion on Topics 3
  • 4.
    MEASUREMENT: The measurementof a given quantity is the result of comparison of unknown quantity with a similar known quantity. The figure represents the process of measurement. The unknown quantity is called a measurand and the known quantity is called a standard, the result is in terms of a numerical value. 4
  • 5.
    INSTRUMETATION : Instrumentationis a technology of measurement. INSTRUMENT : • It is a device that transforms a physical variable of interest (measurand) into a form that is suitable for recording(measurement) • It is a device or mechanism used to determine the present value of the quantity under measurement. 5
  • 6.
     The necessaryrequirements for any measuring instruments are: 1. The quantity to be measured should not get affected due to the instrument used. 2. The power consumed by the instruments for their operation should be as small as possible. Why Do We Measure? For process industries and industrial manufacturing. To improve the quality of the product To improve the efficiency of production To maintain the proper operation. In order for the measurement to have consistent meaning, it is necessary to employ a standard system of units. 6
  • 7.
  • 8.
  • 9.
    Sensing element • Elementswhich generate variation of electrical quantities (EQ) in response to variation of non-electrical quantities (NEQ) Examples of EQ: - Temperature, displacement, humidity, fluid flow, speed, pressure,…  Thermocouple where mill volt e.m.f. depends on temperature  Strain gauge where resistance depends on mechanical strain  Orifice plate where pressure drop depends on flow rate Signal conditioning element: more suitable for further processing, usually a D.C. voltage, D.C. current or frequency signal;  Deflection Bridge which converts an impedance change into a voltage change  Amplifier which amplifies mill volts to volts  Oscillator which converts an impedance change into a variable frequency voltage 9
  • 10.
    Signal processing element Analogue-to-digital converter (ADC) which converts a voltage into a digital form for input to a computer  Computer which calculates the measured value of the variable from the incoming digital data Data presentation element  Simple pointer–scale indicator  Chart recorder  Seven Segment Display  Liquid Crystal Display  Light Emitting Diode Display 10
  • 11.
    TYPES OF INSTRUMENTS 1.MECHANICAL INSTRUMENTS : These are very reliable under static and stable conditions only. But unable to respond under dynamic and transient conditions. Because these instruments have moving parts which are rigid, heavy and bulky, and also having large mass. Disadvantages:- a) large mass b) produce noise pollution Ex:- all machines 2. ELECTRICAL INSTRUMENTS : These are more rapid than mechanical instruments. These instruments take a limited time to respond as these are having mechanical meter movement. The respond time is slow i.e. 0.2 sec to 0.5 sec Ex:- all meters (Voltmeter,Ammeter,Ohmmeter etc.) 3. ELECTRONIC INSTRUMENTS : These instruments give fast response. Its monitoring time is mille seconds to microseconds. It is suitable for dynamic condtions.These instruments use semiconductor devices. Ex:-CRO 11
  • 12.
    CRO displays thevoltage signal as a function of time on its screen 12
  • 13.
    FUNCTIONS OF INSTRUMENTS& MEASUREMENT SYSTEMS 1. INDICATING FUNCTION: Information is obtained as a deflection of a pointer of a measuring instrument. Ex:- The deflection of a pointer in a speedometer. 2. RECORDING FUNCTION: Information is usually obtained on paper or chart in a written form. Ex:- Potentiometric type of recorder – records room temperature 3. CONTROLLING FUNCTION: In this information is used by the Instrument or the system to control the original measurand quantity. 13
  • 14.
    TYPES OF INSTRUMENTAIONSYSTEMS Dumb Instrumentation System • In this system, after measurement , the data is processed by the observer . Intelligent Instrumentation System • In this system , after measurement, the data is processed by intelligent instruments like microprocessors/digital computers. 14
  • 15.
    15 SI Units (InternationalSystems of Unites): The most widely used s/m of measurement. Two different units are defined: - Fundamental Units - Derived Units
  • 16.
    STANDARDS • Standards: arefundamental reference for a system of measures. • A known accurate measure of a physical quantity is termed as a standard. • Standards are used to determine the values of other physical quantities by the comparison methods. There are different standards 1. International standards 2. Primary standards 3. Secondary standards 4. Working standards 16
  • 17.
    17 Examples of StandardBodies  International Organization for Standardization (ISO)  International Electrotechnical Commission (IEC)  American National Standards Institute (ANSI)  Standards Council of Canada ( SCC)  British Standards (BS)  Institute of Turkish Standards (TSE)
  • 18.
    International Standards • Definedby international agreement • Maintained by IOS – International organization for standards, Paris – France • Periodically evaluated and checked by absolute measurements in terms of fundamental units of Physics. Primary standards • Function : calibration and verification of secondary standards. • Maintained at National Standards Laboratories in different countries 18
  • 19.
    Secondary Standards • Referencestandards used by measurement and calibration laboratories in industries. • Maintained by particular industries • Periodically calibrated and compared against Primary standards Working standards • Principal tools of a measurement laboratory • Check and calibrate laboratory instrument for accuracy and performance 19
  • 20.
    INSTRUMENTATION CHARCTERISTICS • Thereare two types of instrumentation characteristics INSTRUMENTATION CHARACTERISTICS STATIC CHARACTERISTICS DYNAMIC CHARACTERISTICS 20
  • 21.
    STATIC AND DYNAMICCHARACTERISTICS Some applications involve the measurement of quantities that are either Constants or varies slowly with time .These criteria arecalledStaticcharacteristics.  Some measurements are concerned with rapidly varying quantities and therefore performance criteria based upon dynamicrelationsconstitutetheDynamiccharacteristics. 21
  • 22.
    STATIC CHARACTERISTICS  Accuracy Precision  Repeatability  Sensitivity  Linearity  Hysteresis  Resolution  Range/Span  Threshold  Dead zone 22
  • 23.
    Accuracy • It isthe closeness of the instrument output to the true value of the measured quantity. • It is also defined as the percentage deviation of measurement from the true value. • Percentage of true value = measured value – true value x 100 true value • Percentage of full-scale deflection = measured value – true value x 100 maximum scale value Precision Precision is a term that describes an instrument’s degree of freedom from random errors. • It is defined as the ability of the instrument to reproduce a certain set of readings within a given accuracy. • A highly precision instrument is one that gives a same o/p information, for a given i/p information when the reading is repeated for large number of times. • Precision in fact depends on Repeatability R e p e a t a b i l i t y : I t is defined as the ability of the instrument to reproduce a group of measurements of the same measured quantity , made by the same observer, using same instrument, under the same conditions. 23
  • 24.
  • 25.
    Sensitivity Sensitivity: The sensitivityof an instrument or an instrumentation system is the ratio of the change in the magnitude of the output quantity to the magnitude of input quantity . – Its units are millimeter per micro ampere , counts per volt etc ., depending upon the type of input and output – Deflection factor or inverse sensitivity is defined as the ratio of magnitude of the input to the magnitude of the output Static sensitivity = Infinitesimal change in output Infinitesimal change in input Δ q0 = -------------- Δ qi • Deflection factor/Inverse sensitivity = Δ qi / Δ q0 25
  • 26.
    HYSTERESIS The non-coincidence betweenloading and unloading curves is known as hysteresis. • It is a phenomenon which depicts different output effects when loading and unloading whether it is a mechanical system or an electrical system and for that matter any system. 26
  • 27.
    LINEARITY & NON-LINEARITY •Linearity : it is normally desirable that the o/p reading of an instrument is linearly proportional to the quantity being measured. • Non–Linearity : it is defined as the maximum deviation of any of the o/p reading from this straight line. N(I)= O(I) – (KI+a), O(I) = KI + a + N(I) • Non-Linearity(%fsd) = max. deviation of the o/p from the straight line X100 actual reading or output span 27
  • 28.
    • Dead zone:It is defined as the largest change of input quantity for which there is no output of the instrument. • Dead time: it is defined as the time required by the measurement system to begin to respond to a change in the measured. DEAD ZONE & DEAD TIME 28
  • 29.
    Resolution or discrimination:It is defined as the smallest increment in input which can be detected with certainty by an instrument is its resolution. The discrimination of an instrument is the amount of change of a reference value that an instrument can detect and faithfully indicate. This is also known as readability and resolution. Threshold: It is defined as the minimum value below which no output change can be detected is called as threshold of the instrument Note: Resolution defines the smallest measurable input Change while thethresholddefinessmallest measurable Input • RANGE/SPAN : It defines the minimum and maximum values of a quantity that the instrument is designed to measure 29
  • 30.
    Problem 1 A Wheatstonebridge requires a change of 7 ohms in the unknown arm of the bridge to produce a change in deflection of 3mm of the galvanometer. Determine the sensitivity and also the deflection factor? Sol. Sensitivity = 3mm/7 Ω = 0.429 mm/ Ω Deflection factor = 7 Ω/3mm = 2.33 Ω/mm Problem 2 • The dead zone in a certain pyrometer is 0.125% of span. The calibration is 4000 C to 10000 C .What temperature change might occur before it is detected? Sol. Span = 10000 - 4000 = 6000 C Dead zone = (0125/100) x 6000C = 0.75oC Hence a change of 0.75oC must occur before it is detected. 30
  • 31.
    Problem 3 • Amoving coil ammeter has a uniform scale with 50 divisions and gives full scale reading of 5A.The instrument can read upto (¼)th of a scale division with a fair degree of certainty? Determine the resolution of the instrument in mA. Sol. Full scale reading = 5A Number of divisions on scale = 50 1 scale division = (5/50) = 0.1A Resolution = (1/4) of a scale division = (1/4)x0.1 = 0.025A or 25mA 31
  • 32.
  • 33.
    DYNAMIC CHARACTERISTICS 1. Speedof response 2. Fidelity 3. Dynamic error 4. Measuring lag Speed of response: It is defined as the rapidity with which a measurement system responds to changes in the measured quantity 33
  • 34.
    Fidelity: It isdefined as the degree to which a measurement system indicates changes in the measured quantity without dynamic error. Dynamic Error/Measurement Error: It is the difference between the true value of the quantity (under measurement) changing with time and the value indicated by the measurement system if no static error is assumed. Measuring lag : It is the retardation or delay in the response of a measurement system to changes in the measured quantity. 34
  • 35.
    Error in Measurements Error in measurement (e) is defined as the algebraic difference between the true value of the variable (or expected value) and the measured value.  Error in measurement in others words is the uncertainty of measured values. Illustration of the error Bands 35
  • 36.
    % 100 value True error Absolute error of Percent   Percent oferror = True value − Measured value True value × 100 % Relative accuracy = 1− Absolute error True value Error may be expressed either as absolute error or as a percent of error It is frequently more desirable to express measurements in terms of relative accuracy rather than error, or: Precision = 1− Xn−Xn Xn n X Precision can be expressed in a mathematical sense, or quantitatively, as: Where: Xn = the value of nth measurement. = the average of the set of n measurements 36
  • 37.
    Types of Error 1.Gross error: These errors are generally human errors using the instruments such as:  misreading instrument  incorrect adjustment  improper application of instrument  computation errors 2. Systematic errors: due to short comings of the instrument and changes in external conditions affecting the measurement..  Instruments errors: errors due to changes in the proprieties of the components used in instrument such as:  friction in the bearing of the meter movement  incorrect spring tension  improper calibration faulty instruments Instruments errors can be reduced by proper maintenance, use, and handling of instruments. 37
  • 38.
     Environmental errors:Subjecting instruments to harsh environment such as:  high temperatures  pressure, or humidity  strong electrostatic  electromagnetic fields  Observational errors: errors introduced by the observer. Probably the most common observational errors are the parallax error introduced in reading a meter scale and the error of estimation when obtaining a reading from a meter scale 3. Random errors: Random errors are generally the accumulation of a large number of small effects and may be of real concern only in measurements requiring a high degree of accuracy. Such errors can only be analyzed statistically. 38
  • 39.
    Nosie and Interference •under real time conditions the performance of the measuring elements are influenced by undesirable environmental effects (temperature, pressure, humidity, etc) • besides the measurement is significantly affected by the general random behavior of system such as;  random variation in the input (Signal)  random variation in the system (white noise)  deterministic disturbances in the system (interference Power frequency interference)  switching circuit (sparking)  RF generating circuit (inductor). 39
  • 40.
    Ways of Reducingthe Effects of Noise and Interference  Shielding (isolation):this is usually done either by isolating the instrument from these environmental effects or shielding the instrument with specially fabricated material having the property of isolating the instrument from any interfering or modifying input.  Environmental insensitivity: another important technique is making the instrument to be insensitive to any modifying or interfering input (i.e. Km = 0, Ki = 0)  Methods of opposing input: this is one of the most commonly applied technique in which instruments make use a technique or means to cancel the effects of undesired signals  Filtering: filtering is a technique applied to signals so as to pass or reject frequency of desire. 40
  • 41.
    • Modulation: modulationcan be thought of as a technique used change the frequency content of the original signal so to transmit or reduce the effect of undesired inputs. • Averaging : As noise signals are unpredictable averaging them may reduce the magnitude • Correlation: A method used to detect the presence of any periodic signal buried in random noise. It is used to obtain the relation of the signal and its time shifted signal. 41
  • 42.
    FACTORS TO SELECTINSTRUMENTS 1. Performance Requirements  Range /Span  Speed  Power consumption  Efficiency  Size & Weight  Test levels (Electromagnetic Interference, Vibration & Shock) 2. Sensitivity : It must be sensitive enough to produce detectable o/p. 3. Accuracy: Instrument should have high degree of accuracy 4. Errors : The instrument should maintain the expected input-output relation ship as described by its transfer function so as to avoid errors 42
  • 43.
    5. Electrical Aspects: Length & type of cable required for instruments, 6. Loading Effects: Instrument should have high input impedance and low output impedance to avoid loading effect. 7. Static Characteristics: • Low non-linearity • Low hysteresis • High resolution • High degree of repeatability 8. Insensitivity to unwanted signals: The instrument should be minimally sensitive to unwanted signals and highly sensitive to desired signals 9. Transient & Frequency response : The instrument should meet the time- domain specifications like rise time ,settling time, small dynamic error. It should have flat frequency response curve and should have wide bandwidth. 10. Stability & Reliability : The instrument should have a high degree of stability to be operative during its operation and storage life. 43