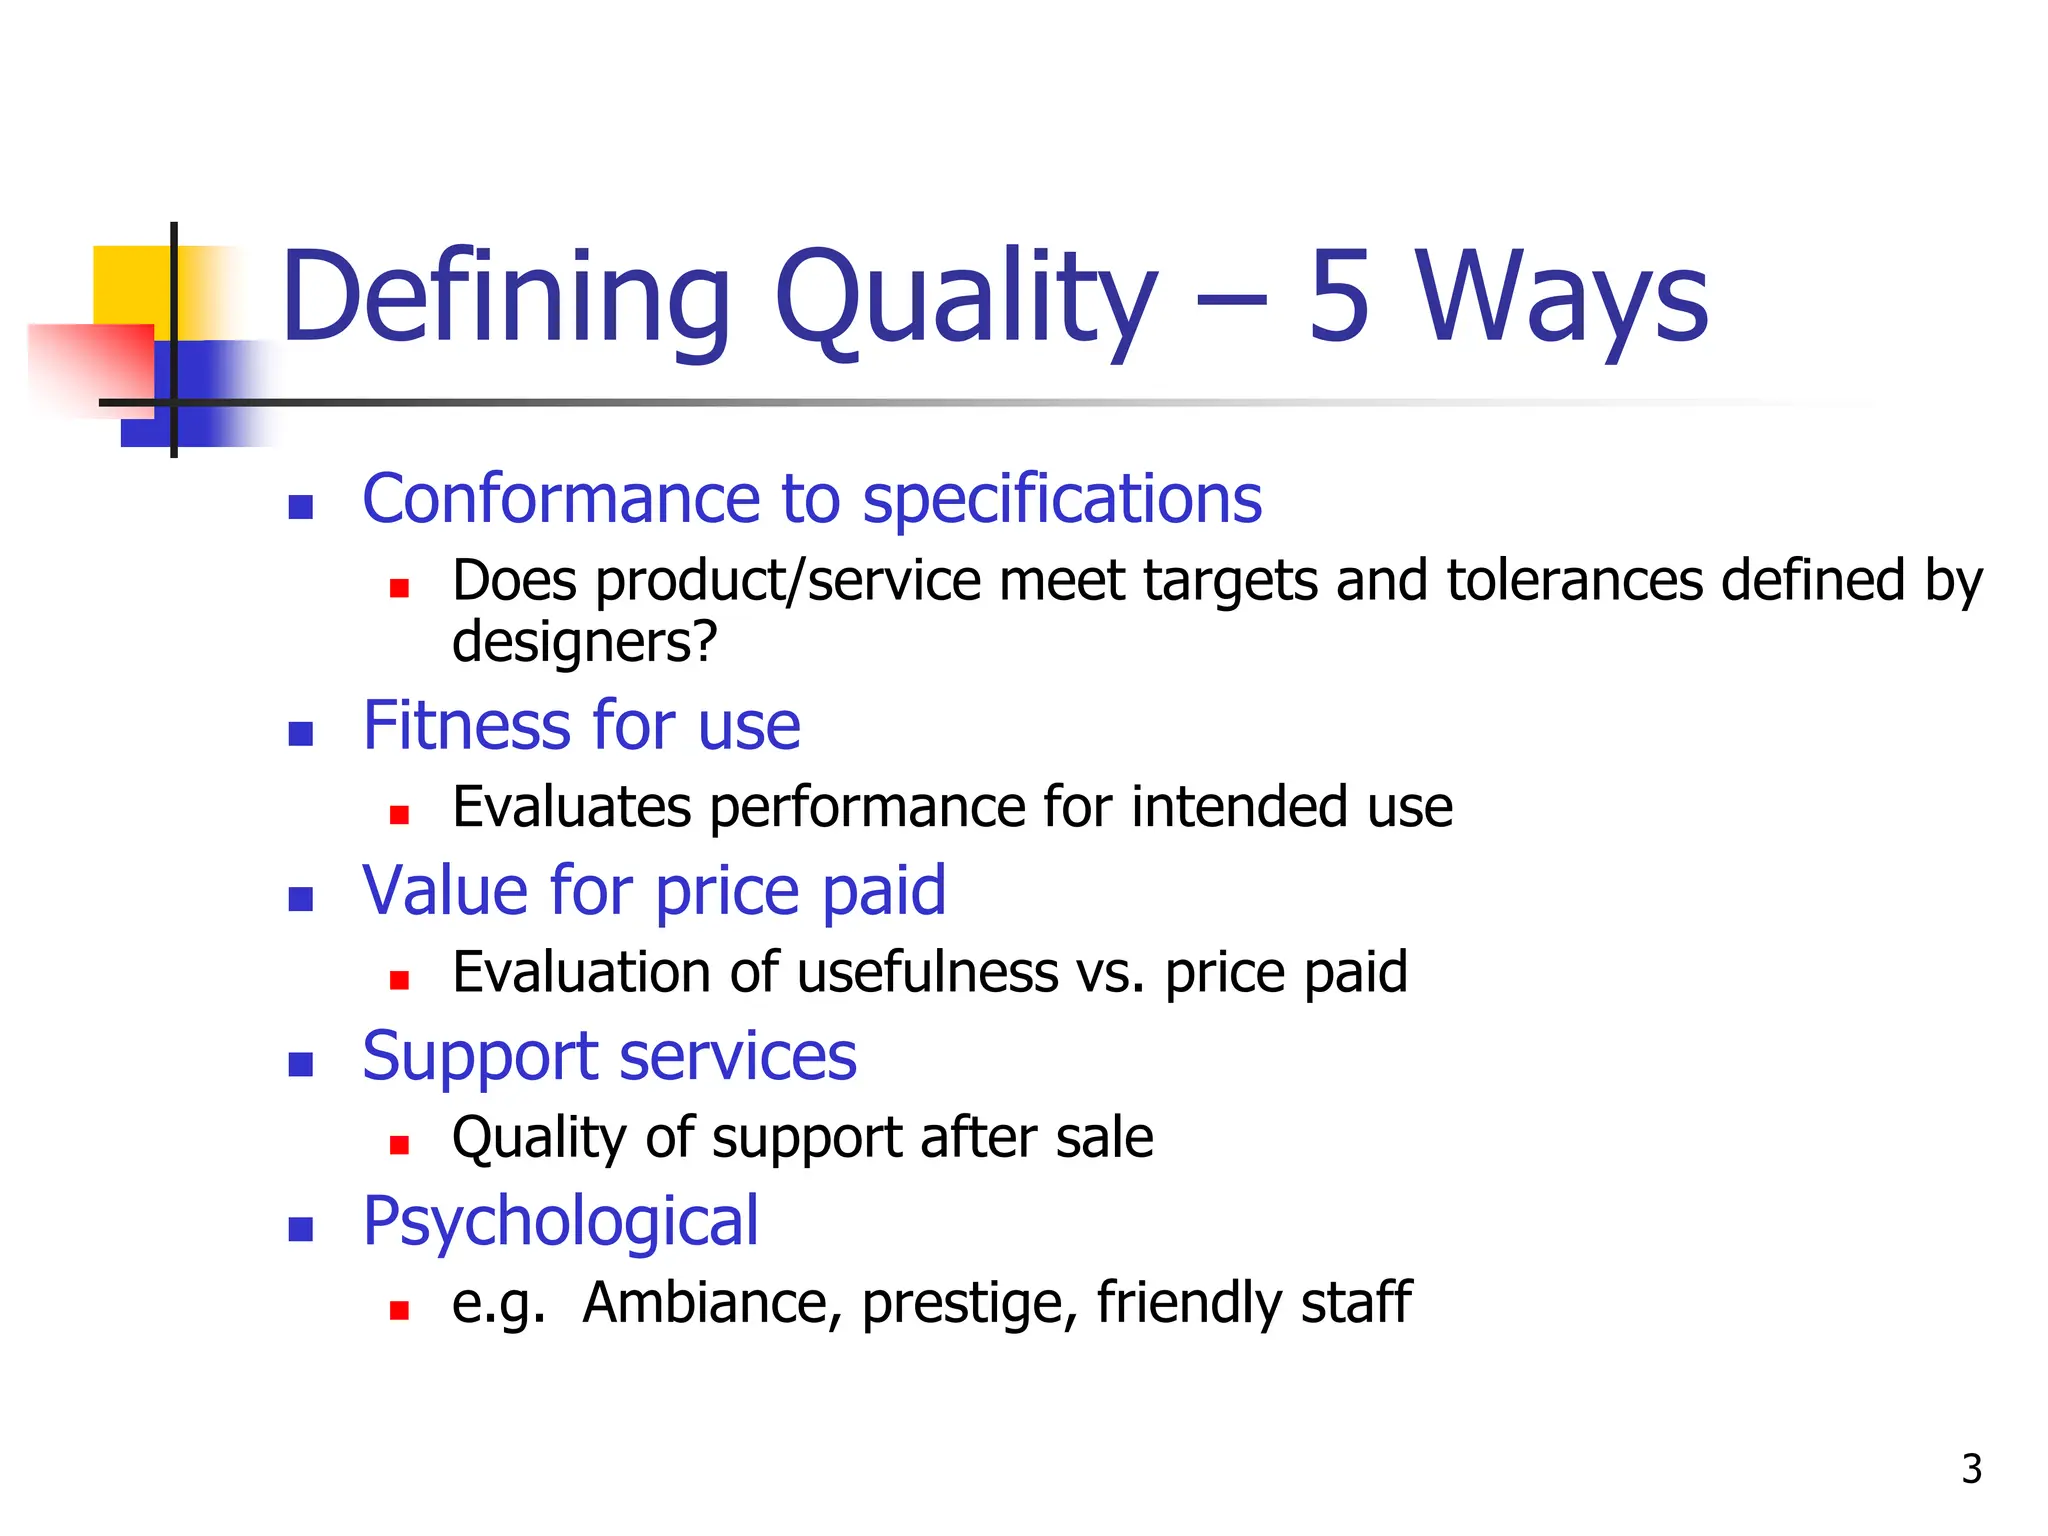
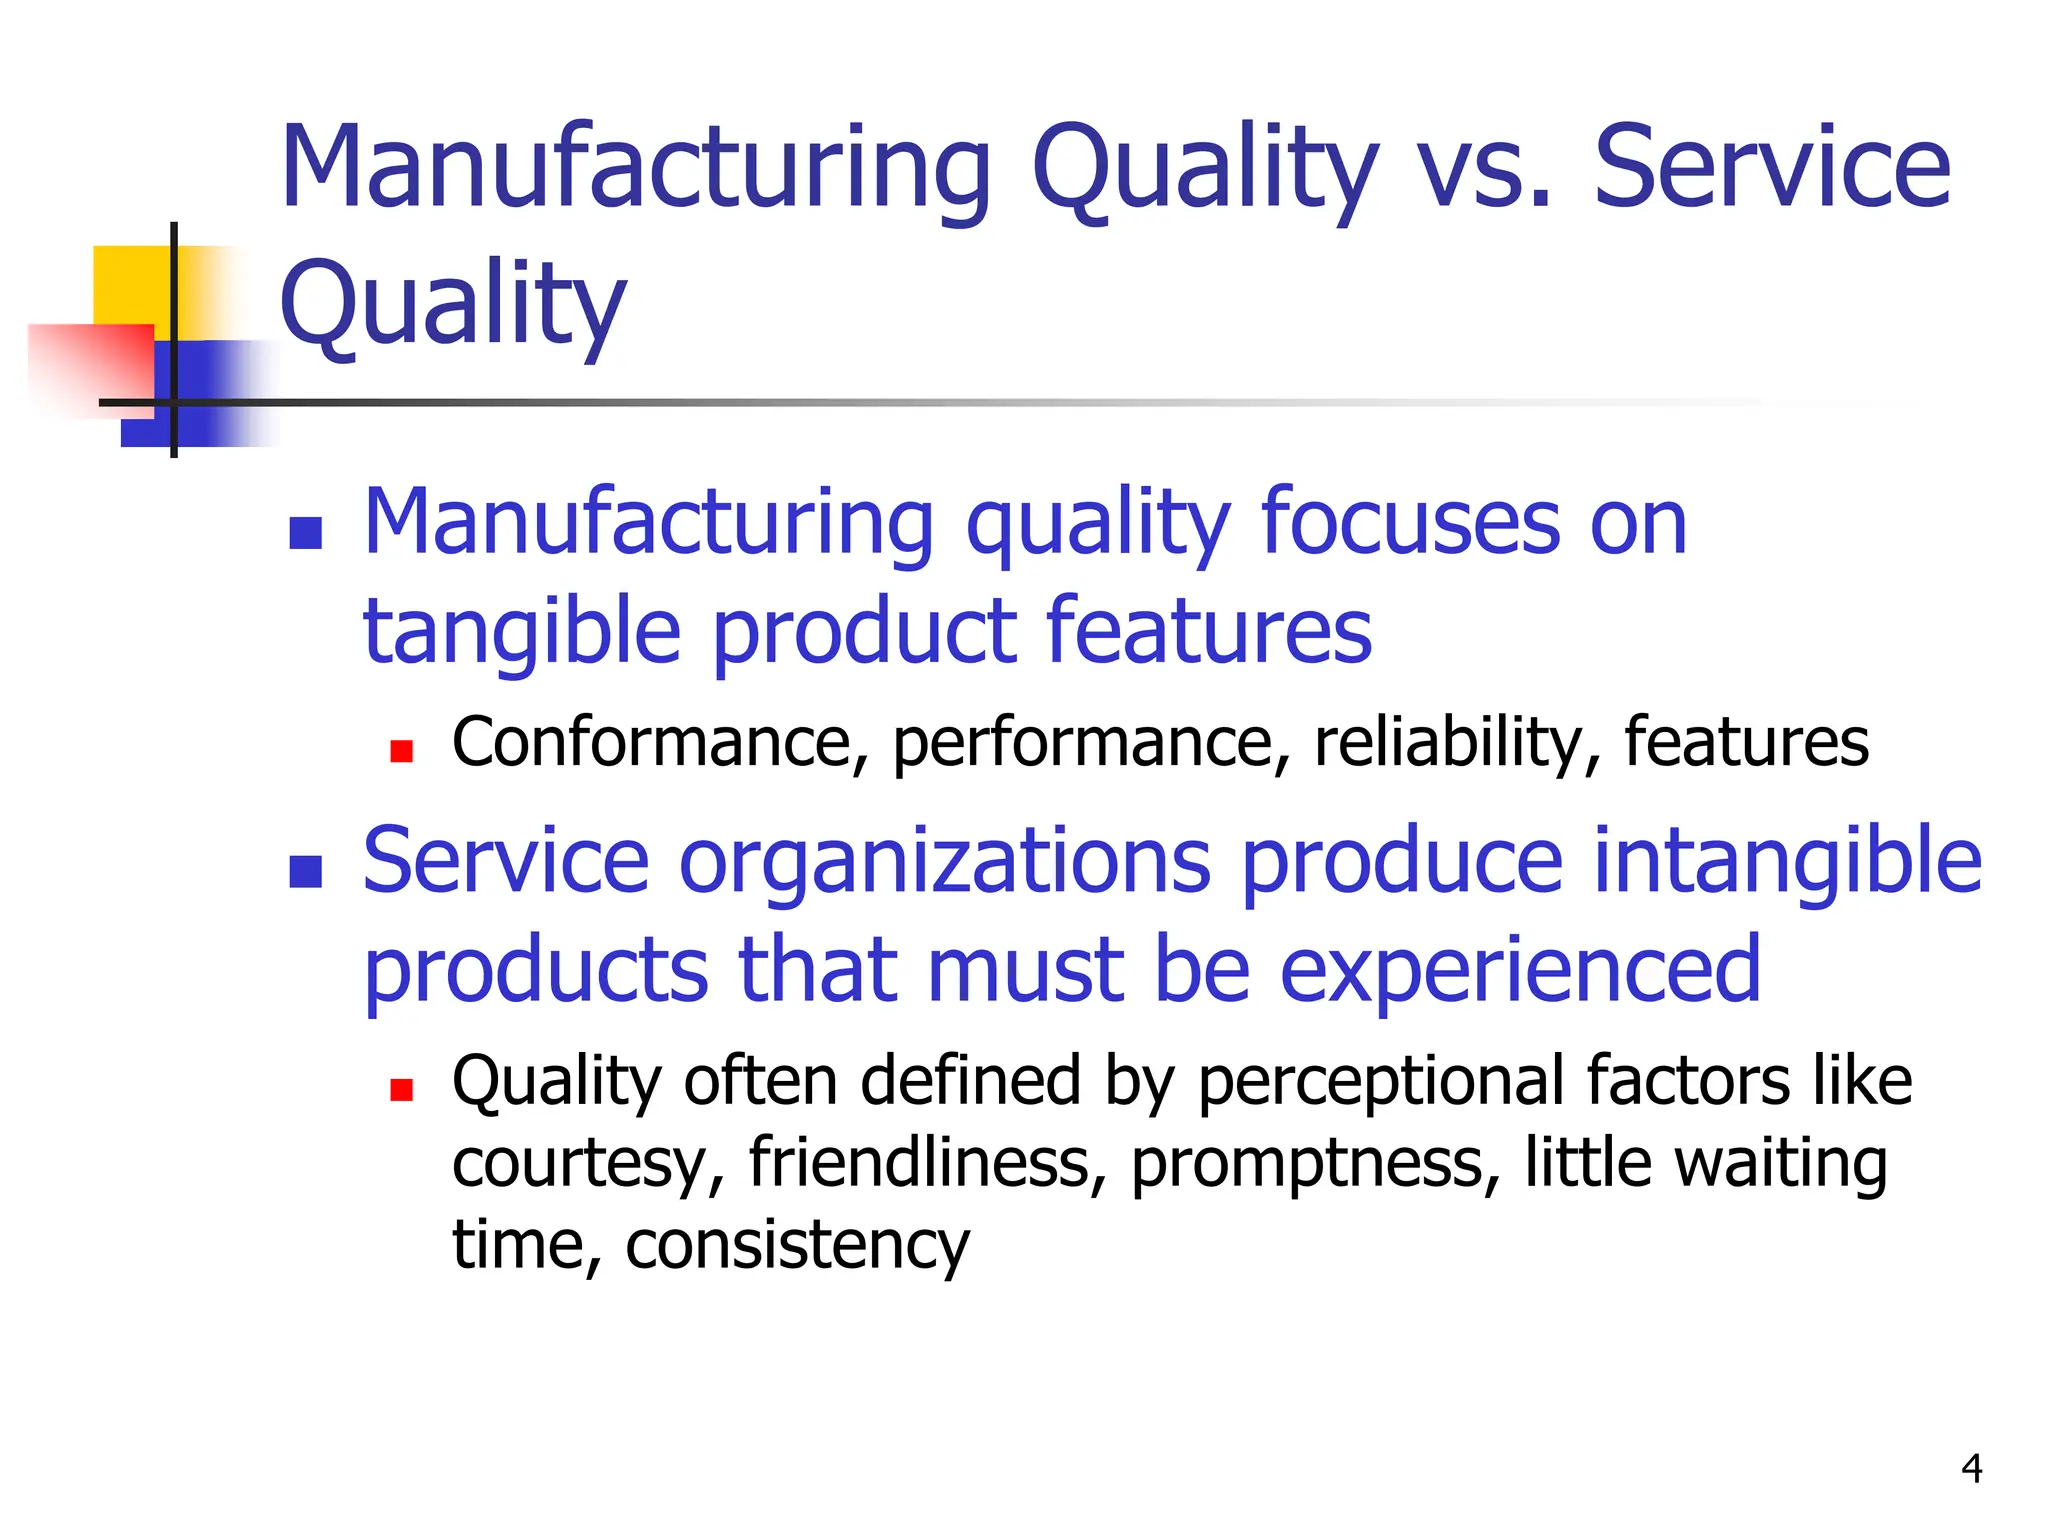
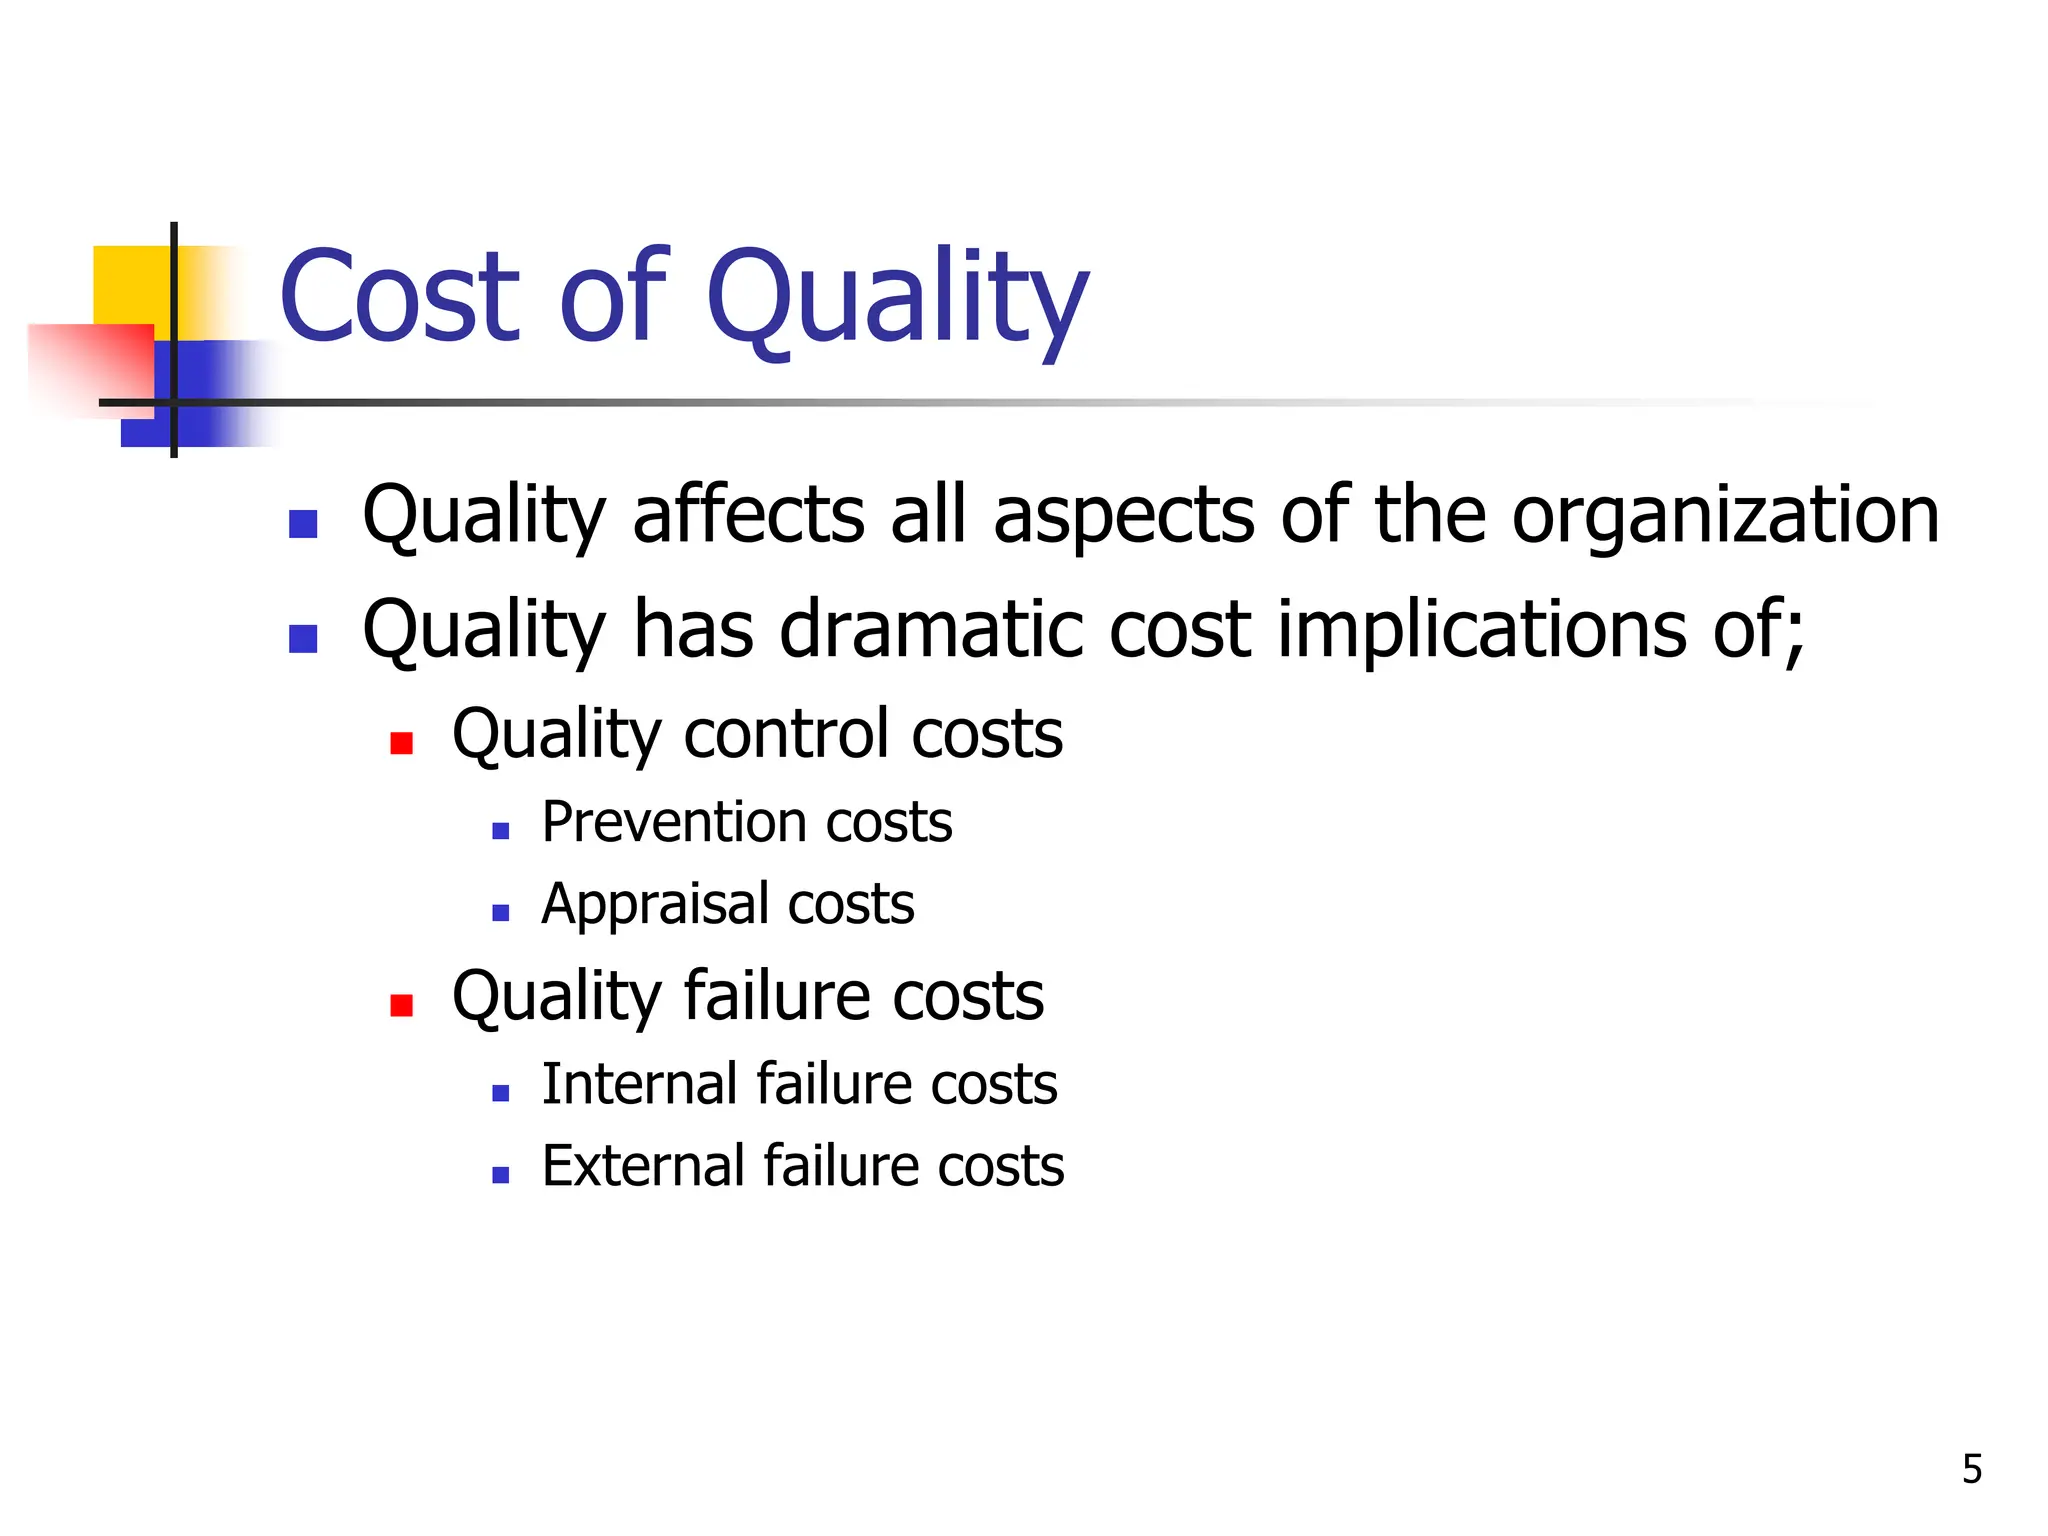
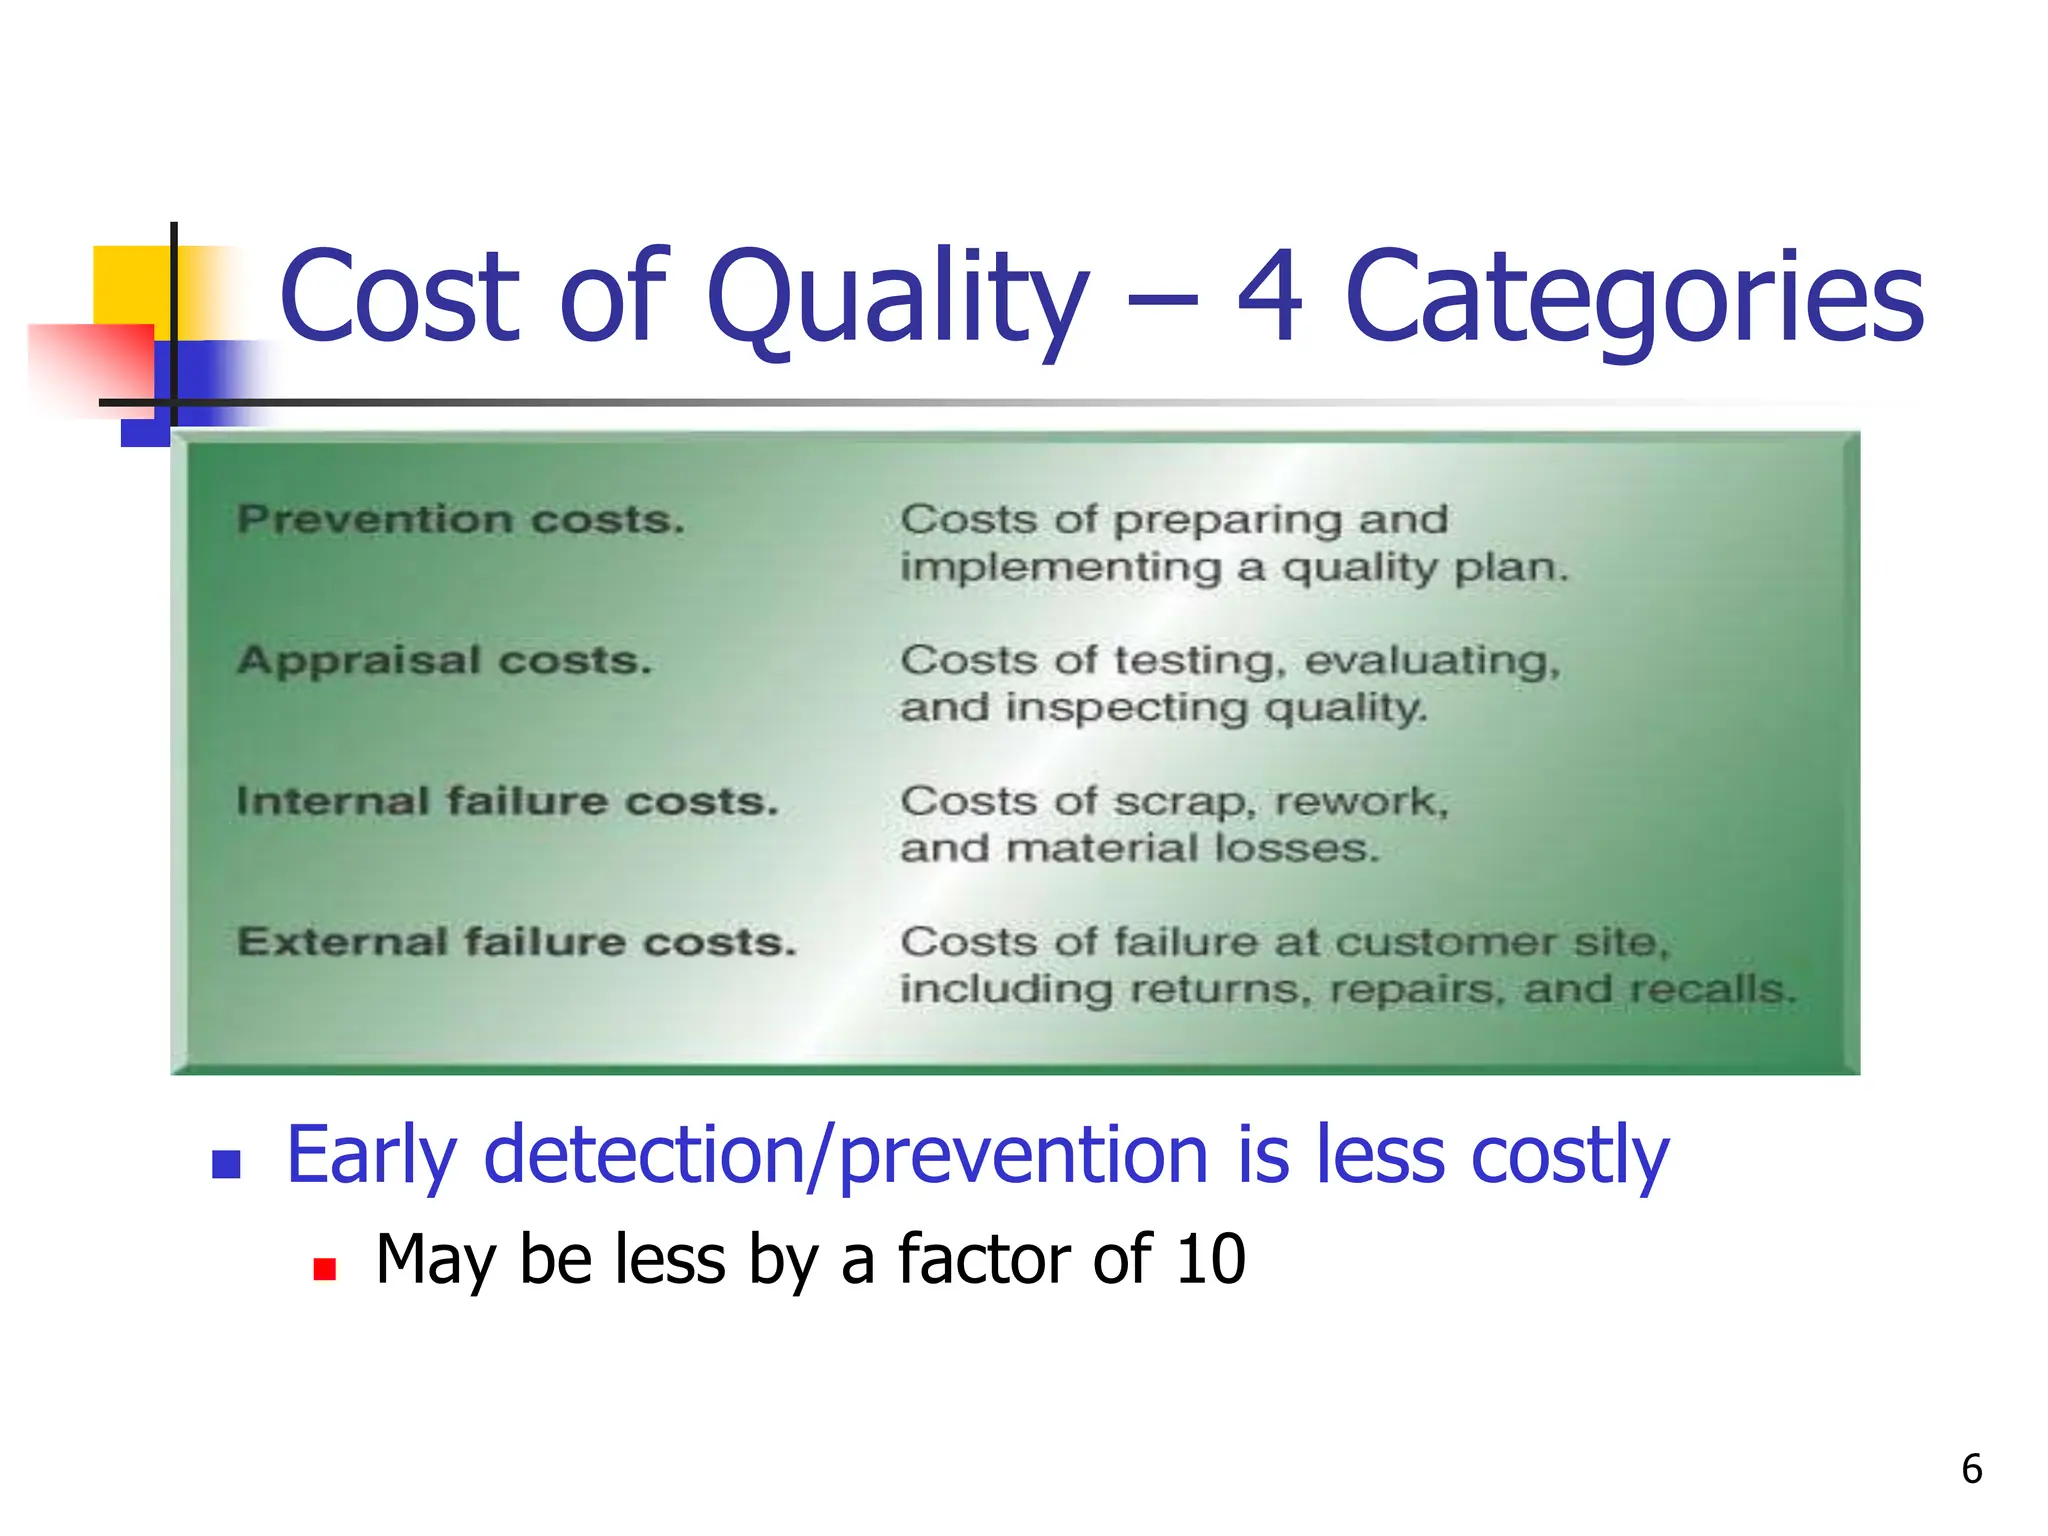
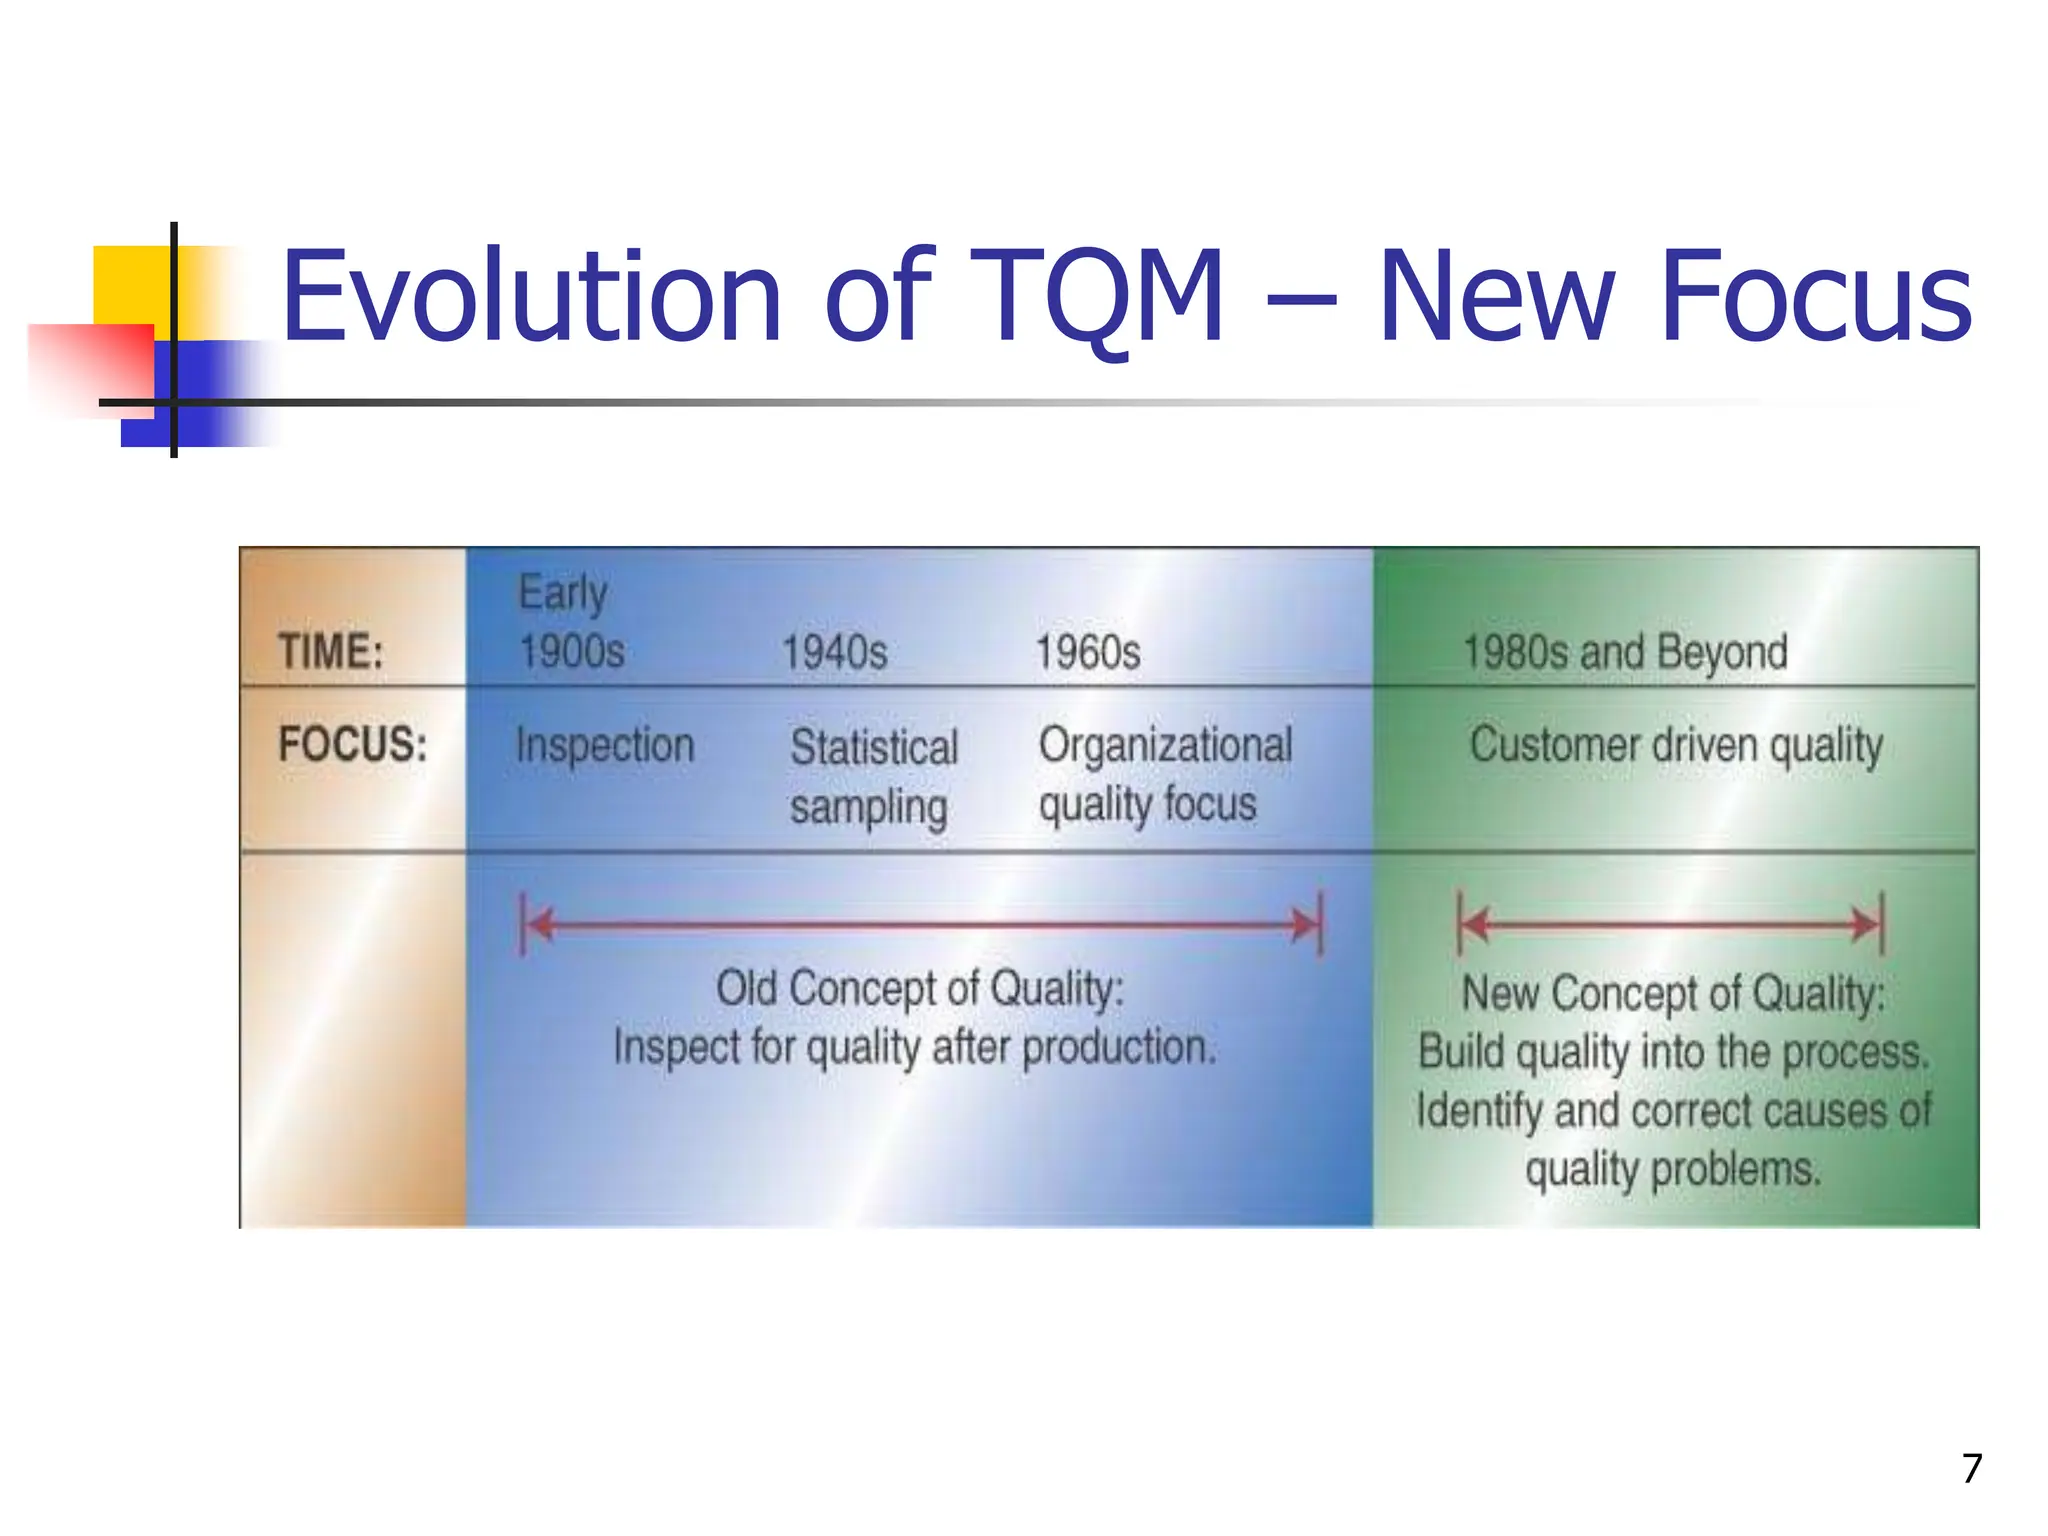
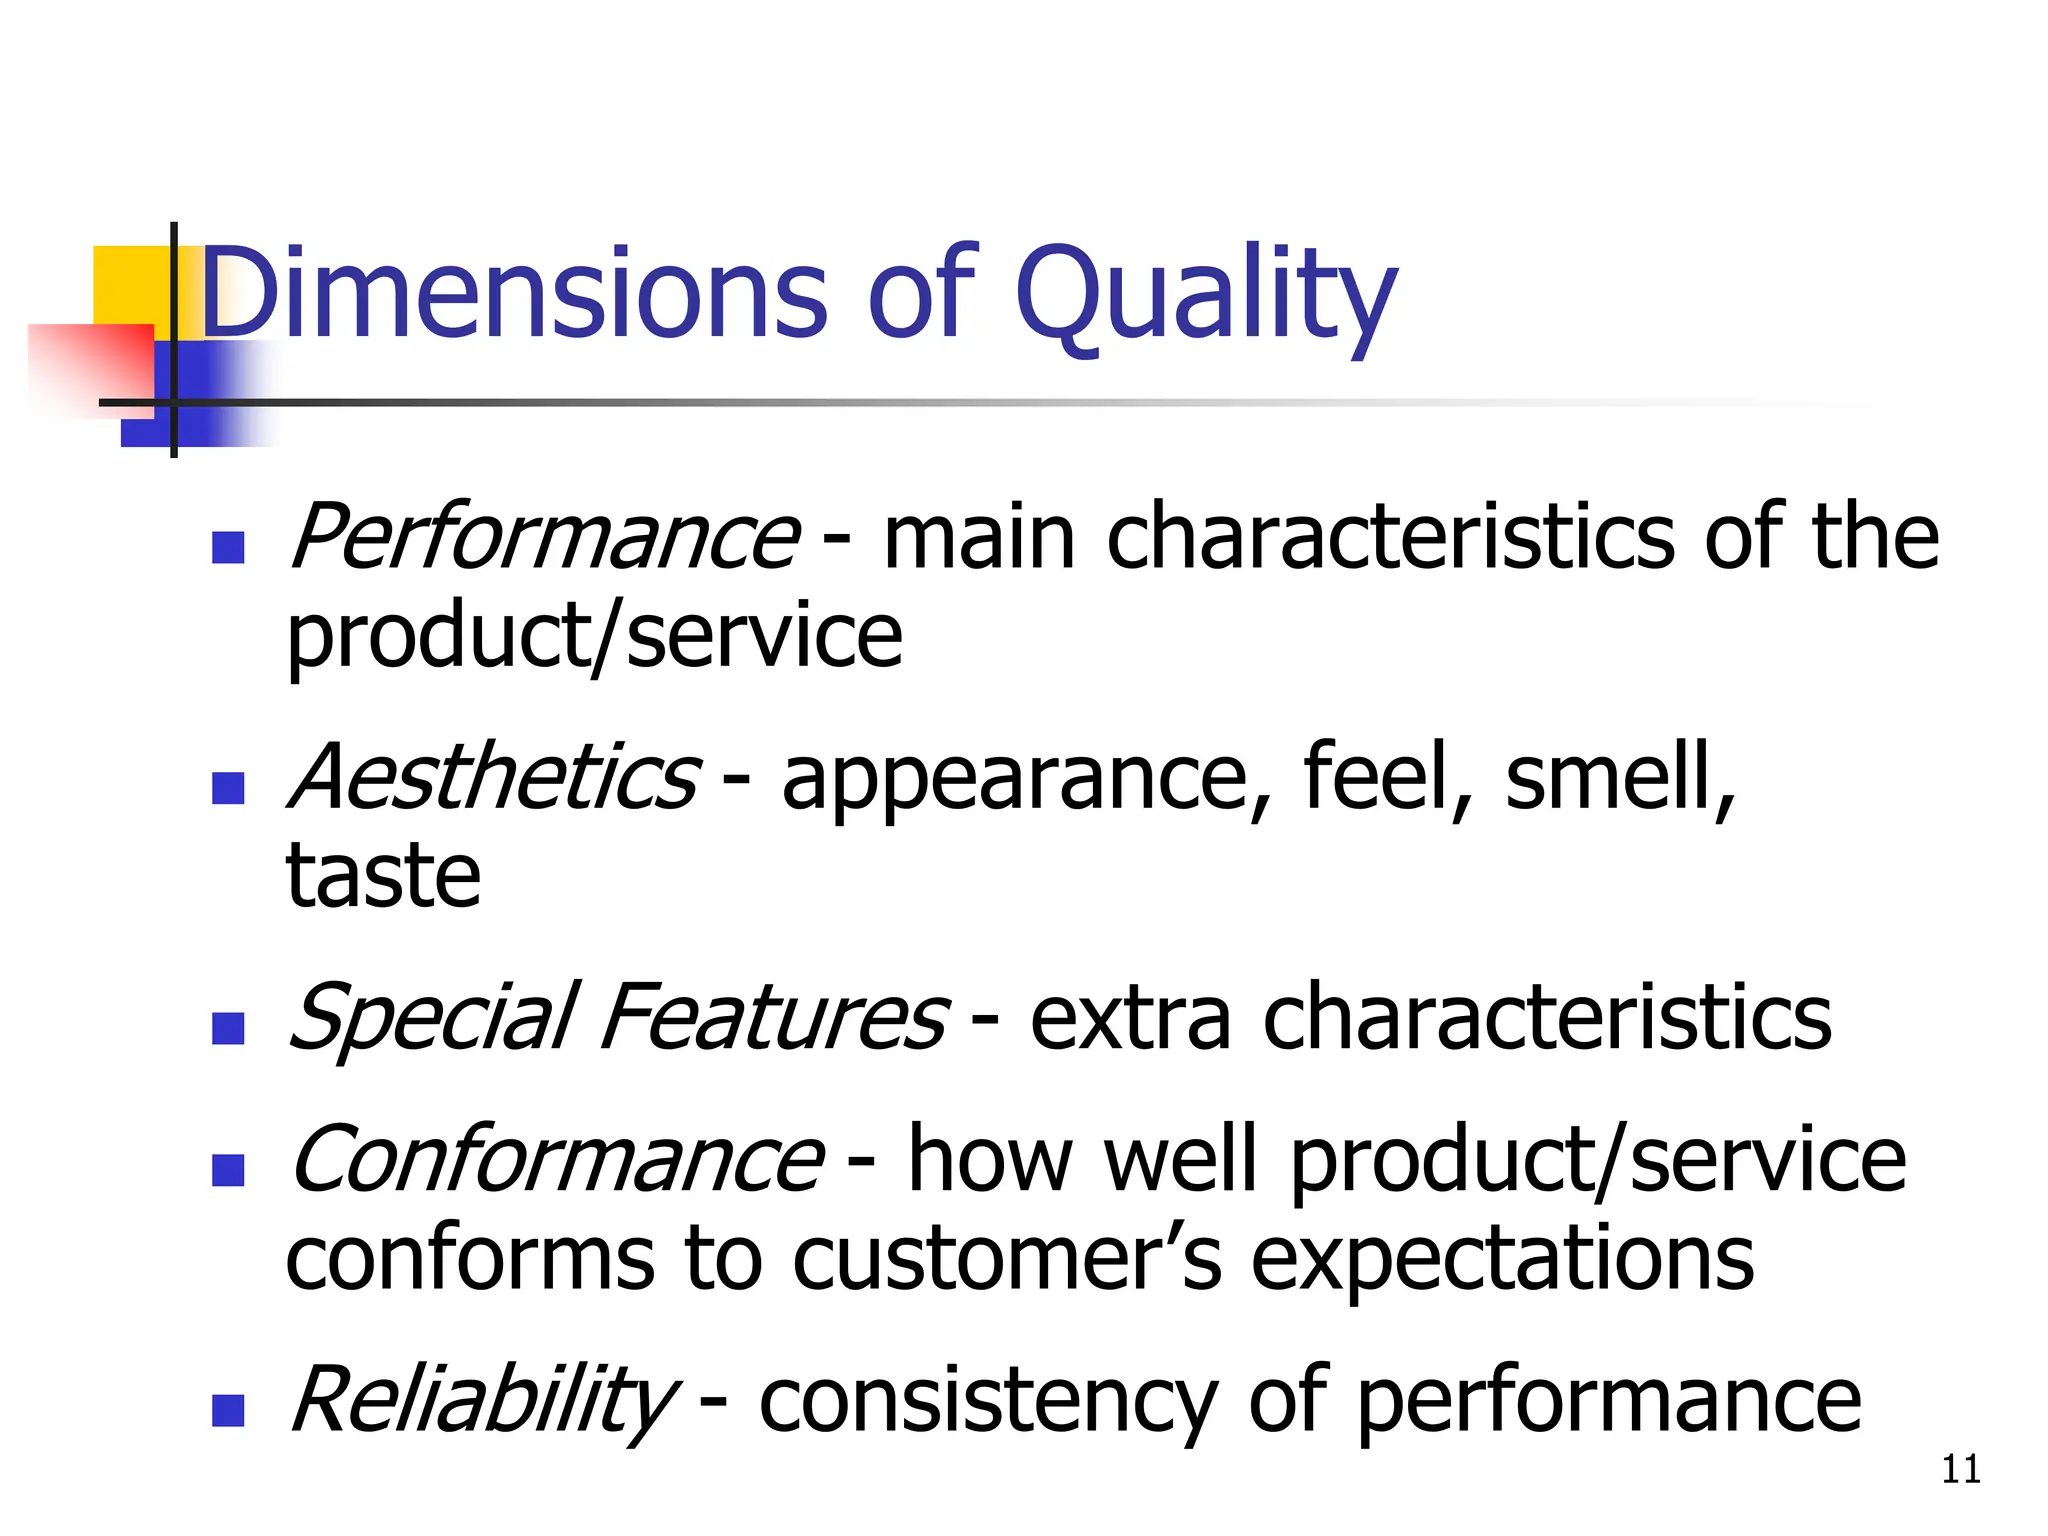
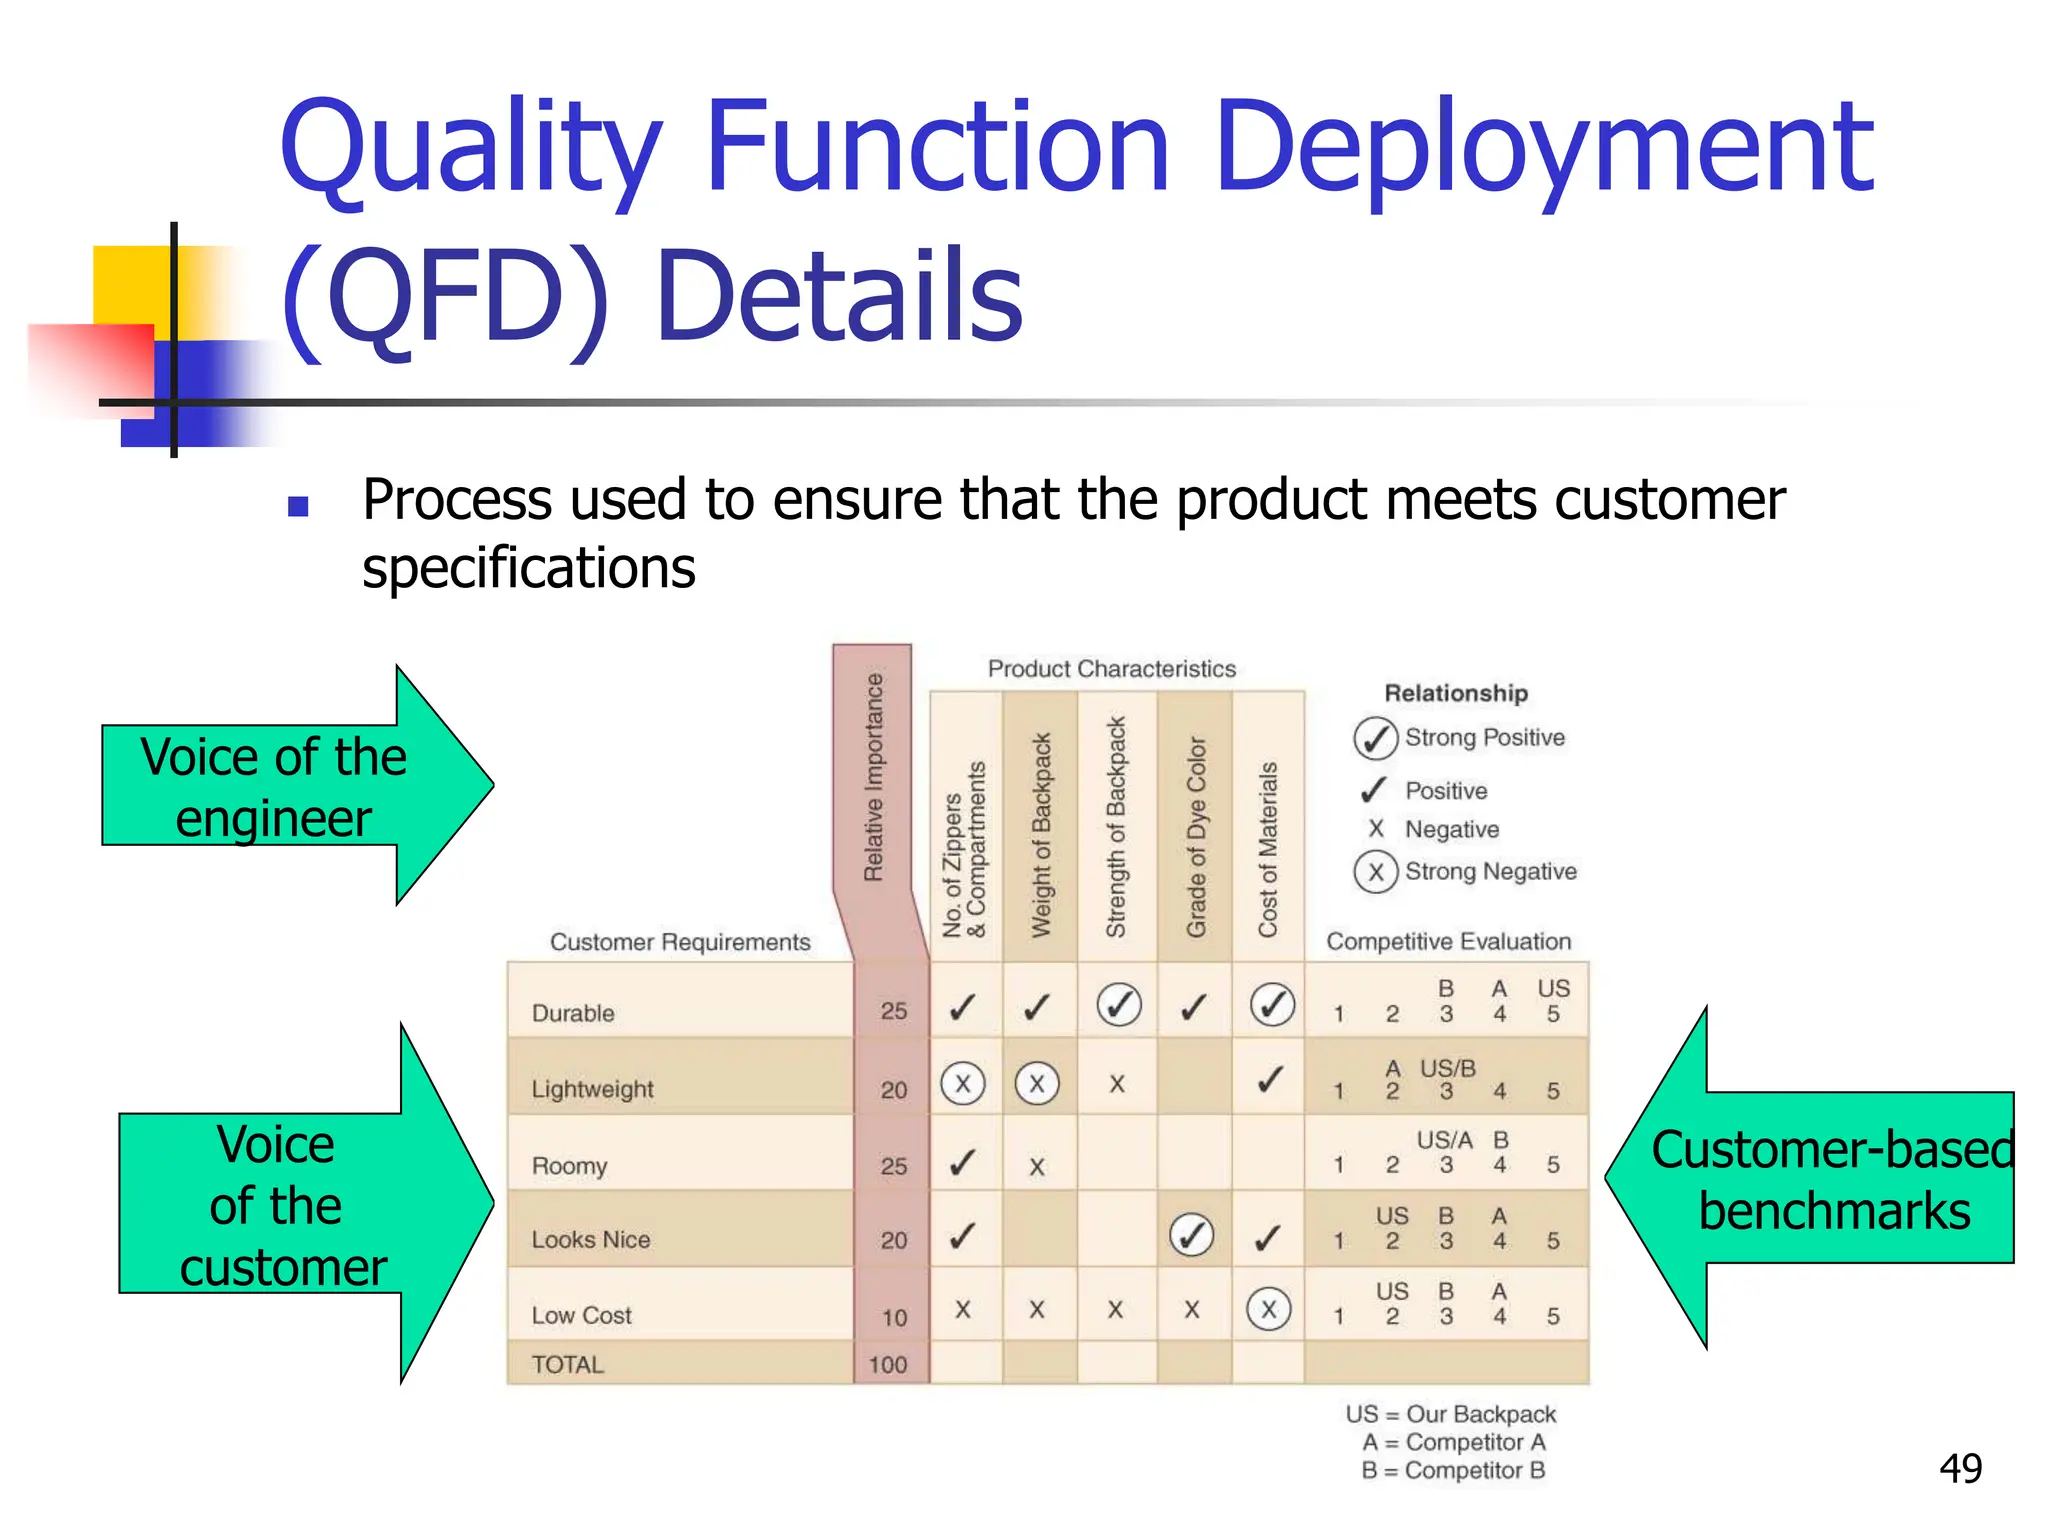
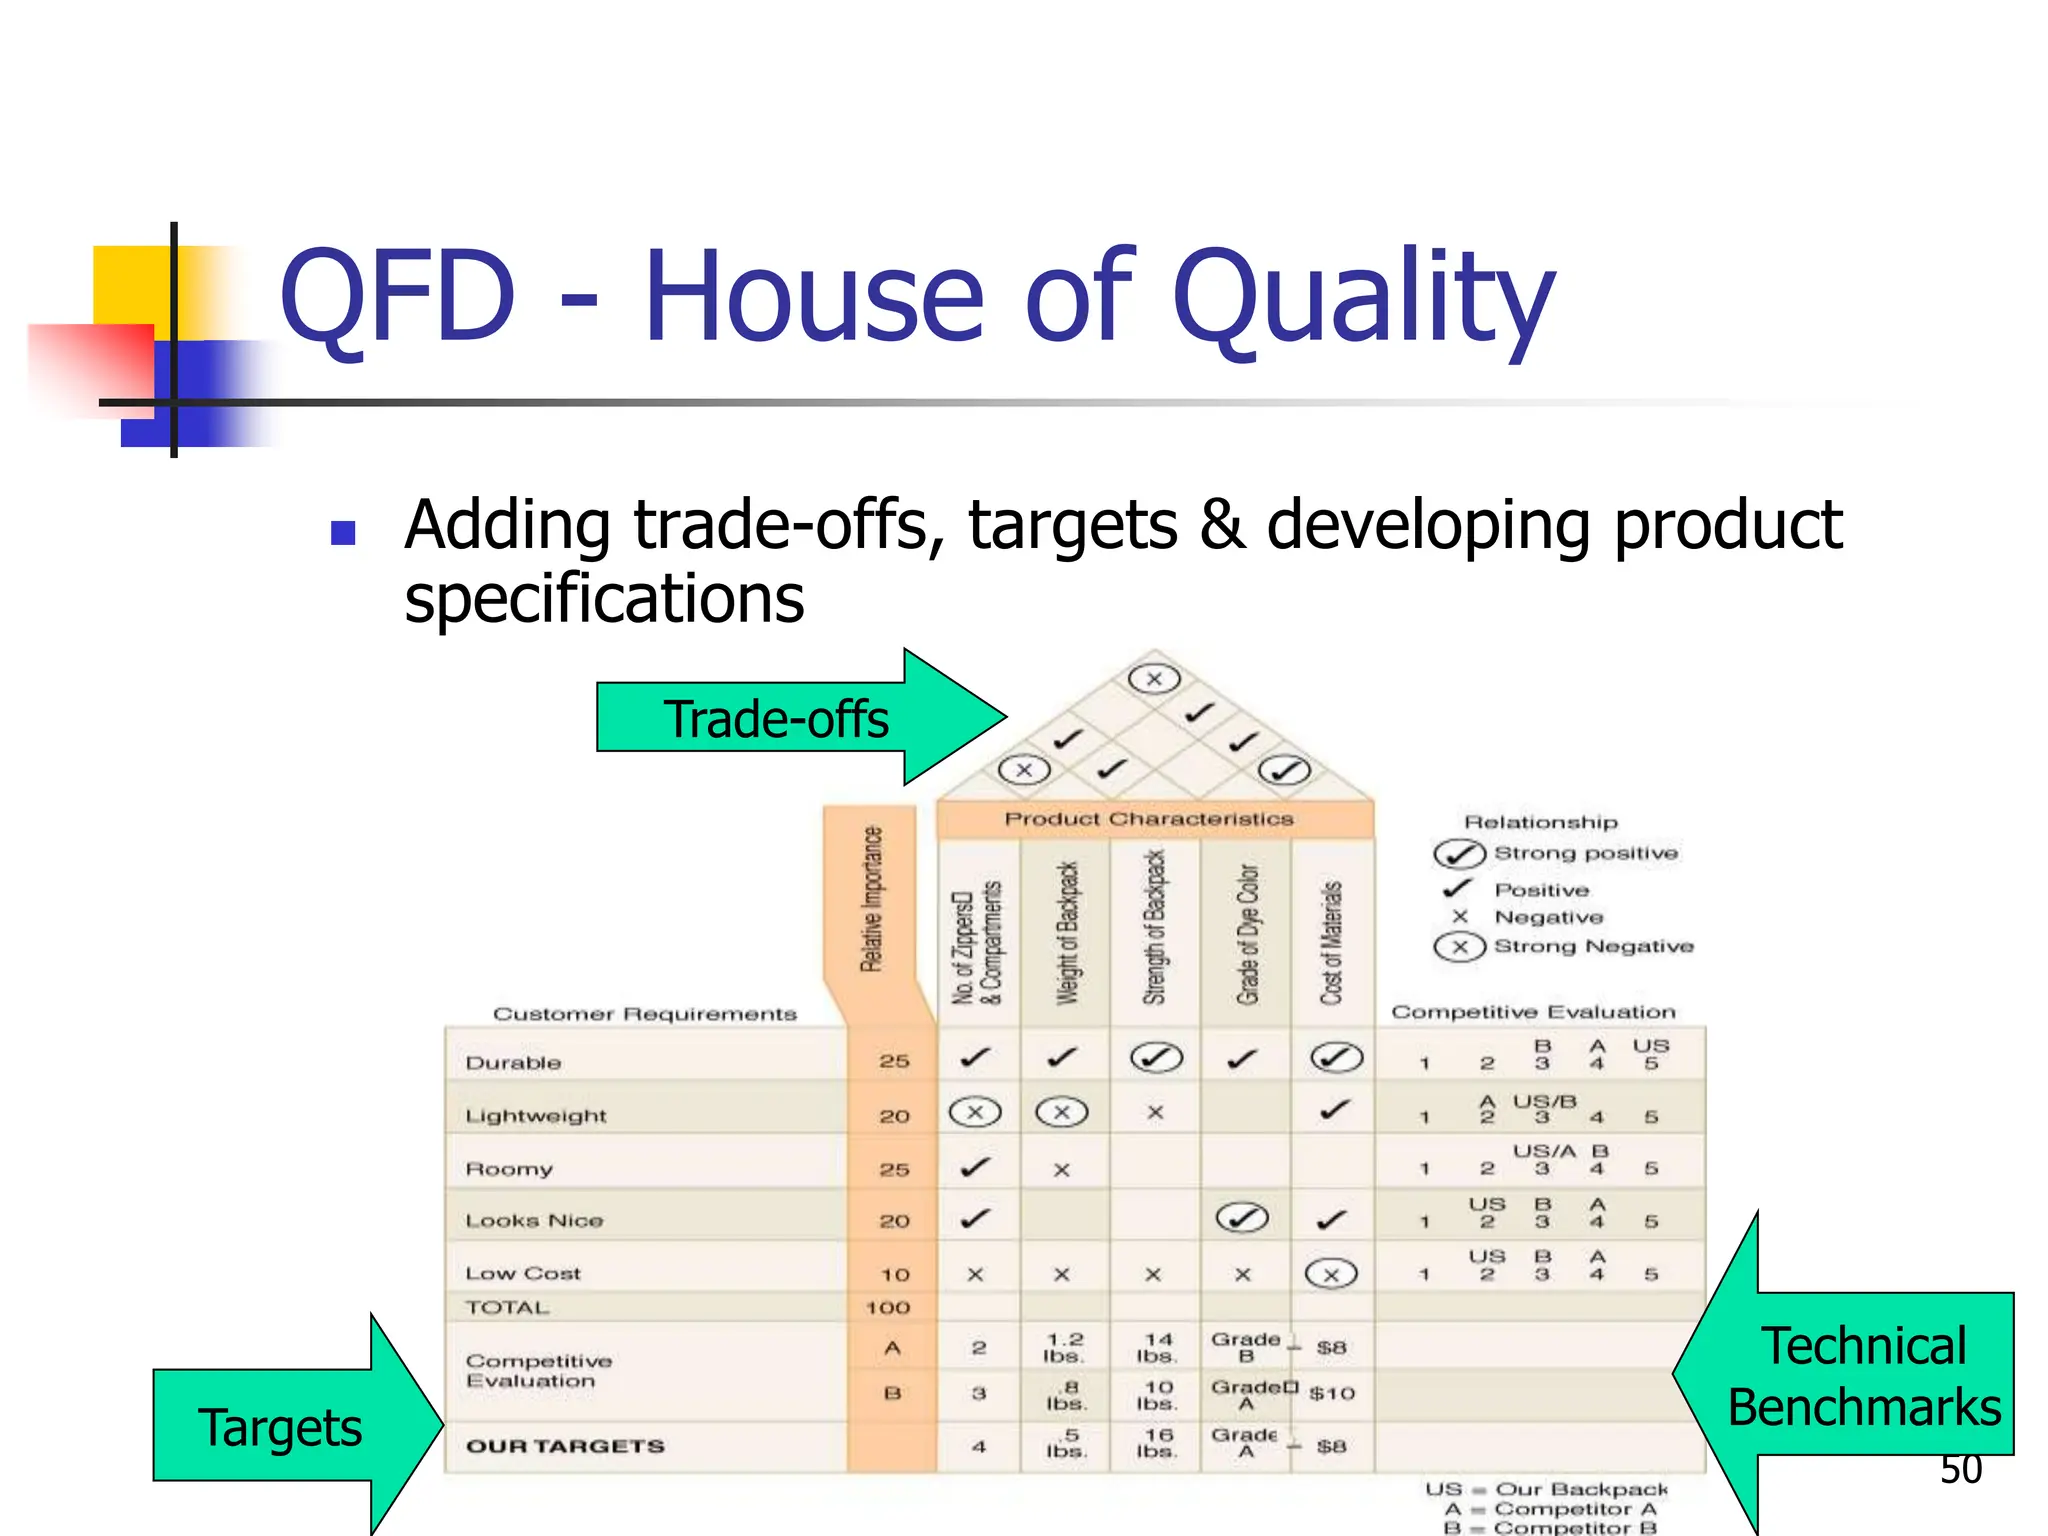
Chapter 5
Quality Management
&
Control
2
Defining Quality
 Definition of quality is dependent on the
people defining it
 There is a lack of a single, universal definition
of quality
 5 common definitions include
 Conformance to specifications
 Fitness for use
 Value for price paid
 Support services
 Psychological criteria
3
Defining Quality – 5 Ways
 Conformance to specifications
 Does product/service meet targets and tolerances defined by
designers?
 Fitness for use
 Evaluates performance for intended use
 Value for price paid
 Evaluation of usefulness vs. price paid
 Support services
 Quality of support after sale
 Psychological
 e.g. Ambiance, prestige, friendly staff
4
Manufacturing Quality vs. Service
Quality
 Manufacturing quality focuses on
tangible product features
 Conformance, performance, reliability, features
 Service organizations produce intangible
products that must be experienced
 Quality often defined by perceptional factors like
courtesy, friendliness, promptness, little waiting
time, consistency
5
Cost of Quality
 Quality affects all aspects of the organization
 Quality has dramatic cost implications of;
 Quality control costs
 Prevention costs
 Appraisal costs
 Quality failure costs
 Internal failure costs
 External failure costs
6
Cost of Quality – 4 Categories
 Early detection/prevention is less costly
 May be less by a factor of 10
7
Evolution of TQM – New Focus
8
Quality Gurus
Evolution of Quality Management
 1924 - Statistical process control charts
 1930 - Tables for acceptance sampling
 1940’s - Statistical sampling techniques
 1950’s - Quality assurance/TQC
 1960’s - Zero defects
 1970’s - Quality assurance in services
9
Quality Assurance vs. Strategic
Approach
 Quality Assurance
 Emphasis on finding and correcting defects
before reaching market
 Strategic Approach
 Proactive, focusing on preventing mistakes
from occurring
 Greater emphasis on customer satisfaction
10
Dimensions of Quality
 Performance - main characteristics of the
product/service
 Aesthetics - appearance, feel, smell,
taste
 Special Features - extra characteristics
 Conformance - how well product/service
conforms to customer’s expectations
 Reliability - consistency of performance
11
Dimensions of Quality (Cont’d)
 Durability - useful life of the
product/service
 Perceived Quality - indirect evaluation of
quality (e.g. reputation)
 Serviceability - service after sale
12
Examples of Quality Dimensions
Dimension
1. Performance
2. Aesthetics
3. Special features
(Product)
Automobile
Everything works, fit &
finish
Ride, handling, grade of
materials used
Interior design, soft touch
Gauge/control placement
Cellular phone, CD
player
(Service)
Auto Repair
All work done, at agreed
price
Friendliness, courtesy,
Competency, quickness
Clean work/waiting area
Location, call when ready
Computer diagnostics
Examples of Quality Dimensions (Cont’d)
Dimension
5. Reliability
6. Durability
7. Perceived
quality
8. Serviceability
(Product)
Automobile
Infrequency of breakdowns
Useful life in miles, resistance
to rust & corrosion
Top-rated car
Handling of complaints and/or
requests for information
(Service)
Auto Repair
Work done correctly,
ready when promised
Work holds up over
time
Award-winning service
department
Handling of complaints
Service Quality
 Tangibles
 Convenience
 Reliability
 Responsiveness
 Time
 Assurance
 Courtesy
15
Examples of Service Quality
Dimension Examples
1. Tangibles Were the facilities clean, personnel neat?
2. Convenience Was the service center conveniently located?
3. Reliability Was the problem fixed?
4. Responsiveness Were customer service personnel willing and able to
answer questions?
5. Time How long did the customer wait?
6. Assurance Did the customer service personnel seem
knowledgeable about the repair?
7. Courtesy Were customer service personnel and the cashier
friendly and courteous?
The Consequences of Poor Quality
 Loss of business
 Liability
 Productivity
 Costs
17
 Top management
 Design
 Procurement
 Production/operations
 Quality assurance
 Packaging and shipping
 Marketing and sales – don’t promise
what u cannot deliver
 Customer service
Responsibility for Quality
18
 Substandard work
 Defective products
 Substandard service
 Poor designs
 Shoddy workmanship
 Substandard parts and materials
Ethics and Quality
Having knowledge of this and failing to correct
and report it in a timely manner is unethical.
19
Quality Awards
Baldrige Award
Deming Prize
20
Malcolm Baldrige National Quality
Award
In recognition of the contribution of Commerce
Secretary of Pres. Regan - 1987: weights given
1.0 Leadership (125 points)
2.0 Strategic Planning (85 points)
3.0 Customer and Market Focus (85 points)
4.0 Information and Analysis (85 points)
5.0 Human Resource Focus (85 points)
6.0 Process Management (85 points)
7.0 Business Results (450 points)
21
Benefits of Baldrige Competition
 Financial success
 Winners share their knowledge
 The process motivates employees
 The process provides a well-designed
quality system
 The process requires obtaining data
 The process provides feedback
22
European Quality Award
 Prizes intended to identify role models
 Leadership
 Customer focus
 Corporate social responsibility
 People development and involvement
 Results orientation
23
The Deming Prize
 Honoring W. Edwards Deming
 Japan’s highly coveted award
 Main focus on statistical quality
control
24
Quality Certification
 ISO 9000
 Set of international standards on quality
management and quality assurance, critical
to international business
 ISO 14000
 A set of international standards for
assessing a company’s environmental
performance
25
ISO 9000 Quality Management
Principles
 A systems approach to management
 Continual improvement
 Factual approach to decision making
 Mutually beneficial supplier relationships
 Customer focus
 Leadership
 People involvement
 Process approach
26
 ISO 14000 - A set of international
standards for assessing a company’s
environmental performance
 Standards in three major areas
 Management systems
 Operations
 Environmental systems
ISO 14000
27
 Management systems
 Systems development and integration of
environmental responsibilities into business
planning
 Operations
 Consumption of renewable natural
resources and clean energy
 Environmental systems
 Measuring, assessing and managing
emissions, and other waste
ISO 14000
28
Total Quality Management
A philosophy that involves everyone in
an organization in a continual effort to
improve quality and achieve customer
satisfaction.
T Q M
29
1. Find out what the customer wants
2. Design a product or service that meets
or exceeds customer wants
3. Design processes that facilitates doing
the job right the first time
4. Keep track of results
5. Extend these concepts to suppliers
The TQM Approach
30
Elements of TQM
 Continual improvement
 Competitive benchmarking
 Employee empowerment
 Team approach
 Decisions based on facts
 Knowledge of tools
 Supplier quality
 Champion
 Quality at the source
31
Quality at the Source
The philosophy of making each
worker responsible for the
quality of his or her work.
32
33
TQM Philosophy
 TQM Focuses on identifying quality problem root
causes
 Encompasses the entire organization
 Involves the technical as well as people
 Relies on seven basic concepts of
 Customer focus
 Continuous improvement
 Employee empowerment
 Use of quality tools
 Product design
 Process management
 Managing supplier quality
34
TQM Philosophy - concepts
 Focus on Customer
 Identify and meet customer needs
 Stay tuned to changing needs, e.g. fashion styles
 Continuous Improvement
 Philosophy that seeks to make never-ending improvements to the
process of converting inputs into outputs.
 Kaizen: Japanese word for continuous improvement.
 Benchmarking
 Employee Empowerment
 Empower all employees; external and internal customers
35
TQM Philosophy– Concepts (continued)
 Team Approach
 Teams formed around processes – 8 to 10 people
 Meet weekly to analyze and solve problems
 Understanding Quality Tools
 Ongoing training on analysis, assessment, and
correction, & implementation tools
 Studying practices at “best in class” companies
 Plan-Do-Study-Act
36
Ways of Improving Quality
 Plan-Do-Study-Act Cycle (PDSA)
 Also called the Deming Wheel after originator
 Circular, never ending problem solving process
 Seven Tools of Quality Control
 Tools typically taught to problem solving teams
 Quality Function Deployment
 Used to translate customer preferences to design
37
PDSA Details
 Plan
 Evaluate current process
 Collect procedures, data, identify problems
 Develop an improvement plan, performance
objectives
 Do
 Implement the plan – trial basis
 Study
 Collect data and evaluate against objectives
 Act
 Communicate the results from trial
 If successful, implement new process
38
PDSA (continued)
 Cycle is repeated
 After act phase, start planning and repeat process
39
Seven Tools of Quality Control
 Cause-and-Effect Diagrams
 Flowcharts
 Checklists
 Control Charts
 Scatter Diagrams
 Pareto Analysis
 Histograms
40
Cause-and-Effect Diagrams
 Called Fishbone Diagram
 Focused on solving identified quality problem
41
Flowcharts
 Used to document the detailed steps in a
process
 Often the first step in Process Re-Engineering
42
Checklist
 Simple data check-off sheet designed to
identify type of quality problems at each work
station; per shift, per machine, per operator
43
Control Charts
 Important tool used in Statistical Process
Control
 The UCL and LCL are calculated limits used to
show when process is in or out of control
44
Scatter Diagrams
 A graph that shows how two variables are
related to one another
 Data can be used in a regression analysis to
establish equation for the relationship
45
Pareto Analysis
 Technique that displays the degree of importance for each
element
 Named after the 19th century Italian Mathematician & economist
 Often called the 80-20 Rule
 Principle is that quality problems are the result of only a few
problems e.g. 80% of the problems caused by 20% of causes
46
Histograms
 A chart that shows the frequency distribution of
observed values of a variable like service time
at a bank drive-up window
 Displays whether the distribution is symmetrical
(normal) or skewed
47
Product Design - Quality
Function Deployment
 Critical to ensure product design meets customer
expectations
 Useful tool for translating customer specifications into
technical requirements is Quality Function Deployment
(QFD)
 QFD encompasses
 Customer requirements
 Competitive evaluation
 Product characteristics
 Relationship matrix
 Trade-off matrix
 Setting Targets
48
49
Quality Function Deployment
(QFD) Details
 Process used to ensure that the product meets customer
specifications
Voice of the
engineer
Voice
of the
customer
Customer-based
benchmarks
50
QFD - House of Quality
 Adding trade-offs, targets & developing product
specifications
Trade-offs
Targets
Technical
Benchmarks
51
Reliability – critical to quality
 Reliability is the probability that the
product, service or part will function as
expected
 No product is 100% certain to function
properly
 Reliability is a probability function
dependent on sub-parts or components
52
Reliability – critical to quality
 Reliability of a system is the product of
component reliabilities
RS = (R1) (R2) (R3) . . . (Rn)
RS = reliability of the product or system
R1 = reliability of the components
53
Reliability – critical to quality
 Increase reliability by placing
components in parallel
 Parallel components allow system to
operate if one or the other fails
54
Process Management
 Quality products come from quality
sources
 Quality must be built into the process
 Quality at the source is belief that it is
better to uncover source of quality
problems and correct it
 TQM extends to quality of product from
company’s suppliers
 Lack of:
 Company-wide definition of quality
 Strategic plan for change
 Customer focus
 Real employee empowerment
 Strong strong motivation
 Time to devote to quality initiatives
 Leadership
Obstacles to Implementing TQM
55
 Poor inter-organizational communication
 View of quality as a “quick fix”
 Emphasis on short-term financial results
 Internal political and “turf” wars
Obstacles to Implementing TQM
56
Criticisms of TQM
 Blind pursuit of TQM programs
 Quality-related decisions may not be tied
to market performance
 Failure to carefully plan a program
57
Six Sigma
 Statistically
 Having no more than 3.4 defects per million
 Conceptually
 Program designed to reduce defects
 Requires the use of certain tools and
techniques
58
Six Sigma – Meaning & Terminology
 Six Sigma - A business management strategy for
improving the quality of process outputs by
identifying and removing the causes of defects and
variation in the processes.
 Sigma A Greek letter (σ) that is used to represent
standard deviation, a measure of variation in a
statistical population.
 The term is used in Six Sigma methodology process
to represent 99.9997% consistency—six standard
deviations between the process mean and the nearer
of two specification limits.
59
Six Sigma – Meaning & Terminology
 Defects per million opportunities (DPMO) - A
standard measurement in Six Sigma methodology,
used to facilitate measurement and comparison of
processes.
 Defect - Any undesired result or any variation in a
required characteristic that does not conform to
requirements.
 Opportunity - Any area within a product, a service, or
a process in which a defect could occur.
60
Six Sigma Programs
 Six Sigma programs
 Improve quality
 Save time
 Cut costs
 Employed in critical areas such as
 Design
 Production
 Service
 Inventory management
 Delivery 61
Six Sigma Management
 Providing strong leadership
 Defining performance metrics
 Selecting projects likely to succeed
 Selecting and training appropriate people
62
Six Sigma Technical
 Improving process performance
 Reducing variation
 Utilizing statistical models
 Designing a structured improvement
strategy
63
Six Sigma Team
 Top management
 Program champions
 Master “black belts” - Champion
 “Black belts” – Project Sponsor
 “Green belts” – Process Owner
64
Six Sigma - Tools
 The seven basic tools— flow charts, cause-
and-effect diagrams, Pareto charts,
histograms, scatter diagrams, run charts, and
control charts—are sufficient for removing 95
percent of all defects, variations, and
inconsistencies from any process.
Kaoru Ishikawa
65
Six Sigma Methodology
 Define
 Measure
 Analyze
 Improve
 Control
DMAIC
66
Basic Steps in Problem Solving
1. Define the problem and establish an
improvement goal
2. Collect data
3. Analyze the problem
4. Generate potential solutions
5. Choose a solution
6. Implement the solution
7. Monitor the solution to see if it
accomplishes the goal
67
 Process Improvement: A systematic
approach to improving a process
 Process mapping
 Analyze the process
 Redesign the process
Process Improvement
68
The Process Improvement Cycle
Implement the
Improved process
Select a
process
Study/document
Seek ways to
Improve it
Design an
Improved process
Evaluate
Document
69
Process Improvement and Tools
 Process improvement - a systematic approach
to improving a process
 Process mapping
 Analyze the process
 Redesign the process
 Tools
 There are a number of tools that can be used for
problem solving and process improvement
 Tools aid in data collection and interpretation, and
provide the basis for decision making
70
Methods for Generating Ideas
 Brainstorming
 Quality circles
 Interviewing
 Benchmarking
71
 Team approach – problem solving
groups where the workers have a say in
the performance of their tasks and in
the process of problem solving
 Participative management
Quality Circles
72
 Identify a critical process that needs
improving
 Identify an organization that excels in
this process
 Contact that organization
 Analyze the data
 Improve the critical process
Benchmarking Process
73
74
END

unit -5 Quality Management and Control.ppt

  • 1.
  • 2.
    2 Defining Quality  Definitionof quality is dependent on the people defining it  There is a lack of a single, universal definition of quality  5 common definitions include  Conformance to specifications  Fitness for use  Value for price paid  Support services  Psychological criteria
  • 3.
    3 Defining Quality –5 Ways  Conformance to specifications  Does product/service meet targets and tolerances defined by designers?  Fitness for use  Evaluates performance for intended use  Value for price paid  Evaluation of usefulness vs. price paid  Support services  Quality of support after sale  Psychological  e.g. Ambiance, prestige, friendly staff
  • 4.
    4 Manufacturing Quality vs.Service Quality  Manufacturing quality focuses on tangible product features  Conformance, performance, reliability, features  Service organizations produce intangible products that must be experienced  Quality often defined by perceptional factors like courtesy, friendliness, promptness, little waiting time, consistency
  • 5.
    5 Cost of Quality Quality affects all aspects of the organization  Quality has dramatic cost implications of;  Quality control costs  Prevention costs  Appraisal costs  Quality failure costs  Internal failure costs  External failure costs
  • 6.
    6 Cost of Quality– 4 Categories  Early detection/prevention is less costly  May be less by a factor of 10
  • 7.
    7 Evolution of TQM– New Focus
  • 8.
  • 9.
    Evolution of QualityManagement  1924 - Statistical process control charts  1930 - Tables for acceptance sampling  1940’s - Statistical sampling techniques  1950’s - Quality assurance/TQC  1960’s - Zero defects  1970’s - Quality assurance in services 9
  • 10.
    Quality Assurance vs.Strategic Approach  Quality Assurance  Emphasis on finding and correcting defects before reaching market  Strategic Approach  Proactive, focusing on preventing mistakes from occurring  Greater emphasis on customer satisfaction 10
  • 11.
    Dimensions of Quality Performance - main characteristics of the product/service  Aesthetics - appearance, feel, smell, taste  Special Features - extra characteristics  Conformance - how well product/service conforms to customer’s expectations  Reliability - consistency of performance 11
  • 12.
    Dimensions of Quality(Cont’d)  Durability - useful life of the product/service  Perceived Quality - indirect evaluation of quality (e.g. reputation)  Serviceability - service after sale 12
  • 13.
    Examples of QualityDimensions Dimension 1. Performance 2. Aesthetics 3. Special features (Product) Automobile Everything works, fit & finish Ride, handling, grade of materials used Interior design, soft touch Gauge/control placement Cellular phone, CD player (Service) Auto Repair All work done, at agreed price Friendliness, courtesy, Competency, quickness Clean work/waiting area Location, call when ready Computer diagnostics
  • 14.
    Examples of QualityDimensions (Cont’d) Dimension 5. Reliability 6. Durability 7. Perceived quality 8. Serviceability (Product) Automobile Infrequency of breakdowns Useful life in miles, resistance to rust & corrosion Top-rated car Handling of complaints and/or requests for information (Service) Auto Repair Work done correctly, ready when promised Work holds up over time Award-winning service department Handling of complaints
  • 15.
    Service Quality  Tangibles Convenience  Reliability  Responsiveness  Time  Assurance  Courtesy 15
  • 16.
    Examples of ServiceQuality Dimension Examples 1. Tangibles Were the facilities clean, personnel neat? 2. Convenience Was the service center conveniently located? 3. Reliability Was the problem fixed? 4. Responsiveness Were customer service personnel willing and able to answer questions? 5. Time How long did the customer wait? 6. Assurance Did the customer service personnel seem knowledgeable about the repair? 7. Courtesy Were customer service personnel and the cashier friendly and courteous?
  • 17.
    The Consequences ofPoor Quality  Loss of business  Liability  Productivity  Costs 17
  • 18.
     Top management Design  Procurement  Production/operations  Quality assurance  Packaging and shipping  Marketing and sales – don’t promise what u cannot deliver  Customer service Responsibility for Quality 18
  • 19.
     Substandard work Defective products  Substandard service  Poor designs  Shoddy workmanship  Substandard parts and materials Ethics and Quality Having knowledge of this and failing to correct and report it in a timely manner is unethical. 19
  • 20.
  • 21.
    Malcolm Baldrige NationalQuality Award In recognition of the contribution of Commerce Secretary of Pres. Regan - 1987: weights given 1.0 Leadership (125 points) 2.0 Strategic Planning (85 points) 3.0 Customer and Market Focus (85 points) 4.0 Information and Analysis (85 points) 5.0 Human Resource Focus (85 points) 6.0 Process Management (85 points) 7.0 Business Results (450 points) 21
  • 22.
    Benefits of BaldrigeCompetition  Financial success  Winners share their knowledge  The process motivates employees  The process provides a well-designed quality system  The process requires obtaining data  The process provides feedback 22
  • 23.
    European Quality Award Prizes intended to identify role models  Leadership  Customer focus  Corporate social responsibility  People development and involvement  Results orientation 23
  • 24.
    The Deming Prize Honoring W. Edwards Deming  Japan’s highly coveted award  Main focus on statistical quality control 24
  • 25.
    Quality Certification  ISO9000  Set of international standards on quality management and quality assurance, critical to international business  ISO 14000  A set of international standards for assessing a company’s environmental performance 25
  • 26.
    ISO 9000 QualityManagement Principles  A systems approach to management  Continual improvement  Factual approach to decision making  Mutually beneficial supplier relationships  Customer focus  Leadership  People involvement  Process approach 26
  • 27.
     ISO 14000- A set of international standards for assessing a company’s environmental performance  Standards in three major areas  Management systems  Operations  Environmental systems ISO 14000 27
  • 28.
     Management systems Systems development and integration of environmental responsibilities into business planning  Operations  Consumption of renewable natural resources and clean energy  Environmental systems  Measuring, assessing and managing emissions, and other waste ISO 14000 28
  • 29.
    Total Quality Management Aphilosophy that involves everyone in an organization in a continual effort to improve quality and achieve customer satisfaction. T Q M 29
  • 30.
    1. Find outwhat the customer wants 2. Design a product or service that meets or exceeds customer wants 3. Design processes that facilitates doing the job right the first time 4. Keep track of results 5. Extend these concepts to suppliers The TQM Approach 30
  • 31.
    Elements of TQM Continual improvement  Competitive benchmarking  Employee empowerment  Team approach  Decisions based on facts  Knowledge of tools  Supplier quality  Champion  Quality at the source 31
  • 32.
    Quality at theSource The philosophy of making each worker responsible for the quality of his or her work. 32
  • 33.
    33 TQM Philosophy  TQMFocuses on identifying quality problem root causes  Encompasses the entire organization  Involves the technical as well as people  Relies on seven basic concepts of  Customer focus  Continuous improvement  Employee empowerment  Use of quality tools  Product design  Process management  Managing supplier quality
  • 34.
    34 TQM Philosophy -concepts  Focus on Customer  Identify and meet customer needs  Stay tuned to changing needs, e.g. fashion styles  Continuous Improvement  Philosophy that seeks to make never-ending improvements to the process of converting inputs into outputs.  Kaizen: Japanese word for continuous improvement.  Benchmarking  Employee Empowerment  Empower all employees; external and internal customers
  • 35.
    35 TQM Philosophy– Concepts(continued)  Team Approach  Teams formed around processes – 8 to 10 people  Meet weekly to analyze and solve problems  Understanding Quality Tools  Ongoing training on analysis, assessment, and correction, & implementation tools  Studying practices at “best in class” companies  Plan-Do-Study-Act
  • 36.
    36 Ways of ImprovingQuality  Plan-Do-Study-Act Cycle (PDSA)  Also called the Deming Wheel after originator  Circular, never ending problem solving process  Seven Tools of Quality Control  Tools typically taught to problem solving teams  Quality Function Deployment  Used to translate customer preferences to design
  • 37.
    37 PDSA Details  Plan Evaluate current process  Collect procedures, data, identify problems  Develop an improvement plan, performance objectives  Do  Implement the plan – trial basis  Study  Collect data and evaluate against objectives  Act  Communicate the results from trial  If successful, implement new process
  • 38.
    38 PDSA (continued)  Cycleis repeated  After act phase, start planning and repeat process
  • 39.
    39 Seven Tools ofQuality Control  Cause-and-Effect Diagrams  Flowcharts  Checklists  Control Charts  Scatter Diagrams  Pareto Analysis  Histograms
  • 40.
    40 Cause-and-Effect Diagrams  CalledFishbone Diagram  Focused on solving identified quality problem
  • 41.
    41 Flowcharts  Used todocument the detailed steps in a process  Often the first step in Process Re-Engineering
  • 42.
    42 Checklist  Simple datacheck-off sheet designed to identify type of quality problems at each work station; per shift, per machine, per operator
  • 43.
    43 Control Charts  Importanttool used in Statistical Process Control  The UCL and LCL are calculated limits used to show when process is in or out of control
  • 44.
    44 Scatter Diagrams  Agraph that shows how two variables are related to one another  Data can be used in a regression analysis to establish equation for the relationship
  • 45.
    45 Pareto Analysis  Techniquethat displays the degree of importance for each element  Named after the 19th century Italian Mathematician & economist  Often called the 80-20 Rule  Principle is that quality problems are the result of only a few problems e.g. 80% of the problems caused by 20% of causes
  • 46.
    46 Histograms  A chartthat shows the frequency distribution of observed values of a variable like service time at a bank drive-up window  Displays whether the distribution is symmetrical (normal) or skewed
  • 47.
    47 Product Design -Quality Function Deployment  Critical to ensure product design meets customer expectations  Useful tool for translating customer specifications into technical requirements is Quality Function Deployment (QFD)  QFD encompasses  Customer requirements  Competitive evaluation  Product characteristics  Relationship matrix  Trade-off matrix  Setting Targets
  • 48.
  • 49.
    49 Quality Function Deployment (QFD)Details  Process used to ensure that the product meets customer specifications Voice of the engineer Voice of the customer Customer-based benchmarks
  • 50.
    50 QFD - Houseof Quality  Adding trade-offs, targets & developing product specifications Trade-offs Targets Technical Benchmarks
  • 51.
    51 Reliability – criticalto quality  Reliability is the probability that the product, service or part will function as expected  No product is 100% certain to function properly  Reliability is a probability function dependent on sub-parts or components
  • 52.
    52 Reliability – criticalto quality  Reliability of a system is the product of component reliabilities RS = (R1) (R2) (R3) . . . (Rn) RS = reliability of the product or system R1 = reliability of the components
  • 53.
    53 Reliability – criticalto quality  Increase reliability by placing components in parallel  Parallel components allow system to operate if one or the other fails
  • 54.
    54 Process Management  Qualityproducts come from quality sources  Quality must be built into the process  Quality at the source is belief that it is better to uncover source of quality problems and correct it  TQM extends to quality of product from company’s suppliers
  • 55.
     Lack of: Company-wide definition of quality  Strategic plan for change  Customer focus  Real employee empowerment  Strong strong motivation  Time to devote to quality initiatives  Leadership Obstacles to Implementing TQM 55
  • 56.
     Poor inter-organizationalcommunication  View of quality as a “quick fix”  Emphasis on short-term financial results  Internal political and “turf” wars Obstacles to Implementing TQM 56
  • 57.
    Criticisms of TQM Blind pursuit of TQM programs  Quality-related decisions may not be tied to market performance  Failure to carefully plan a program 57
  • 58.
    Six Sigma  Statistically Having no more than 3.4 defects per million  Conceptually  Program designed to reduce defects  Requires the use of certain tools and techniques 58
  • 59.
    Six Sigma –Meaning & Terminology  Six Sigma - A business management strategy for improving the quality of process outputs by identifying and removing the causes of defects and variation in the processes.  Sigma A Greek letter (σ) that is used to represent standard deviation, a measure of variation in a statistical population.  The term is used in Six Sigma methodology process to represent 99.9997% consistency—six standard deviations between the process mean and the nearer of two specification limits. 59
  • 60.
    Six Sigma –Meaning & Terminology  Defects per million opportunities (DPMO) - A standard measurement in Six Sigma methodology, used to facilitate measurement and comparison of processes.  Defect - Any undesired result or any variation in a required characteristic that does not conform to requirements.  Opportunity - Any area within a product, a service, or a process in which a defect could occur. 60
  • 61.
    Six Sigma Programs Six Sigma programs  Improve quality  Save time  Cut costs  Employed in critical areas such as  Design  Production  Service  Inventory management  Delivery 61
  • 62.
    Six Sigma Management Providing strong leadership  Defining performance metrics  Selecting projects likely to succeed  Selecting and training appropriate people 62
  • 63.
    Six Sigma Technical Improving process performance  Reducing variation  Utilizing statistical models  Designing a structured improvement strategy 63
  • 64.
    Six Sigma Team Top management  Program champions  Master “black belts” - Champion  “Black belts” – Project Sponsor  “Green belts” – Process Owner 64
  • 65.
    Six Sigma -Tools  The seven basic tools— flow charts, cause- and-effect diagrams, Pareto charts, histograms, scatter diagrams, run charts, and control charts—are sufficient for removing 95 percent of all defects, variations, and inconsistencies from any process. Kaoru Ishikawa 65
  • 66.
    Six Sigma Methodology Define  Measure  Analyze  Improve  Control DMAIC 66
  • 67.
    Basic Steps inProblem Solving 1. Define the problem and establish an improvement goal 2. Collect data 3. Analyze the problem 4. Generate potential solutions 5. Choose a solution 6. Implement the solution 7. Monitor the solution to see if it accomplishes the goal 67
  • 68.
     Process Improvement:A systematic approach to improving a process  Process mapping  Analyze the process  Redesign the process Process Improvement 68
  • 69.
    The Process ImprovementCycle Implement the Improved process Select a process Study/document Seek ways to Improve it Design an Improved process Evaluate Document 69
  • 70.
    Process Improvement andTools  Process improvement - a systematic approach to improving a process  Process mapping  Analyze the process  Redesign the process  Tools  There are a number of tools that can be used for problem solving and process improvement  Tools aid in data collection and interpretation, and provide the basis for decision making 70
  • 71.
    Methods for GeneratingIdeas  Brainstorming  Quality circles  Interviewing  Benchmarking 71
  • 72.
     Team approach– problem solving groups where the workers have a say in the performance of their tasks and in the process of problem solving  Participative management Quality Circles 72
  • 73.
     Identify acritical process that needs improving  Identify an organization that excels in this process  Contact that organization  Analyze the data  Improve the critical process Benchmarking Process 73
  • 74.