Download to read offline


![45 ■ School-based Assessments: What and How to Assess Reading
support the testing approach and interpretation of
the results. Reliability is the overall consistency of
a measure—i.e. whether the measure generates
similar results under consistent conditions either
within a sample of like learners or across repeated
measures (American Educational Research
Association [AERA] et al., 2014; Glaser et al., 2001).
To borrow an example from the health sector, a
blood-pressure cuff is a valid way of measuring
blood pressure. It is not a valid way of assessing
how much an individual weighs. The blood-pressure
cuff is a reliable measure if it consistently reports
similar or same results for the same individual or
like individuals under similar conditions. If it were to
give wildly different results for an individual in two
applications several minutes apart, it would not be
considered a reliable measure.
The validity of the EGRA is tied to (1) the conceptual
underpinning of the tool (and its inclusion of
valid subtasks of early reading skills) and (2) the
usefulness of the results in reporting on student
performance in early reading. Overall validity is
sometimes characterised using four key aspects:
construct, content, concurrent, and predictive
validity (AERA et al., 2014). The second edition of
the EGRA Toolkit (2015) provides a substantial list
of references for each of the subtasks that support
the construct and content validity of the approach
in English (the French and Spanish versions of the
toolkit provide additional information for the validity
of the measures in those languages) (Sprenger-
Charolles, 2009; Jiménez, 2009). For more details
regarding these references, see Appendix I.
The EGRA Tooklit, Second Edition can be
accessed here
The EGRA has also been a part of several
concurrent-validity studies. Concurrent validity is
shown when an assessment correlates with another
assessment that has been previously validated.
This gives conidence that the assessments are
measuring the same construct and the results are
valid. In this stratagem, researchers simultaneously
(or concurrently) administer two assessments
(usually of the same or similar construct and content)
to the same student, then compare the results.
Studies attempting to validate the EGRA against
other validated assessments have been conducted
in Peru (Kudo and Bazan, 2009), Honduras and
Nicaragua (Bazan and Gove, 2010). The Kudo and
Bazan study (2009) in particular comprehensively
reviewed oral and written assessment studies of
concurrent validity. Studies seeking to validate other
studies against the EGRA include assessments
conducted in India (Vagh, 2012) and Kenya (ACER,
2015). For additional information, please see also
Vagh’s article on concurrent validity in this volume.
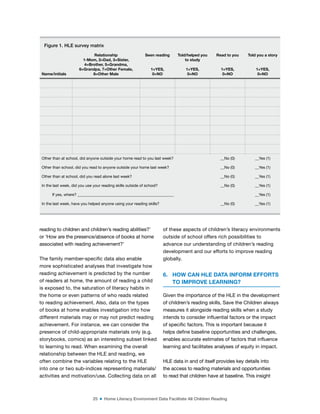
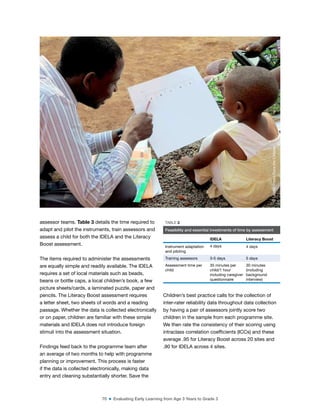
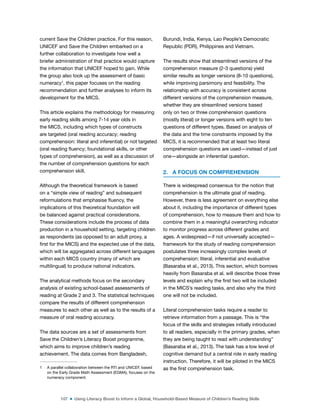
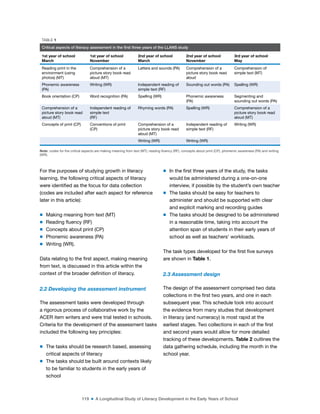
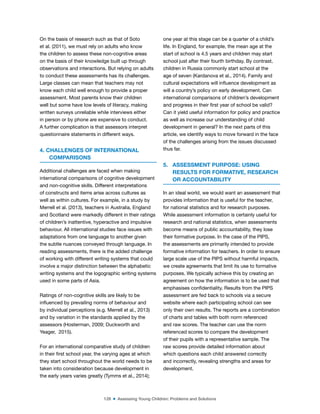
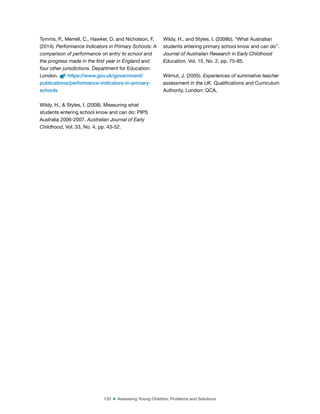
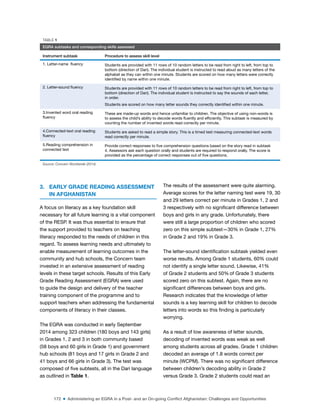
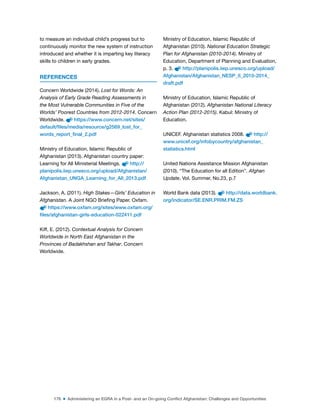
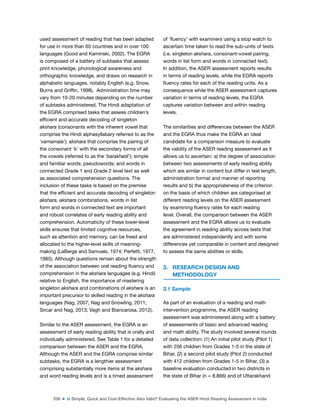
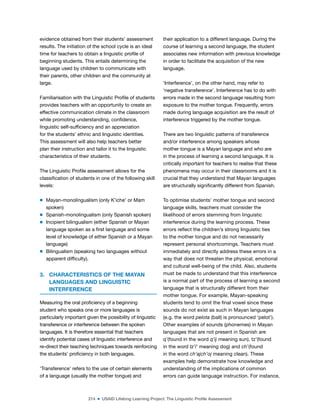
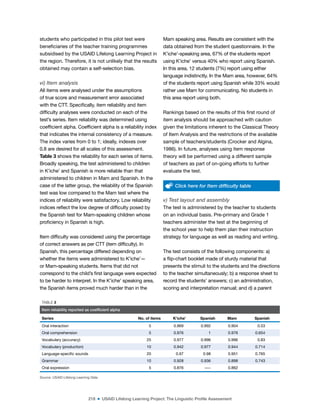
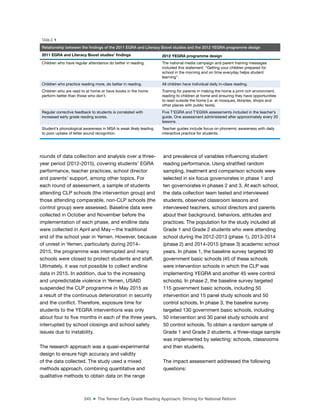
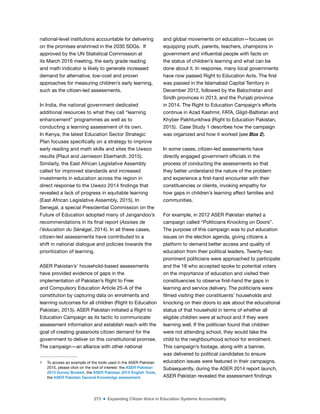
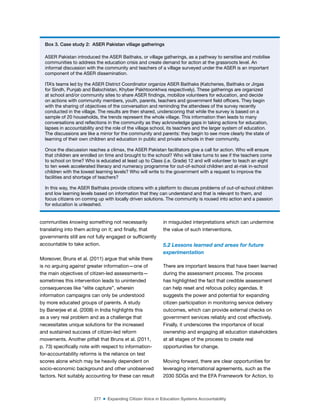
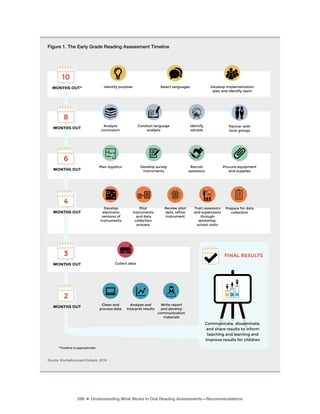
The correlations comparing the EGRA and other
assessments ranged from .41 to .98 and are
summarised in Table 2. The correlation coeficient
provides the strength of the linear relationship
between two variables, the closer to 1 the more
conidence one has that the assessments are
measuring the same construct. The high correlations
(.9–.97) are with other oral reading assessments from
India and Kenya. The Spanish assessments listed
were written tests, which accounts for medium-sized
correlations to the EGRA (.41–.47).
For details on how the studies were conducted,
please see the original reports (links available in the
reference list at the end of this article).
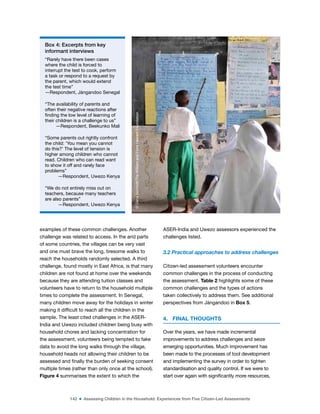
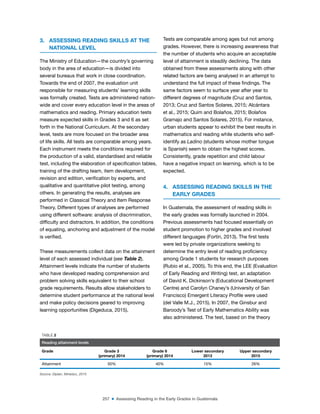
©
Dana
Schmidt/The
William
and
Flora
Hewlett
Foundation](https://image.slidesharecdn.com/understandingwhatworksinoralreading-220421155935/85/UNDERSTANDING_WHAT_WORKS_IN_ORAL_READING-pdf-46-320.jpg)
![50 ■ School-based Assessments: What and How to Assess Reading
REFERENCES
Aber, J.L. (under review). “Impacts of “Healing
Classrooms” on children’s reading and math skills
in DRC”. Journal of Research on Educational
Effectiveness.
ACER (2015). Report on the concurrent validity and
inter-rate reliability studies of Uwezo. Washington,
DC: Results for Development Institute (R4D).
Adams, M.J. (1990). Beginning to read: Thinking and
learning about print. Cambridge, MA: MIT Press.
Adelman, M., Baron, J.D., Blimpo, M., Evans,
D.K., Simbou, A. and Yarrow, N. (2015). Why
do students learn so little? Seeking answers
inside Haiti’s classrooms. World Bank Working
Paper 96500. Washington, DC: World Bank.
Retrieved from https://openknowledge.
worldbank.org/bitstream/handle/10986/22064/
Why0Do0student0e0Haiti0s0classrooms.
pdf?sequence=1
American Educational Research Association
(AERA), American Psychological Association,
National Council on Measurement in Education,
Joint Committee on Standards for Educational and
Psychological Testing [US]. (2014). Standards for
educational and psychological testing. Washington,
DC: American Educational Research Association.
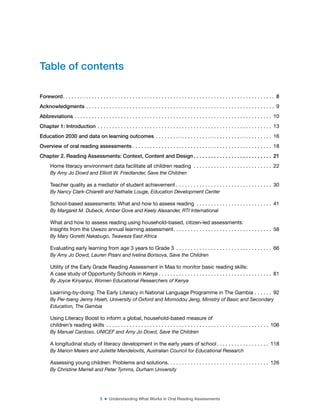
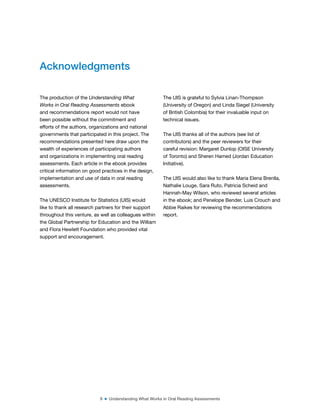
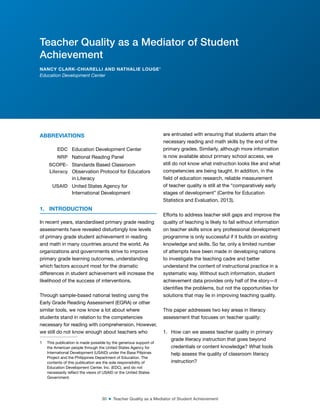
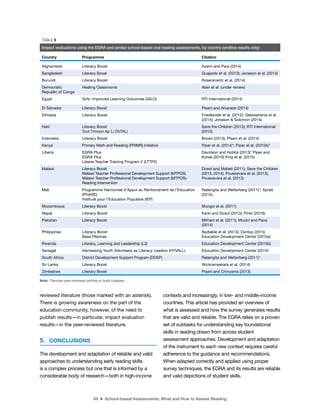
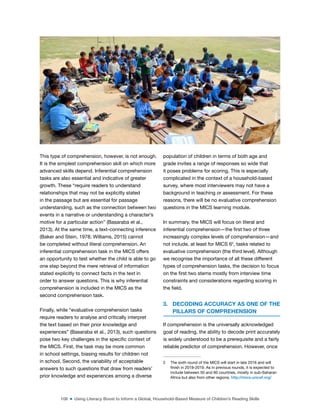
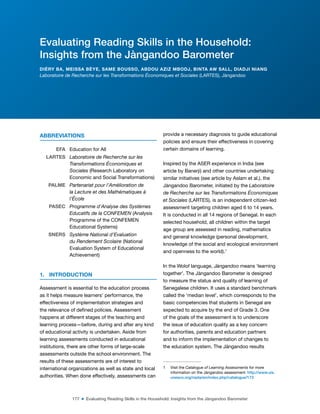
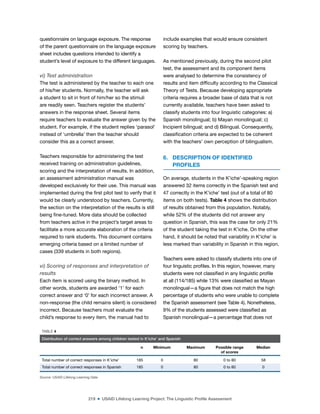
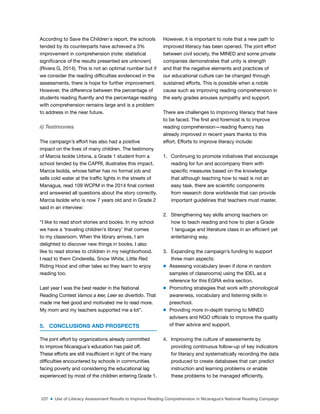
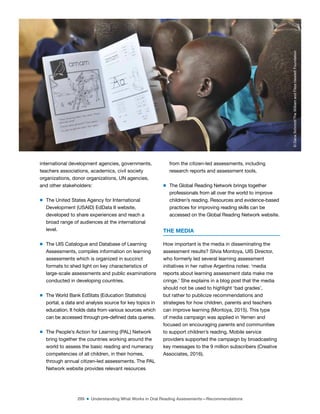
APPENDIX 1
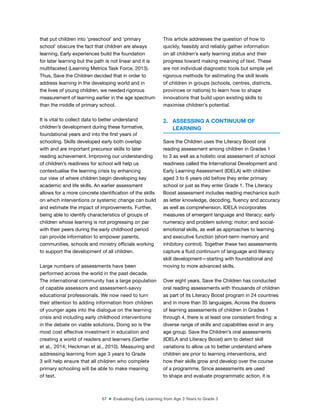
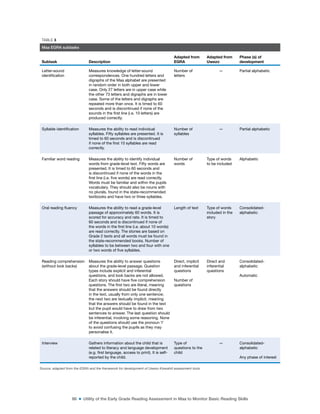
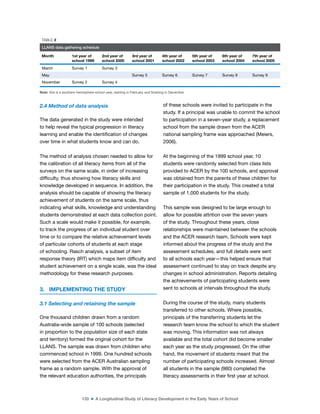
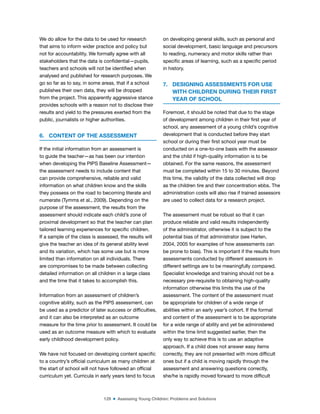
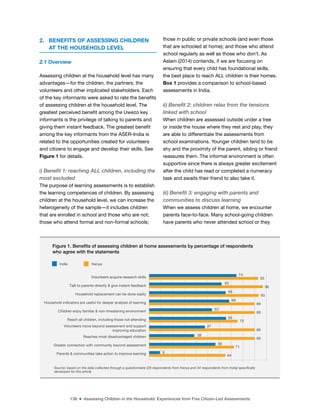
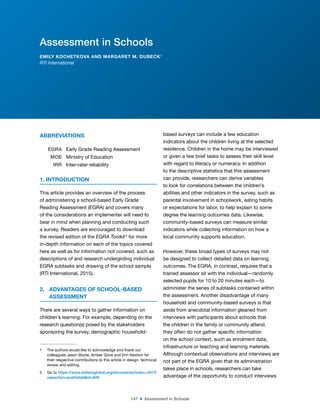
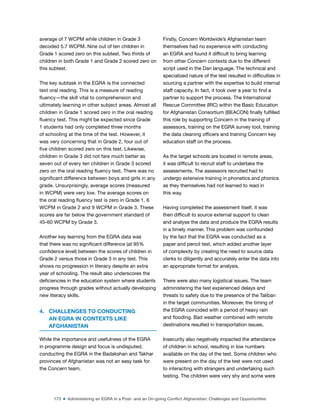
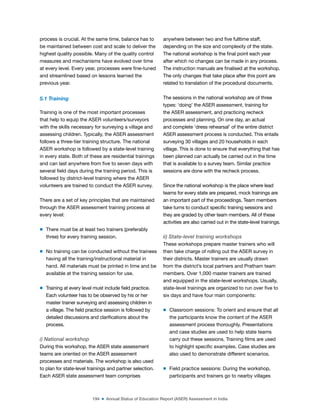
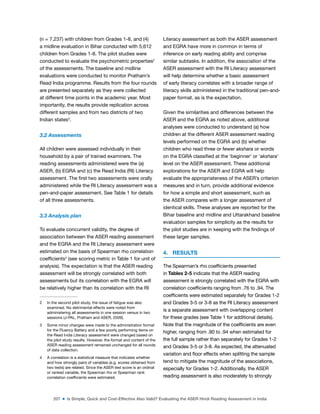
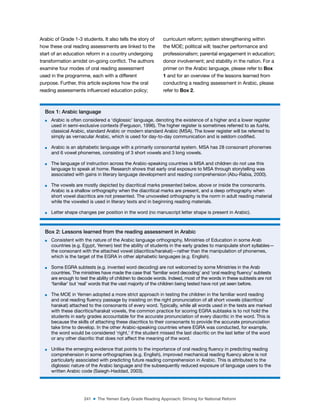
Research supporting the EGRA approach and subtasks
Foundational skill
Measured by EGRA
subtask(s):
Supporting research—direct excerpt from the EGRA Toolkit, 2nd edition
(RTI International, 2015)
Phonological
awareness
Initial sound identiication; initial
sound discrimination
Optional: phoneme (or syllable)
segmentation
Phonological awareness has been shown across numerous studies in
multiple languages to be predictive of later reading achievement (Badian,
2001; Denton et al., 2000; Goikoetxea, 2005; McBride-Chang and Kail, 2002;
Muter et al., 2004; Wang, Park and Lee, 2006).
Alphabetic principle
and alphabet
knowledge
Letter identiication (either by
letter names or letter sounds);
nonword reading; familiar word
reading; dictation
Optional: syllable identiication
Research has shown alphabet knowledge to be a strong early predictor of
later reading achievement (Adams, 1990; Ehri and Wilce, 1985; Piper and
Korda, 2010; Wagner et al.,, 1994; Yesil-Dağli, 2011) for both native and
nonnative speakers of a language (Chiappe et al., 2002; McBride-Chang and
Ho, 2005; Manis et al., 2004; Marsick and Watkins, 2001). One of the main
differences between successful readers and struggling readers is the ability
of successful readers to use the letter-sound correspondence to decode
new words they encounter in text and to encode (spell) the words they write
(Juel, 1991).
Vocabulary and oral
language
None directly but indirectly
measured by listening
comprehension
Optional: vocabulary (untimed)
Reading experts have suggested that vocabulary knowledge of between
90 and 95% of the words in a text is required for comprehension (Nagy and
Scott, 2000). It is not surprising then, that in longitudinal studies, vocabulary
has repeatedly been shown to inluence and be predictive of later reading
comprehension (Muter et al., 2004; Roth et al., 2002; Share and Leiken, 2004).
Fluency Oral reading luency with
comprehension
Timed and scored for speed
and accuracy: letter name
identiication, letter sound
identiication, nonword reading,
and familiar word reading
Numerous studies have found that reading comprehension has a relationship
to luency, especially in the early stages (Fuchs et al., 2001). For example,
tests of oral reading luency, as measured by timed assessments of correct
words per minute, have been shown to have a strong correlation (0.91)
with the reading comprehension subtest of the Stanford Achievement Test
(Fuchs et al., 2001). The importance of luency as a predictive measure does,
however, decline in the later stages. As students become more proicient
and automatic readers, vocabulary becomes a more important predictor of
later academic success (Yovanoff et al., 2005).
Comprehension Reading comprehension
Optional: maze; cloze
Research has not yet produced a proven means to consistently and
thoroughly test the higher-level and more nuanced comprehension skills in
a standardised way that could be accepted as valid and reliable. However,
options are under consideration and it is hoped that the measurement of
comprehension will continue to improve as this skill is one of the most
important measures of reading success.](https://image.slidesharecdn.com/understandingwhatworksinoralreading-220421155935/85/UNDERSTANDING_WHAT_WORKS_IN_ORAL_READING-pdf-51-320.jpg)
![56 ■ School-based Assessments: What and How to Assess Reading
Rosenkranz, E., Jonason, C. and Kajangwa, D.
(2014). Literacy Boost Burundi endline report,
August 2014. Washington, DC: Save the Children.
http://resourcecentre.savethechildren.se/
library/literacy-boost-burundi-endline-report-
august-2014
Roth, F.P., Speece, D.L. and Cooper, D.H. (2002). “A
longitudinal analysis of the connection between oral
language and early reading”. Journal of Educational
Research, Vol. 95, pp. 259-272.
RTI International. (2009). Early grade reading
assessment toolkit. Research Triangle Park,
NC: RTI International.
RTI International. (2013). The Primary Math and
Reading (PRIMR) Initiative: Annual report, 1
October 2012–31 September 2013. Prepared under
the USAID Education Data for Decision Making
(EdData II) Project. Research Triangle Park, NC: RTI.
http://pdf.usaid.gov/pdf_docs/PA00K262.pdf
RTI International. (2014). Girls’ Improved Learning
Outcomes: Final report. Research Triangle Park,
NC: RTI International. http://pdf.usaid.gov/
pdf_docs/pa00jtbc.pdf
RTI International. (2015). Early Grade Reading
Assessment toolkit, Second Edition, prepared
for USAID under the Education Data for Decision
Making (EdData II) project, Research Triangle
Park, NC: RTI. http://static1.squarespace.
com/static/55c4e56fe4b0852b09fa2f29/t/56
e0633545bf213c2b5269e5/1457546040584/
EGRA+Toolkit+Second+Edition_March_8_2016+.
pdf
RTI International (2015). Tout Timoun Ap Li - ToTAL
(All Children Reading) final report, REVISED, 2
August 2012–5 December 2014 [Haiti]. Prepared
under the Education Data for Decision Making
(EdData II) project. http://pdf.usaid.gov/pdf_
docs/PA00K911.pdf
RTI International and International Rescue
Committee (IRC). (2011). Guidance notes for
planning and implementing early grade reading
assessments. Washington, DC: RTI and IRC.
https://www.eddataglobal.org/reading/index.
cfm?fuseaction=pubDetail&id=318
Save the Children (2013). Reading is the future: Lekti
se lavni: baseline-endline assessments report [Haiti].
Washington, DC: Save the Children. http://
resourcecentre.savethechildren.se/library/
reading-future-lekti-se-lavni-baseline-endline-
assessments-report
Save the Children (2013). Save the Children
International Basic Education Program: TiANA
project endline report, 2013 [Malawi]. Washington,
DC: Save the Children. http://resourcecentre.
savethechildren.se/library/save-children-
international-basic-education-program-tiana-
project-endline-report-2013
Save the Children (2014). TiANA final evaluation
report for ST Anthony and Namadidi education zone,
Zormba rural, Malawi, September 2014. Washington,
DC: Save the Children. http://resourcecentre.
savethechildren.se/library/tiana-final-evaluation-
report-st-anthony-and-namadidi-education-zones-
zormba-rural-malawi
Seymour, P.H., Aro, M. and Erskine, J.M. (2003).
“Foundation literacy acquisition in European
orthographies”. British Journal of psychology, Vol.
94, No. 2, pp. 143-174.
Share, D.L. and Leikin, M. (2004). “Language
impairment at school entry and later reading
disability: Connections at lexical versus supralexical
levels of reading”. Scientific Studies of Reading, Vol.
8, pp. 87-110.](https://image.slidesharecdn.com/understandingwhatworksinoralreading-220421155935/85/UNDERSTANDING_WHAT_WORKS_IN_ORAL_READING-pdf-57-320.jpg)


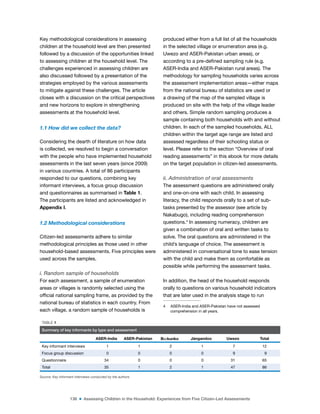

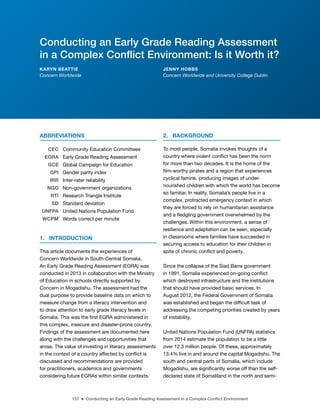


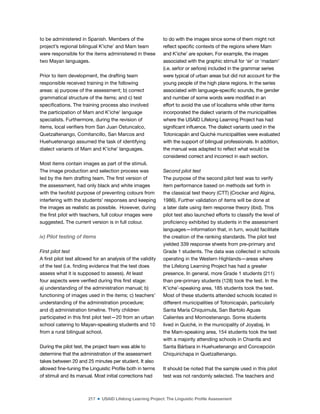
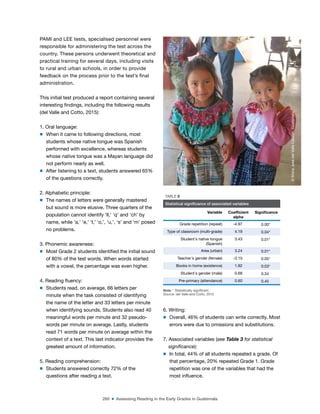
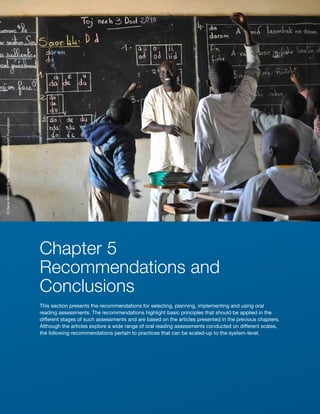
![203 ■ Is Simple, Quick and Cost-Effective Also Valid? Evaluating the ASER Hindi Reading Assessment in India
provide supporting evidence for the validity of the
ASER reading assessments, this paper presents the
content validity of the ASER reading assessment
and examines children’s concurrent performance on
the ASER Hindi reading assessment compared to
other assessments of reading. Data are drawn from
a large-scale randomised evaluation of Pratham’s1
reading and arithmetic intervention programme by
the Abdul Latif Jameel Poverty Action Lab (J-PAL)
for which the ASER reading assessment was used
along with a battery of other reading and arithmetic
assessments. Speciic and detailed comparisons are
made between the ASER reading assessment and
another widely prevalent model of assessing early
reading ability, the Early Grade Reading Assessment
(EGRA), which had been adapted for use in Hindi
(also see www.eddataglobal.org) (Dubeck
and Gove, 2015; Gove and Wetterberg, 2011). In
addition, the ASER is compared to the Read India
Literacy assessment, a pen-and-paper assessment
of children’s basic and advanced Hindi literacy skills.
2. VALIDITY IN THE CONTEXT OF THE
ASER READING ASSESSMENT
Validity indicates whether a test assesses what
it purports to assess and is an evaluation of a
test’s inference and not of the test per se. A test
can be put to different uses, such as examining
average school performance or making diagnostic
decisions for individual students. Each of these
uses or inferences “has its own degree of validity,
[and] one can never reach the simple conclusion
that a particular test ‘is valid’” (Cronbach, 1971,
p.447). Several forms of evidence are collected
to evaluate the validity of the inferences that are
based on the test results. As such, validity is an
accumulating body of evidence (AERA et al., 1985).
One form of evidence is content validity, which
indicates the extent to which the content is a
representative sample of the domain of interest and
whether it assesses the desired or targeted skills
1 Pratham is an Indian non-government organization working on
large scale to ensure that every child is in school and learning
well. Pratham runs a variety of programmes in 21 states
around India and works directly with communities and schools
as well as with governments to work towards these goals. See
www.pratham.org for more details.
and abilities. Another form of evidence, a common
empirical investigation termed “concurrent validity”
involves comparing performance on the assessment
of interest with performance on a comparable
assessment that serves as a criterion measure.
The criterion assessment is typically another
assessment of known psychometric properties
that assesses similar abilities or constructs. In
this study, as noted above, we are comparing the
performance on the ASER reading assessment with
children’s performance on the EGRA and the Read
India Literacy assessment. Strong and positive
associations between the three assessments will
contribute to evidence that serves as one part of
building a full validity argument for the ASER reading
assessment.
2.1 Content of the ASER reading assessment
The ASER reading assessment is designed to
capture children’s early reading skills in 20 Indian
languages. For the Indian orthographies, the basic
orthographic unit is the ‘akshara’, which represents
sounds at the syllable level with its constituent
parts encoding phonemic information. The akshara
can vary from simple to complex depending on
the extent of the phonemic information encoded.
The primary forms of vowels and consonants
with an inherent vowel that is unmarked comprise
the set of simple akshara and contrast with the
complex akshara that comprise ligatures that are
consonants with vowel markers or consonant
clusters with a marked or unmarked vowel. Given
that the ASER reading assessment is designed to
assess early and basic reading skills, its subtasks
assess children’s knowledge of the simple akshara,
ability to accurately decode simple words and
ability to luently read a Grade 1 and Grade 2 level
passage. The selection of the subtasks is based on
the premise that the acquisition of symbol-sound
mapping and the ability to decode symbol strings
are among the early set of skills that contribute to
reading in the Indian alphasyllabaries akin to the
alphabetic orthographies (Nag, 2007; Nag and
Snowling, 2011). Although the pace of acquisition
of the akshara tends to be extended given the
extensive set of orthographic units that children](https://image.slidesharecdn.com/understandingwhatworksinoralreading-220421155935/85/UNDERSTANDING_WHAT_WORKS_IN_ORAL_READING-pdf-204-320.jpg)
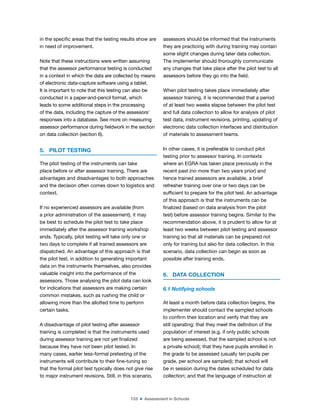
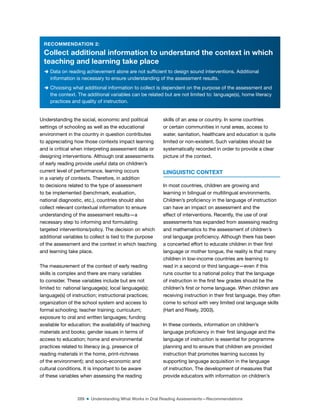
![232 ■ Use of Literacy Assessment Results to Improve Reading Comprehension in Nicaragua’s National Reading Campaign
The IPADE also created a baseline with two
indicators: luency and reading comprehension. The
EGRA’s short version was administered in 2014 in
20 schools in the municipality of Siuna located in
the RACN. The study covered 323 students—all the
children present in their Grade 1 classrooms when
the test was administered.
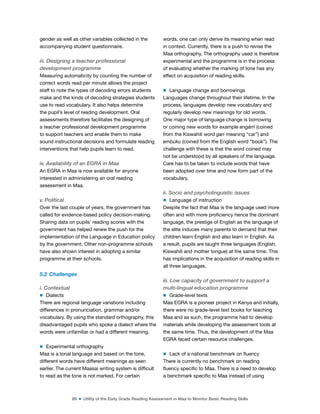
The baseline indicated that 42% of students
achieved the reading luency goal of 28 words
correct per minute (WCPM) in September—three
months before the end of the school year. The
assessment showed that 33% responded correctly
to the questions related to the passage read.
This gap of nearly 9% between the percentage of
students able to achieve luency and the percentage
of students who comprehend the passage has been
a constant during the campaign.
The assessments conducted during the ive years
of the campaign have yielded consistent results
showing that the number of students reaching
the luency goal always exceeds the number of
students who understood what they read. When
the campaign committee analysed this gap (9%
or more per year), it drew the conclusion that
comprehension limitations are probably linked to
a knowledge gap (Snow, 2015) associated with
several factors, including low levels of education of
children´s mothers, scarce enrolment in preschool
and malnutrition. Therefore, these children enter
Grade 1 with weaknesses in their oral vocabulary,
precursory literacy skills and have dificulties
making meaning from stories not related to their
context. Lending credence to this assumption,
the reading skills diagnosis performed in the
Caribbean in 2010 found that the percentage of
preschool attendance among Miskito children was
4% (Castro et al., 2010). Therefore, it is possible
that the literacy efforts that began six years ago
are helping to improve children’s decoding skills.
Despite improvements, greater efforts should
be made to close this knowledge gap, expand
children’s vocabulary and train them in the use of
strategies to improve comprehension. The results
found in a study performed by the Regional Child
Development Indicator Project (Verdisco et al., 2014)
in four Latin American countries also underscores
the need for greater efforts to improve learning. This
study measured, among other things, language and
communication development in children aged 2 to 4
years using the PEABODY test (IPTV) and the Engle
Scale. Nicaragua scored below the regional average
and was the country with the lowest average
score in the area of language and communication
development.
4.2 Quality of education should be everyone’s
concern: community and family participation
The research by the external consultant for Save
the Children demonstrated that the CAPRI´s work
over several years in the Vamos a Leer campaign
has promoted a qualitative leap in the participation
of families (Rivera, 2014). The campaign has helped
teachers involve parents in reading and telling
stories to their children. This initiative by the CAPRI
and other NGOs was sparked during the 2011
competition when parents borrowed books from
their friends and families to prepare their children
for the contest. The involvement of families in the
learning of children has driven parents to overcome
the tendency of only participating in logistical tasks
at the school, such as preparing meals and cleaning
the educational centres. A mother interviewed by
Rivera stated, “my role as a mother is to help them
study, help them with homework at home [...] the
teacher told us that families can support [children]
by reading, accompanying them when they’re doing
their homework tasks”.
World Vision has also been promoting parent training
to support inclusion and diminish drop out rates in
schools that enrol children living in extreme poverty.
In 2014, 288 parents and 888 children were trained.
Another interesting initiative to promote community
and family participation has been the creation of
Caminos Letrados (letter roads). Considering that
there are no advertising signs in rural areas and
that children’s exposure to printed letters is almost
nonexistent, World Vision designed a strategy to
encourage parents to create cardboard signs with
mottos and educational sentences for children to
read when walking to or from school.](https://image.slidesharecdn.com/understandingwhatworksinoralreading-220421155935/85/UNDERSTANDING_WHAT_WORKS_IN_ORAL_READING-pdf-233-320.jpg)
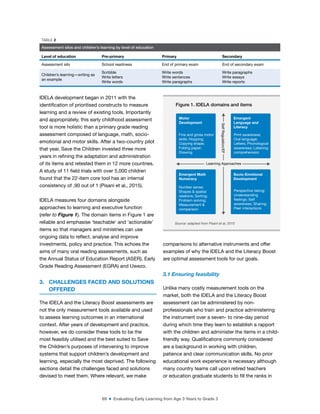
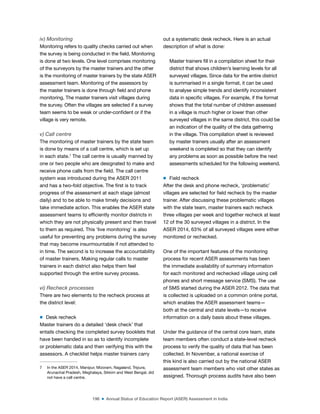
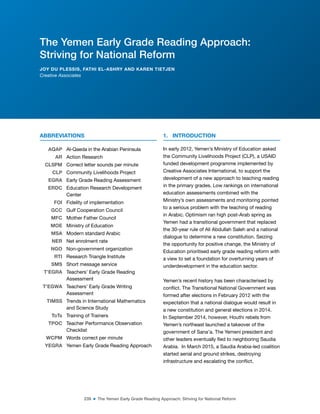
![234 ■ Use of Literacy Assessment Results to Improve Reading Comprehension in Nicaragua’s National Reading Campaign
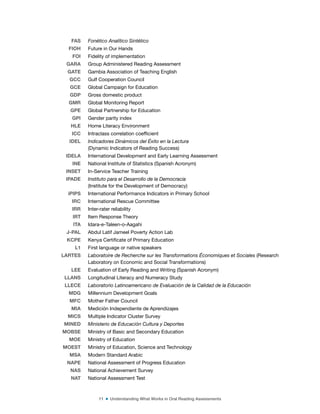
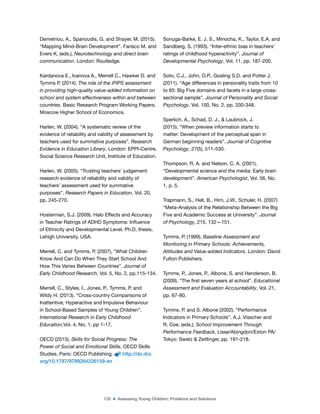
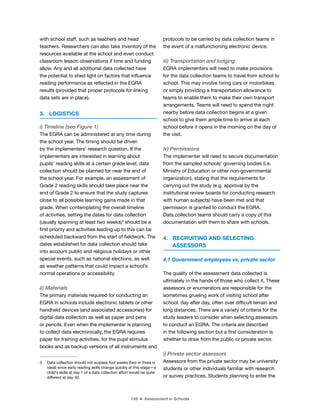
m Reading dificulties
m Phonological awareness and alphabetic code
m Fluency, vocabulary and reading comprehension
m Teaching strategies through play-like activities to
expand vocabulary and improve comprehension
m Strategies to improve reading habits and develop
a love for reading
m Reading process evaluation
m Management and use of the EGRA’s data
m How to develop education plans with appropriate
indicators using the EGRA’s data to improve
the teaching and learning of literacy skills in
kindergarten and the irst three grades of primary
school.
In 2015, Save the Children is tendering the repetition
of the training course—this time to be offered to
primary teachers in some of the municipalities
attended by its counterparts.
Three of CAPRI’s oficers took the course in
Managua along with six MINED advisers working in
the districts of Managua where the CAPRI provides
its services. The IPADE participated with four
representatives (two of its oficials and two MINED
advisors for Siuna).
This course and other trainings received by CAPRI
oficials have played a key role in expanding training
opportunities of “educational counselors and
MINED teachers” (Rivera, 2014). One of CAPRI’s
central activities is to support the team of MINED
educational advisers in Managua, providing them
with the opportunities to train in various literacy
teaching topics. Following each training session,
CAPRI and MINED departmental advisers and
technicians reproduce the workshop among district
advisors in Managua who in turn reproduce these
training efforts with principals and teachers.
Rivera quotes (2014) a pedagogical adviser stating,
“teachers are more encouraged to teach, thanks
to the teaching strategies and methodologies
provided to develop the content of school literacy
curricula”. Others teachers quoted stated that “the
trainings sponsored by CAPRI have provided us
with tools to strengthen the teaching of literacy
... as well as to seek students’ involvement in
learning” (Rivera, 2014).
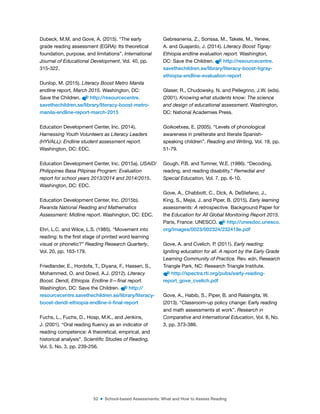
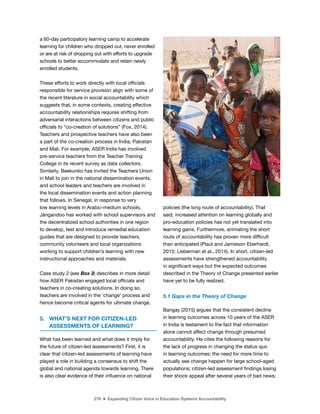
The mother of a child in a class of 52 students who
won the 2014 contest, placed a high value on the role
played by the teacher stating “the teacher played a
key role in children learning how to read. She was very
organized, identiied the children who were having
dificulties, sorted them by groups and explained what
they did not understand [...] they identiied letters,
divided syllables, did spelling, participated in the
board, and motivated them to read.”
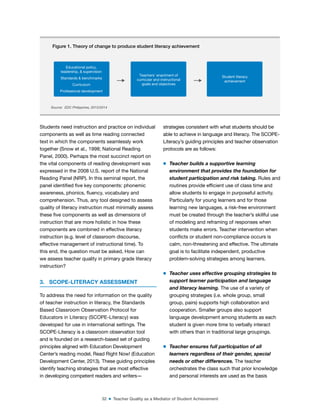
The training also contributed to a positive
atmosphere that encouraged reading in the
classroom. For example, in the Grade 1 classes
of the school República de El Salvador (multiple
winner in the reading campaign’s contest) in
Managua, the three classrooms visited by Rivera
(2014) with over 50 students each were in classes
called aulas letradas (literate classrooms) and all
three classes featured letters, numbers, images,
colors, clippings from magazines, newspapers and
posters on their walls. According to the teachers
interviewed, this setting helped the students
identify vowels and consonants as well as form
syllables and words.
The CAPRI has also trained librarians to help foster
a fun literacy learning culture, encourage the use
of libraries and maximise the number of children’s
books available. The goal of these trainings was to
encourage children to borrow books to take home
as a means of recreation and avoid the practice of
locking books away to prevent them from being
damaged (Rivera, 2014).
World Vision reported in 2014 that it has been
training teachers in the use of various methodologies
to improve literacy learning. In 2014, World Vision
provided teachers with several courses on the
development of preliterate preschool skills. One of the
courses called “playing, talking and drawing to learn
how read” was attended by 28 preschool teachers.
The focus of another course, “let’s venture into the
wonder of reading”, was to encourage children’s
reading habits and was taught to 101 teachers of](https://image.slidesharecdn.com/understandingwhatworksinoralreading-220421155935/85/UNDERSTANDING_WHAT_WORKS_IN_ORAL_READING-pdf-235-320.jpg)


The document provides recommendations for conducting oral reading assessments based on a collaborative project led by the UNESCO Institute for Statistics. It discusses key principles that should be applied in planning, designing, implementing, and using oral reading assessment data. The recommendations are drawn from several articles in an ebook that describe various oral reading assessments used around the world. The assessments discussed range from household-based citizen-led assessments to school-based assessments and focus on evaluating early reading skills from ages 3 to grade 3. The goal is to provide guidance to practitioners on best practices for selecting, administering, and using oral reading assessments to improve literacy outcomes.


