The document discusses predicting United Nations Millennium Development Goals indicators using World Bank macroeconomic data from 1972-2007 for 214 countries. It describes:
1) Cleaning the data by forward and backfilling missing values and extracting features over 5-year windows, creating a new dataset.
2) Applying linear regression with Lasso to the train-test split, obtaining cross validation scores from -4 to 0.99.
3) The next steps of applying exponential weighted moving average or Holt Winters methods to predict indicator values for 2008 and 2012, and splitting data into regions/countries.
Solution manual for managerial accounting 8th edition by john wild ken shaw b...
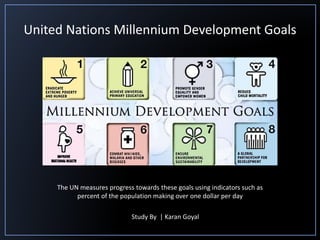
Study on United Nations Millennium Development Goals
1. The UN measures progress towards these goals using indicators such as
percent of the population making over one dollar per day
United Nations Millennium Development Goals
Study By | Karan Goyal
2. File Description
Training Data All the World Bank macroeconomic indicators as a zipped CSV
Submission Format The indicators that to predict and the format for predictions
DATA The World Bank provides free and open access to data about
development in countries around the globe
• Data for Years 1972-2007
• 214 Countries
• 1200 macroeconomic
indicators
• Over 195,000 rows of data
4. DATA CLEANING
• Intention is to not penalize or handicap a country for data that they were not setup or
ready to collect years ago. That means “null values not be treated as zero values”.
• Used ‘fillna’ to forward fill and back fill the missing data
i.e. filled the missing values with the value in the closest available location in that index
FEATURE EXTRACTION
• Created small windows of 5 years (35
years in total) for each series
• Added features of average, standard
deviation and entropy for each of those
windows
• Created a new dataset with 6,057,462
rows of data
5. MODEL
• Applied Linear Regression – Lasso, on the
train-test split of the new dataset
• Throughout the process, obtained
cross_val_scores ranging from -4 to +.99
• Needs to be fine-tuned
• Alternatively, use a different regression
technique
6. NEXT
• Study and apply the EWMA or Holt Winters Moving Average approach to this
dataset
• Predict the values of the indicators for the years 2008 and 2012
• Split the data into different Regions and Countries to study the impact of any
correlation on the predicted values