The document provides information for UGI Corporation's Q3 2015 earnings conference call, including:
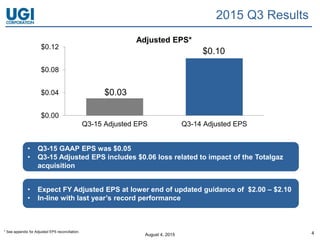
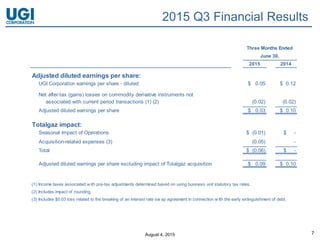
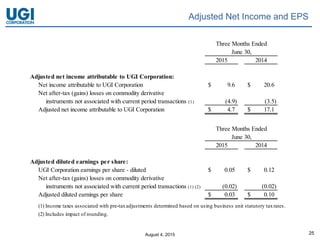
- UGI reported adjusted EPS of $0.03 compared to $0.10 in Q3 2014, impacted by a $0.06 loss from its Totalgaz acquisition.
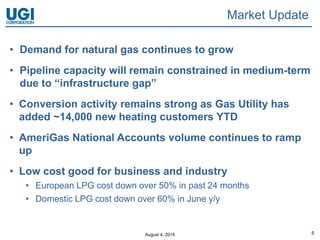
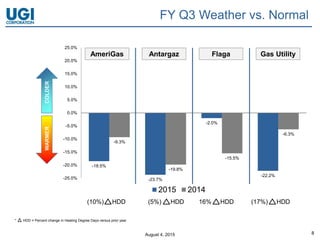
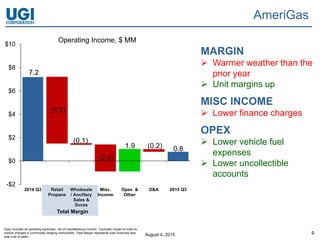
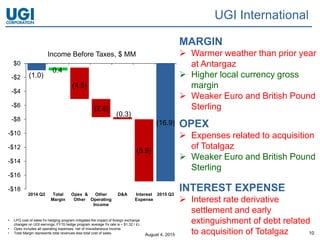
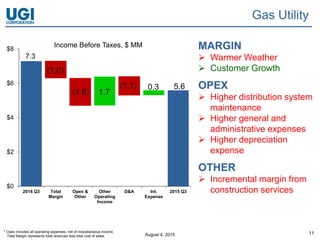
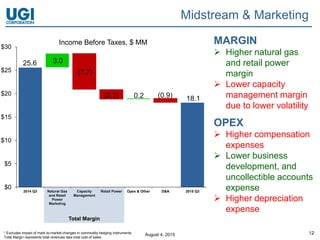
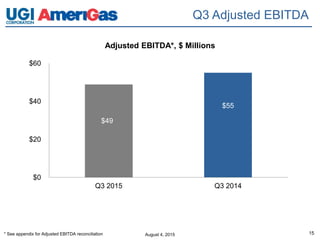
- Business segments like AmeriGas Propane, UGI International, and Midstream & Marketing saw lower earnings due to factors like warmer weather and currency impacts. The Gas Utility saw higher earnings from customer growth.
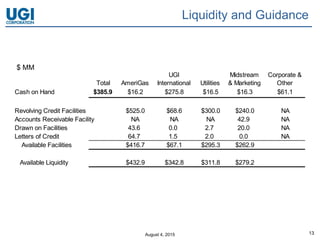
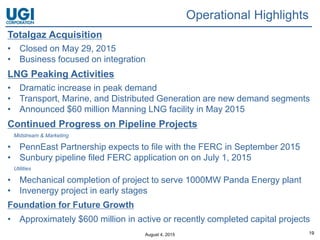
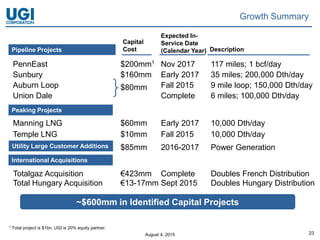
- UGI has available liquidity of $432.9 million and over $600 million in identified capital projects underway across its businesses to drive future growth.