SlideShare a Scribd company logo
1 of 9
Download to read offline
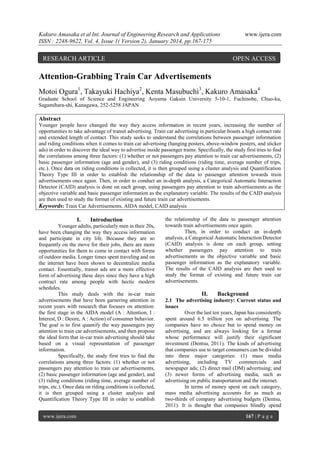
Kakuro Amasaka et al Int. Journal of Engineering Research and Applications
ISSN : 2248-9622, Vol. 4, Issue 1( Version 2), January 2014, pp.167-175
410121523

RESEARCH ARTICLE

www.ijera.com

OPEN ACCESS

Attention-Grabbing Train Car Advertisements
Motoi Ogura1, Takayuki Hachiya2, Kenta Masubuchi3, Kakuro Amasaka4
Graduate School of Science and Engineering Aoyama Gakuin University 5-10-1, Fuchinobe, Chuo-ku,
Sagamihara-shi, Kanagawa, 252-5258 JAPAN

Abstract
Younger people have changed the way they access information in recent years, increasing the number of
opportunities to take advantage of transit advertising. Train car advertising in particular boasts a high contact rate
and extended length of contact. This study seeks to understand the correlations between passenger information
and riding conditions when it comes to train car advertising (hanging posters, above-window posters, and sticker
ads) in order to discover the ideal way to advertise inside passenger trains. Specifically, the study first tries to find
the correlations among three factors: (1) whether or not passengers pay attention to train car advertisements, (2)
basic passenger information (age and gender), and (3) riding conditions (riding time, average number of trips,
etc.). Once data on riding conditions is collected, it is then grouped using a cluster analysis and Quantification
Theory Type III in order to establish the relationship of the data to passenger attention towards train
advertisements once again. Then, in order to conduct an in-depth analysis, a Categorical Automatic Interaction
Detector (CAID) analysis is done on each group, using passengers pay attention to train advertisements as the
objective variable and basic passenger information as the explanatory variable. The results of the CAID analysis
are then used to study the format of existing and future train car advertisements.
Keywords: Train Car Advertisements, AIDA model, CAID analysis

I.

Introduction

Younger adults, particularly men in their 20s,
have been changing the way they access information
and participate in city life. Because they are so
frequently on the move for their jobs, there are more
opportunities for them to come in contact with forms
of outdoor media. Longer times spent traveling and on
the internet have been shown to decentralize media
contact. Essentially, transit ads are a more effective
form of advertising these days since they have a high
contract rate among people with hectic modern
schedules.
This study deals with the in-car train
advertisements that have been garnering attention in
recent years with research that focuses on attention:
the first stage in the AIDA model (A : Attention, I :
Interest, D : Desire, A : Action) of consumer behavior.
The goal is to first quantify the way passengers pay
attention to train car advertisements, and then propose
the ideal form that in-car train advertising should take
based on a visual representation of passenger
information.
Specifically, the study first tries to find the
correlations among three factors: (1) whether or not
passengers pay attention to train car advertisements,
(2) basic passenger information (age and gender), and
(3) riding conditions (riding time, average number of
trips, etc.). Once data on riding conditions is collected,
it is then grouped using a cluster analysis and
Quantification Theory Type III in order to establish
www.ijera.com

the relationship of the data to passenger attention
towards train advertisements once again.
Then, in order to conduct an in-depth
analysis, a Categorical Automatic Interaction Detector
(CAID) analysis is done on each group, setting
whether passengers pay attention to train
advertisements as the objective variable and basic
passenger information as the explanatory variable.
The results of the CAID analysis are then used to
study the format of existing and future train car
advertisements.

II.

Background

2.1 The advertising industry: Current status and
issues
Over the last ten years, Japan has consistently
spent around 6.5 trillion yen on advertising. The
companies have no choice but to spend money on
advertising, and are always looking for a format
whose performance will justify their significant
investment (Dentsu, 2011). The kinds of advertising
that companies use to target consumers can be divided
into three major categories: (1) mass media
advertising, including TV commercials and
newspaper ads; (2) direct mail (DM) advertising; and
(3) newer forms of advertising media, such as
advertising on public transportation and the internet.
In terms of money spent on each category,
mass media advertising accounts for as much as
two-thirds of company advertising budgets (Dentsu,
2011). It is thought that companies blindly spend
167 | P a g e
Kakuro Amasaka et al Int. Journal of Engineering Research and Applications
ISSN : 2248-9622, Vol. 4, Issue 1( Version 2), January 2014, pp.167-175
massive amounts of money on mass media advertising
in order to get consumers’ attention—which they
believe is the only function of their promotional
efforts. What is needed is for companies to
quantitatively grasp the amount of publicity generated
by different forms of advertising media (Amasaka,
2005; Amasaka, 2007; Amasaka, 2010).
2.2 The study of advertising performance
In the past, many researchers have studied
consumer response patterns as a way of quantitatively
grasping advertising performance (Amasaka, 2009).
Numerous consumer response models, which predict
consumer behavior from the time they learn about a
new product through an ad until the time they
purchase it, have been offered. The most well-known
of these is probably the AIDA (Attention, Interest,
Desire, Action) model, which outlines a four-stage
consumer response pattern.
This model has been further developed
through applied research in recent years, with
alternative models such as the AIDMA (Attention,
Interest, Desire, Motive, Action) and AISAS
(Attention, Interest, Search, Action, Share) also being
proposed. Despite these variations, the one thing that
all of these models have in common is that the initial
step in consumer purchase behavior is always the
attention phase. Because of this, attention can be
considered the most critical element in the process
whereby consumers move towards actually making a
purchase (Ferrell and Hartline, 2005; Mehta, 2000;
Shimizu, 2004).
2.3 Transit advertisements: Current status
The number transit advertising opportunities

www.ijera.com

has increased in recent years. One of the major
characteristics of this form of ads is an extended
contact period. As Figure 1 shows, railway usage
peaks in the morning and evening. Between these two
periods, in the hours following 12 noon, train usage
and shopping activities follow essentially the same
line.
What this means is that the form of ads
consumers are most likely to come in contact with
while they are shopping is transit advertising, a
situation that creates major opportunities for these
advertisements to lead to purchases. Three key
characteristics of transit advertising are listed below
(The Kanto Transit Advertising Council, 2009).
1. For male and female teenagers (ages 10–19), group
1 men (age 30–34), and group 2 men (age 35–49),
transit advertising is a powerful form of media on par
with traditional mass-media advertising in terms of
having a good contact rate, long-term contact, and a
frequent contact rate.
2. After television, transit advertising scores higher
than all other forms of media in terms of natural,
habitual viewing, enjoyable viewing, generating
surprise or interest in viewers, and other positive
characteristics. For this reason, transit advertisements
have a powerful ability to draw consumers in, making
it difficult for viewers to overlook them.
3. Because they make appeals to consumers while they
are out of the house, transit advertisements are known
for having a powerful link to outside purchasing
behavior. The third most common source of new
product information after TV and shop displays,
transit advertising is a form of media that positions
itself
within
everyday
situations
and
locations—including buying situations.

Figure 1 The media contact situation according to the time on weekdays
www.ijera.com

168 | P a g e
Kakuro Amasaka et al Int. Journal of Engineering Research and Applications
ISSN : 2248-9622, Vol. 4, Issue 1( Version 2), January 2014, pp.167-175
The above characteristics give transit
advertising enormous potential when it comes to
influencing purchase behavior. This study takes the
insights gained from previous advertising research and
uses it to lay the foundation for future inquiries on this
important topic.
2.4 Prior research on transit advertisements
Even within the category of transit
advertising, in-car train advertisements are a
powerfully influential form of media that is placed
right in front of viewers for a certain period of
time—whether or not it captures their interest. Still,
the authors are not aware of that many studies that
have been done on train advertising relative to the
amount of research done on TV or newspaper
advertising.
Two examples of prior research on transit
advertising follow. The first study, A Look at
Subconscious Awareness in Train Car Advertising by
Gonda (2004), focused on the subconscious and saw
train advertising as a locally based form of media that
was both impactful and could be customized to suit
individual train lines or regions. Gonda felt that in-car
train advertising was a form of information that
improved the quality of life in local areas, and studied
the role of transit advertising as a conduit of local
information for passengers.
A second study by Takenaka and Harada
(2003) entitled A Study on Watching Professional
Baseball and Information Contact via Transit
Advertisements, focused on transit advertisements
that promoted professional baseball games, grouping
subjects into segments based on how frequently they
rode trains and looking at differences in the level of
information contact among the groups. The study then
examined how those differences affected game

www.ijera.com

watching.
The studies above did not look statistically at
the correlations between passenger information and
riding conditions. Noting this gap, the authors of this
study decided to examine those relationships and how
they relate to train car advertising with the aim of
defining the ideal format for this type of media.

III.

Proposing transit advertisements for
boosting ad awareness of passengers

3.1 Clarifying the relationships between basic
passenger information and riding conditions
As mentioned in the previous chapters, the
purpose of this study was to examine the correlations
between passenger information and riding conditions
in train car advertising in order to discover the ideal
way to advertise inside passenger trains. For the
purpose of this study, in-train advertisements were
divided into three different types based on external
appearance.
The
types
(No1.hanging
posters,
No2.above-window posters, and No6.stickers placed
to the side of doors) are shown in Figure 2. The
number of trains featuring digital advertisements is
increasing, but the authors chose to limit their
selection to these three based on an examination by a
professional market survey company, which indicated
that these ads are used on all major railways in the
Kanto region, marking them as representative forms of
media on every train line.
3.1.1 Field survey
In order to suggest ideal positioning for train
advertisements, the authors teamed up with the market
survey company mentioned above and a related
committee to produce a survey to collect information
from actual passengers. The interview-style survey

Figure 2 The type of in-train advertisements
www.ijera.com

169 | P a g e
Kakuro Amasaka et al Int. Journal of Engineering Research and Applications
ISSN : 2248-9622, Vol. 4, Issue 1( Version 2), January 2014, pp.167-175
was conducted multiple times on two urban train lines
(Line A and Line B) between late December 2005 and
early January 2006.
The number of valid response was 50 people
(26 were men and 24 were women ranged from 15 to
54 years). The survey asked passengers a series of
multiple-choice questions designed collect the basic
information needed to construct personal profiles of
the test subjects. Respondents were asked to select
their age, gender, time spent riding trains, and the
average number of weekly trips they made. Subjects
were also shown a diagram of a train interior and
asked to point out where they were in the train, what
position they took when riding, and whether they were
aware of the train advertisements (hanging posters,
above-window posters, and stickers to the sides of
doors).
The authors looked at the format of
questionnaires conducted by the marketing survey
company for reference (The Kanto Transit
Advertising Council, 2006). The data they collected
was analyzed and closely examined in order to
pinpoint trends that affected passenger’s attention
towards hanging posters, above-window posters, and
stickers. For each type of advertisements, subjects
were asked to respond in one of three ways: ―I saw it‖,
―I think I saw it‖, and ―I didn’t see it‖. The results
were used to assign an attention ratio to each form of
advertising by taking the total number of ―I saw it‖
and ―I think I saw it‖ responses as a percentage of the
total. The authors defined this value as the ―attention
rate‖ for that form of media.
3.2 Visualizing causal relationships between basic
passenger information and riding conditions using
multivariate analysis
The survey data used to examine the current
state of train car advertising in the previous section
was then subjected to a statistical analysis in order to
visually represent the correlations between passenger
information and riding conditions. The procedure and
goals of this analysis follow.
1. Look at overall trends in passenger information
using a cross tabulation method that focuses on
whether passenger attention turned to hanging posters,
above-window posters, or sticker advertisements.
2. Perform a cluster analysis on riding conditions and
group the results using Quantification Theory Type
III. Then, look at the relationship between (1) the
riding conditions grouped in the cross tabulation and
(2) whether passenger attention turned to hanging
posters,
above-window posters,
or
sticker
advertisements.
3. Run a CAID analysis on the grouped riding
condition data and basic passenger information to
determine how it relates to attention rates established
for the three types of advertising.
www.ijera.com

www.ijera.com

3.2.1 Visualizing causal relationships between
basic passenger information and ad awareness of
passengers (Analysis step 1)
In step 1 of the analysis, the authors
performed a cross tabulation on the survey data
collected in a previous section and researched the
correlations between whether passengers notice each
form of train car advertising (hanging, above-window,
and sticker) and passenger information (age and
gender) in order see how passenger information
relates to attention rates. As part of this process, the
age information from the surveys was grouped into
young (15–25), intermediate (26–40), and older (41
and up) age brackets.
Table 1 shows the results of the cross
tabulation for passenger information (age and gender)
and attention rates for each form of train car
advertising. The analysis revealed that younger
passengers looked at the hanging posters, while the
attention rate for older passengers was low. The
results were reversed for advertisements placed above
train windows, with older passengers paying close
attention to them. Sticker advertisements tended to be
noticed by women, and younger passengers in general
also tended to look at sticker advertisements.

Table 1 The cross tabulation for passenger
information and attention rates for each form of train
car ad
3.2.2 Visualizing causal relationships between
riding conditions and ad awareness of passengers
(Analysis step 2)
In this step, the authors used the survey data
gathered to represent current in-train advertising
conditions, subjected it to a cluster analysis, and then
used Quantification Theory Type III to group riding
conditions. They then looked for correlations between
the resulting data and whether passengers paid
attention to different types of train advertising.
The binary data on riding time (0–15 minutes,
16–45 minutes, 46 minutes or more), average number
of weekly trips (Less than two, two or three, four or
more), and riding position (standing or sitting) that
passengers provided during the survey was subjected

170 | P a g e
Kakuro Amasaka et al Int. Journal of Engineering Research and Applications
ISSN : 2248-9622, Vol. 4, Issue 1( Version 2), January 2014, pp.167-175

www.ijera.com

Figure 3 Cluster analysis of the ride condition

Figure 4 Quantification Theory Type III of the ride condition
to a Euclidean distance cluster analysis. The results of
this analysis are shown in Figure 3. It was found that
the eight types indicated in this dendrogram could be
separated into two groups.
www.ijera.com

Similar results were obtained when the
Quantification Theory Type III was used on the survey
data (Figure 4). Since the first group consisted of
standing passengers who ride the train for 0–15
171 | P a g e
Kakuro Amasaka et al Int. Journal of Engineering Research and Applications
ISSN : 2248-9622, Vol. 4, Issue 1( Version 2), January 2014, pp.167-175
minutes, they were labeled ―short-distance
passengers‖. The second group rode the train for a
longer period of time and tended to sit, so this group
was called the ―long-distance passengers‖.

Table 2 The cross tabulation for passenger
information and attention rates for each form of train
car ad after grouping
The passengers in each group were then
summarized, and this data was subjected to a cross
tabulation with awareness rate for hanging posters,
above-window posters, and sticker advertisements to
find the correlations (Table 2). The highest awareness
rates for the short-distance passenger group were on
hanging advertisements, followed by above-window
and sticker ads.
These short-term riders had higher awareness
rates overall than those in the long-distance group,
who showed similar results in that they were most
aware of hanging posters, followed by above-window
posters and stickers. They paid less attention to ads
overall than their short-term passenger counterparts.

www.ijera.com

3.2.3 Visualizing causal relationships between
basic passenger information, riding conditions and
ad awareness of passengers (Analysis step 3)
The
authors
then
examined
the
characteristics of the short-term and long-term
passenger groups defined in the previous section,
conducting a CAID analysis (Murayama, 1982) in
order to understand in-depth correlations involving
passenger information. The CAID analysis is to search
which variable is strongly correlated with criterion
variable on the basis of simultaneous distribution of
frequency data, and divide a sample population by the
category of the related high criterion variable.
Specifically, a CAID analysis was conducted
for each form of advertising (hanging, above-window,
and stickers next to doors) as it related to the two
groups discussed in the last section. The data collected
in the survey was used for the analysis, with
awareness rates for the different forms of advertising
used as criterion variables. Passenger information (age
and gender) was used for the explanatory variables. In
this way, the relationship between on-board riding
conditions and passenger information was analyzed.
Figure 5 shows some of the results from the
analysis. These are the results of the awareness rate for
hanging posters among short-term riders is used

Figure 5 Quantification Theory Type III of the ride condition

www.ijera.com

172 | P a g e
Kakuro Amasaka et al Int. Journal of Engineering Research and Applications
ISSN : 2248-9622, Vol. 4, Issue 1( Version 2), January 2014, pp.167-175

www.ijera.com

Table 3 The results of the CAID analysis on the short-term passenger group

as a criterion variable using the CAID analysis. The
results indicate that the highest awareness rate in this
group is among men in the youngest age category
(15–25). Table 3 shows the results of the CAID
analysis on the short-term passenger group.
A CAID analysis like the one in Table 3 was
similarly conducted for each type of media among the
long-term passenger group, with passenger
information designated as the explanatory variable.
Barring a few exceptions, the results indicate an
overall trend of awareness rates being higher among
the younger generations. Comparing the two groups,
the authors found that the short-term passengers (who
tended to stand when riding) had higher awareness
rates in general.
Passengers who sat, on the other hand, had
more opportunities to engage in different activities
during their ride, such as reading or doing work, which
probably contributed to their paying less attention to
advertisements than the passengers who were standing.
The analysis revealed that women passengers 26 and
older in particular did not look at in-car
advertisements. It also indicated that older passengers

www.ijera.com

frequently paid attention to advertisements located
above windows.

IV.

Proposing train car advertisements

Based on the results from the previous
section, the authors attempted to provide specifics on
an ideal format for train car advertisements. Figure 6
uses a picture to indicate the results of the CAID
analysis in a way that is easy to understand.
Awareness rates for hanging posters were high among
younger passengers and standing passengers, and the
difference between men and women was slight.
Both male and female members of the older
age group frequently paid attention to above-window
posters. Men 41 and over who sat while riding the
train, as well as women who stood while riding,
tended to view these advertisements the most.
Awareness rates for sticker advertisements were low
overall; however, younger riders frequently looked at
them, as did standing passengers. To summarize, train
car advertisements are most likely to catch the eye of
standing passengers, and the younger generation tends
to look at them the most.

173 | P a g e
Kakuro Amasaka et al Int. Journal of Engineering Research and Applications
ISSN : 2248-9622, Vol. 4, Issue 1( Version 2), January 2014, pp.167-175

www.ijera.com

Figure 6 Visualizing causal relationships between basic passenger information, riding conditions and ad
awareness of passengers
Based on these conclusions, the authors’ first
recommendation is for existing train car advertising.
Because hanging posters, stickers, and other in-car
advertisements are likely to attract younger riders, this
space should be used to advertise weekly manga
magazines, fashion magazines, sales, or other
products likely to appeal to this generation. Another
important consideration is using popular celebrities to
catch the eye of these passengers.
Above-window advertising space, on the
other hand, may be better used to appeal to those of the
older generation. These passengers are more likely to
be married and have children, so it may be beneficial
to feature family-friendly topics. Specifically, posters
advertising events for families or travel may be ideal
in this location. Also, because it was found that
standing passengers tend to look at advertisements
frequently, riders may pay attention not only to ads
that help them pass the time while standing, but also
those that stimulate their interest or desire. Instead of
showing just a picture, a magazine ad, for example,
could feature headlines or other clever designs aimed
at stimulating purchase behavior. It is important that
other advertisements do not simply catch the eye, but
encourage viewers to linger.
Secondly, the authors suggest that trains
adopt new forms of advertising media. The analysis
results indicated that passengers who stand tend to
have high awareness rates when it comes to in-car
advertising, but advertisements on the floor may be
www.ijera.com

easier for sitting passengers to see. Riders who sit
naturally allow their eyes to fall downward, making a
floor advertisement an eye-catching option. Those
who sit and read are also looking downward as well,
increasing the chances that they may see these
advertisements.

V.

Conclusion

Focusing on transit advertising which has a
good contact rate and long-term contact, the authors
decided to examine those relationships and how they
relate to train car advertising (hanging posters,
above-window posters, and sticker ads) with the aim
of defining the ideal format for this type of media.
Additional research must be done in order to
quantify how the attention captured through train car
advertising leads to other stages of purchasing
behavior. In addition, a strategic approach method that
actually drives consumers to purchase must be
considered. The effectiveness of other train-related
advertisements, such as in-car digital ads and exterior
train advertisements must be studied so that even
greater value can be obtained from transit advertising
media.

VI.

Acknowledgement

In this study, we appreciate the help received
from Nippon Research Center Co. Ltd. and the Kanto
Transit Advertising Council with cooperation.
174 | P a g e
Kakuro Amasaka et al Int. Journal of Engineering Research and Applications
ISSN : 2248-9622, Vol. 4, Issue 1( Version 2), January 2014, pp.167-175
References
Amasaka, K., (2005), ―Constructing a
Customer Science Application System
CS-CIANS - Development of a global
strategic vehicle Lexus utilizing New JIT -‖,
WSEAS Transactions on Business and
Economics, Issue 3, Vol.2, pp. 135-142.
[2]
Amasaka, K., (2007), ―The validity of
Advanced TMS - A strategic development
marketing system utilizing New JIT –‖, The
International Business & Economics
Research Journal, Vol.6, No.8, pp.35-42.
[3]
Amasaka, K., (2009), ―The effectiveness of
flyer advertising employing TMS: Key to
scientific automobile sales innovation at
Toyota‖, The Academic Journal of
China-USA Business Review, Vol.8, No.3,
pp.1-12.
[4]
Amasaka, K., (2010), ―Changes in marketing
process management employing TMS:
Establishment of Toyota Sales Marketing
System‖, The Academic Journal of
China-USA Business Review, Vol.10, No.7,
pp.539-550.
[5]
Dentsu, (2011), Advertisement expenses in
Japan (2011), http://www.dentsu.co.jp/
books/ad_cost/2011/index.html.
(in Japanese)
[6]
Dentsu, (2011), Advertisement expenses of
each media in Japan (2011), http:// www.
dentsu.co.jp/books/ad_cost/2011/media.html.
(in Japanese)
[7]
Ferrell, O.C., and Hartline, M., (2005),
Marketing Strategy, Thomson SouthWestern.
[8]
Gonda, M., (2004), (Master thesis) A study of
the latent function of train media: Focusing
on the index of the local society formed by
contact with train media, Tsukuba University
(Unpublished) (in Japanese).
[9] Murayama, T., et al. (1982), Analyzing CAID,
Marketing review: Japan research center, pp.
74-86 (in Japanese).
[10] Mehta, A., (2000), ―Advertising attitudes and
advertising effectiveness‖, Journal of
Advertising Research, Issue 3, Vol.40,
pp.67-72.
[11] Shimizu, K., (2004), Theory and Strategy of
Advertisement, Soseisha. (in Japanese)
[12] Takenaka, Y., and Harada, M., (2003), ―The
study of the degree of information contact by
the traffic advertisement and spectating
professional baseball games – Focusing on
Osaka Kintetsu Buffaloes-‖, Proceedings of
Osaka University of Health and Sport
Sciences, Vol.35, pp.15-23.

[13]

[1]

www.ijera.com

[14]

www.ijera.com

The Kanto Transit Advertising Council,
(2006), A Joint Survey of Transit
Advertising (March, 2006), http://www.
train-media.net/report/0502/adreport.pdf. (in
Japanese)
The Kanto Transit Advertising Council,
(2009), A Joint Survey of Transit
Advertising (March, 2009), http://www.
train-media.net/report/0612/0612.html. (in
Japanese)

175 | P a g e

More Related Content

What's hot

Millennials revisit intention based perceived value in the hospitality indust...
Millennials revisit intention based perceived value in the hospitality indust...Millennials revisit intention based perceived value in the hospitality indust...
Millennials revisit intention based perceived value in the hospitality indust...Assocaite Prof.Maher Hossny
 
6 zai n ul abideen final paper 55-65
6 zai n ul abideen final paper 55-656 zai n ul abideen final paper 55-65
6 zai n ul abideen final paper 55-65Alexander Decker
 
The Attitude of Students Towards T.V Advertisements on Economic and Social As...
The Attitude of Students Towards T.V Advertisements on Economic and Social As...The Attitude of Students Towards T.V Advertisements on Economic and Social As...
The Attitude of Students Towards T.V Advertisements on Economic and Social As...Associate Professor in VSB Coimbatore
 
The impact of online advertising on consumer buying behaviour towards mobile ...
The impact of online advertising on consumer buying behaviour towards mobile ...The impact of online advertising on consumer buying behaviour towards mobile ...
The impact of online advertising on consumer buying behaviour towards mobile ...rahul_yadav96
 
2 md. ashaduzzaman final(revised)--16-27
2 md. ashaduzzaman final(revised)--16-272 md. ashaduzzaman final(revised)--16-27
2 md. ashaduzzaman final(revised)--16-27Alexander Decker
 
Airline image and service quality effects on traveling customers’ behavioral ...
Airline image and service quality effects on traveling customers’ behavioral ...Airline image and service quality effects on traveling customers’ behavioral ...
Airline image and service quality effects on traveling customers’ behavioral ...Alexander Decker
 
Amr Salar Proposal Final
Amr Salar Proposal FinalAmr Salar Proposal Final
Amr Salar Proposal FinalSalar Bijili
 
Research Paper: Consumer Trust and Perceived Risk in B2C E Commerce
Research Paper: Consumer Trust and Perceived Risk in B2C E CommerceResearch Paper: Consumer Trust and Perceived Risk in B2C E Commerce
Research Paper: Consumer Trust and Perceived Risk in B2C E CommerceTanzir Islam
 
M reach presentation
M reach presentationM reach presentation
M reach presentationKumar Sarath
 
An evaluation of effectiveness of advertising in mobile telecommunication ind...
An evaluation of effectiveness of advertising in mobile telecommunication ind...An evaluation of effectiveness of advertising in mobile telecommunication ind...
An evaluation of effectiveness of advertising in mobile telecommunication ind...Chathura Abeysekara
 
3 ijaems sept-2015-4-mining consumer knowledge from shopping experience a ca...
3 ijaems sept-2015-4-mining consumer knowledge from shopping experience  a ca...3 ijaems sept-2015-4-mining consumer knowledge from shopping experience  a ca...
3 ijaems sept-2015-4-mining consumer knowledge from shopping experience a ca...INFOGAIN PUBLICATION
 
Preference central survey_fullreport
Preference central survey_fullreportPreference central survey_fullreport
Preference central survey_fullreportMarketingfacts
 
Co-Creation in Advertising and Marketing
Co-Creation in Advertising and MarketingCo-Creation in Advertising and Marketing
Co-Creation in Advertising and Marketingmtmoore22
 
An empirical study on effectiveness of sms marketing in developing countries ...
An empirical study on effectiveness of sms marketing in developing countries ...An empirical study on effectiveness of sms marketing in developing countries ...
An empirical study on effectiveness of sms marketing in developing countries ...Alexander Decker
 
Study on brand_preference_of_mobile_phon
Study on brand_preference_of_mobile_phonStudy on brand_preference_of_mobile_phon
Study on brand_preference_of_mobile_phonAkshay Thacholi
 
Perceived Influence of Perceived Salesperson Relationship and Customer Satisf...
Perceived Influence of Perceived Salesperson Relationship and Customer Satisf...Perceived Influence of Perceived Salesperson Relationship and Customer Satisf...
Perceived Influence of Perceived Salesperson Relationship and Customer Satisf...ijtsrd
 

What's hot (20)

Millennials revisit intention based perceived value in the hospitality indust...
Millennials revisit intention based perceived value in the hospitality indust...Millennials revisit intention based perceived value in the hospitality indust...
Millennials revisit intention based perceived value in the hospitality indust...
 
6 zai n ul abideen final paper 55-65
6 zai n ul abideen final paper 55-656 zai n ul abideen final paper 55-65
6 zai n ul abideen final paper 55-65
 
F0361043050
F0361043050F0361043050
F0361043050
 
The Attitude of Students Towards T.V Advertisements on Economic and Social As...
The Attitude of Students Towards T.V Advertisements on Economic and Social As...The Attitude of Students Towards T.V Advertisements on Economic and Social As...
The Attitude of Students Towards T.V Advertisements on Economic and Social As...
 
The impact of online advertising on consumer buying behaviour towards mobile ...
The impact of online advertising on consumer buying behaviour towards mobile ...The impact of online advertising on consumer buying behaviour towards mobile ...
The impact of online advertising on consumer buying behaviour towards mobile ...
 
2 md. ashaduzzaman final(revised)--16-27
2 md. ashaduzzaman final(revised)--16-272 md. ashaduzzaman final(revised)--16-27
2 md. ashaduzzaman final(revised)--16-27
 
Airline image and service quality effects on traveling customers’ behavioral ...
Airline image and service quality effects on traveling customers’ behavioral ...Airline image and service quality effects on traveling customers’ behavioral ...
Airline image and service quality effects on traveling customers’ behavioral ...
 
Consumer preferences for apparel and textile products
Consumer preferences for apparel and textile productsConsumer preferences for apparel and textile products
Consumer preferences for apparel and textile products
 
Amr Salar Proposal Final
Amr Salar Proposal FinalAmr Salar Proposal Final
Amr Salar Proposal Final
 
Research Paper: Consumer Trust and Perceived Risk in B2C E Commerce
Research Paper: Consumer Trust and Perceived Risk in B2C E CommerceResearch Paper: Consumer Trust and Perceived Risk in B2C E Commerce
Research Paper: Consumer Trust and Perceived Risk in B2C E Commerce
 
M reach presentation
M reach presentationM reach presentation
M reach presentation
 
An evaluation of effectiveness of advertising in mobile telecommunication ind...
An evaluation of effectiveness of advertising in mobile telecommunication ind...An evaluation of effectiveness of advertising in mobile telecommunication ind...
An evaluation of effectiveness of advertising in mobile telecommunication ind...
 
Seminar Paper
Seminar PaperSeminar Paper
Seminar Paper
 
Fatma cakir2
Fatma cakir2Fatma cakir2
Fatma cakir2
 
3 ijaems sept-2015-4-mining consumer knowledge from shopping experience a ca...
3 ijaems sept-2015-4-mining consumer knowledge from shopping experience  a ca...3 ijaems sept-2015-4-mining consumer knowledge from shopping experience  a ca...
3 ijaems sept-2015-4-mining consumer knowledge from shopping experience a ca...
 
Preference central survey_fullreport
Preference central survey_fullreportPreference central survey_fullreport
Preference central survey_fullreport
 
Co-Creation in Advertising and Marketing
Co-Creation in Advertising and MarketingCo-Creation in Advertising and Marketing
Co-Creation in Advertising and Marketing
 
An empirical study on effectiveness of sms marketing in developing countries ...
An empirical study on effectiveness of sms marketing in developing countries ...An empirical study on effectiveness of sms marketing in developing countries ...
An empirical study on effectiveness of sms marketing in developing countries ...
 
Study on brand_preference_of_mobile_phon
Study on brand_preference_of_mobile_phonStudy on brand_preference_of_mobile_phon
Study on brand_preference_of_mobile_phon
 
Perceived Influence of Perceived Salesperson Relationship and Customer Satisf...
Perceived Influence of Perceived Salesperson Relationship and Customer Satisf...Perceived Influence of Perceived Salesperson Relationship and Customer Satisf...
Perceived Influence of Perceived Salesperson Relationship and Customer Satisf...
 

Viewers also liked (20)

V4102176181
V4102176181V4102176181
V4102176181
 
S4102152159
S4102152159S4102152159
S4102152159
 
P4102112120
P4102112120P4102112120
P4102112120
 
F41023946
F41023946F41023946
F41023946
 
Herramientas para el trabajo colaborativo
Herramientas para el trabajo colaborativoHerramientas para el trabajo colaborativo
Herramientas para el trabajo colaborativo
 
MaryDiltsresume2012
MaryDiltsresume2012MaryDiltsresume2012
MaryDiltsresume2012
 
Cystite femme
Cystite femmeCystite femme
Cystite femme
 
Fotografías de National Geographic
Fotografías de National GeographicFotografías de National Geographic
Fotografías de National Geographic
 
LaTiaradiCervo
LaTiaradiCervoLaTiaradiCervo
LaTiaradiCervo
 
Profile_Bengal Indigoltd
Profile_Bengal IndigoltdProfile_Bengal Indigoltd
Profile_Bengal Indigoltd
 
FreeXBook - Oficial Presentation
FreeXBook - Oficial PresentationFreeXBook - Oficial Presentation
FreeXBook - Oficial Presentation
 
Apresentação do sistema de consorcios
Apresentação do sistema de consorciosApresentação do sistema de consorcios
Apresentação do sistema de consorcios
 
Jose Jorge's 8 LtrsRec
Jose Jorge's 8 LtrsRecJose Jorge's 8 LtrsRec
Jose Jorge's 8 LtrsRec
 
Sept2016 sv 10_x
Sept2016 sv 10_xSept2016 sv 10_x
Sept2016 sv 10_x
 
Aula 1 demonstrativa
Aula 1 demonstrativaAula 1 demonstrativa
Aula 1 demonstrativa
 
Meu amor
Meu amorMeu amor
Meu amor
 
Taller 9 ud iii tema 2
Taller 9 ud iii tema 2Taller 9 ud iii tema 2
Taller 9 ud iii tema 2
 
2000 11 Navidec Blue Tuna Nomination
2000 11 Navidec Blue Tuna Nomination2000 11 Navidec Blue Tuna Nomination
2000 11 Navidec Blue Tuna Nomination
 
Daniel Bergmann
Daniel BergmannDaniel Bergmann
Daniel Bergmann
 
GEO_ANI Project Overview
GEO_ANI Project OverviewGEO_ANI Project Overview
GEO_ANI Project Overview
 

Similar to U4102167175

Dec 2 post proof
Dec 2 post proofDec 2 post proof
Dec 2 post proofRubi Soto
 
Mobile marketing final
Mobile marketing final Mobile marketing final
Mobile marketing final Rahul Shetty
 
THE EXPLORATORY RESEARCH OF THE EFFECT COMMUNICATION MODEL AND EFFECT IMPROVI...
THE EXPLORATORY RESEARCH OF THE EFFECT COMMUNICATION MODEL AND EFFECT IMPROVI...THE EXPLORATORY RESEARCH OF THE EFFECT COMMUNICATION MODEL AND EFFECT IMPROVI...
THE EXPLORATORY RESEARCH OF THE EFFECT COMMUNICATION MODEL AND EFFECT IMPROVI...ijma
 
Thesis: Mobile Advertising @Oral Defense
Thesis: Mobile Advertising @Oral DefenseThesis: Mobile Advertising @Oral Defense
Thesis: Mobile Advertising @Oral DefenseVantharith Oum
 
Effect of mobile_marketing_on_youngsters_of_ahmedabad_city[1]
Effect of mobile_marketing_on_youngsters_of_ahmedabad_city[1]Effect of mobile_marketing_on_youngsters_of_ahmedabad_city[1]
Effect of mobile_marketing_on_youngsters_of_ahmedabad_city[1]twarad
 
SYDNEY BUSINESS SCHOOL - UNIVERSITY OF WOLLONGONG.docx
SYDNEY BUSINESS SCHOOL - UNIVERSITY OF WOLLONGONG.docxSYDNEY BUSINESS SCHOOL - UNIVERSITY OF WOLLONGONG.docx
SYDNEY BUSINESS SCHOOL - UNIVERSITY OF WOLLONGONG.docxdeanmtaylor1545
 
1. [1 9]online banner ad corrected
1. [1 9]online banner ad corrected1. [1 9]online banner ad corrected
1. [1 9]online banner ad correctedAlexander Decker
 
11.online banner ad corrected
11.online banner ad corrected11.online banner ad corrected
11.online banner ad correctedAlexander Decker
 
Netnography- Shared Economy in Transportation Sector
Netnography- Shared Economy in Transportation SectorNetnography- Shared Economy in Transportation Sector
Netnography- Shared Economy in Transportation SectorSohil Ghoghari
 
Qualitative and Quantitative Critical ReviewProblem Statement.docx
Qualitative and Quantitative Critical ReviewProblem Statement.docxQualitative and Quantitative Critical ReviewProblem Statement.docx
Qualitative and Quantitative Critical ReviewProblem Statement.docxmakdul
 
An empirical Study of In-App Advertising in Mobile Devices: Indian Scenario
An empirical Study of In-App Advertising in Mobile Devices: Indian ScenarioAn empirical Study of In-App Advertising in Mobile Devices: Indian Scenario
An empirical Study of In-App Advertising in Mobile Devices: Indian ScenarioPreetish Panda
 
Leveraging on MyTransporter Mobile Apps to Enhance the Quality of Life: A Con...
Leveraging on MyTransporter Mobile Apps to Enhance the Quality of Life: A Con...Leveraging on MyTransporter Mobile Apps to Enhance the Quality of Life: A Con...
Leveraging on MyTransporter Mobile Apps to Enhance the Quality of Life: A Con...IRJET Journal
 
Social Media Marketing as a Segmentation Tool.pdf
Social Media Marketing as a Segmentation Tool.pdfSocial Media Marketing as a Segmentation Tool.pdf
Social Media Marketing as a Segmentation Tool.pdfAproximacionAlFuturo
 
IMPACT OF ADVERTISING ON CONSUMER’S BUYING BEHAVIOR
IMPACT OF ADVERTISING ON CONSUMER’S BUYING BEHAVIORIMPACT OF ADVERTISING ON CONSUMER’S BUYING BEHAVIOR
IMPACT OF ADVERTISING ON CONSUMER’S BUYING BEHAVIOREnamul Islam
 
Investigating the types of e advertising strategyadvertising strategy and i...
 Investigating the types of e advertising  strategyadvertising strategy and i... Investigating the types of e advertising  strategyadvertising strategy and i...
Investigating the types of e advertising strategyadvertising strategy and i...Alexander Decker
 

Similar to U4102167175 (20)

Dec 2 post proof
Dec 2 post proofDec 2 post proof
Dec 2 post proof
 
Mobile marketing final
Mobile marketing final Mobile marketing final
Mobile marketing final
 
THE EXPLORATORY RESEARCH OF THE EFFECT COMMUNICATION MODEL AND EFFECT IMPROVI...
THE EXPLORATORY RESEARCH OF THE EFFECT COMMUNICATION MODEL AND EFFECT IMPROVI...THE EXPLORATORY RESEARCH OF THE EFFECT COMMUNICATION MODEL AND EFFECT IMPROVI...
THE EXPLORATORY RESEARCH OF THE EFFECT COMMUNICATION MODEL AND EFFECT IMPROVI...
 
Thesis: Mobile Advertising @Oral Defense
Thesis: Mobile Advertising @Oral DefenseThesis: Mobile Advertising @Oral Defense
Thesis: Mobile Advertising @Oral Defense
 
Effect of mobile_marketing_on_youngsters_of_ahmedabad_city[1]
Effect of mobile_marketing_on_youngsters_of_ahmedabad_city[1]Effect of mobile_marketing_on_youngsters_of_ahmedabad_city[1]
Effect of mobile_marketing_on_youngsters_of_ahmedabad_city[1]
 
3 3
3 33 3
3 3
 
SYDNEY BUSINESS SCHOOL - UNIVERSITY OF WOLLONGONG.docx
SYDNEY BUSINESS SCHOOL - UNIVERSITY OF WOLLONGONG.docxSYDNEY BUSINESS SCHOOL - UNIVERSITY OF WOLLONGONG.docx
SYDNEY BUSINESS SCHOOL - UNIVERSITY OF WOLLONGONG.docx
 
1. [1 9]online banner ad corrected
1. [1 9]online banner ad corrected1. [1 9]online banner ad corrected
1. [1 9]online banner ad corrected
 
11.online banner ad corrected
11.online banner ad corrected11.online banner ad corrected
11.online banner ad corrected
 
Relationship between Advertising and Telecommunication Marketing in Mubi Metr...
Relationship between Advertising and Telecommunication Marketing in Mubi Metr...Relationship between Advertising and Telecommunication Marketing in Mubi Metr...
Relationship between Advertising and Telecommunication Marketing in Mubi Metr...
 
Assegaff, Pranoto - Price Determines Customer Loyalty in Ride-Hailing Service...
Assegaff, Pranoto - Price Determines Customer Loyalty in Ride-Hailing Service...Assegaff, Pranoto - Price Determines Customer Loyalty in Ride-Hailing Service...
Assegaff, Pranoto - Price Determines Customer Loyalty in Ride-Hailing Service...
 
Netnography- Shared Economy in Transportation Sector
Netnography- Shared Economy in Transportation SectorNetnography- Shared Economy in Transportation Sector
Netnography- Shared Economy in Transportation Sector
 
Qualitative and Quantitative Critical ReviewProblem Statement.docx
Qualitative and Quantitative Critical ReviewProblem Statement.docxQualitative and Quantitative Critical ReviewProblem Statement.docx
Qualitative and Quantitative Critical ReviewProblem Statement.docx
 
An empirical Study of In-App Advertising in Mobile Devices: Indian Scenario
An empirical Study of In-App Advertising in Mobile Devices: Indian ScenarioAn empirical Study of In-App Advertising in Mobile Devices: Indian Scenario
An empirical Study of In-App Advertising in Mobile Devices: Indian Scenario
 
Factors Affecting Customer Satisfaction on Transjakarta Commuter System
Factors Affecting Customer Satisfaction on Transjakarta Commuter SystemFactors Affecting Customer Satisfaction on Transjakarta Commuter System
Factors Affecting Customer Satisfaction on Transjakarta Commuter System
 
Leveraging on MyTransporter Mobile Apps to Enhance the Quality of Life: A Con...
Leveraging on MyTransporter Mobile Apps to Enhance the Quality of Life: A Con...Leveraging on MyTransporter Mobile Apps to Enhance the Quality of Life: A Con...
Leveraging on MyTransporter Mobile Apps to Enhance the Quality of Life: A Con...
 
Social Media Marketing as a Segmentation Tool.pdf
Social Media Marketing as a Segmentation Tool.pdfSocial Media Marketing as a Segmentation Tool.pdf
Social Media Marketing as a Segmentation Tool.pdf
 
IMPACT OF ADVERTISING ON CONSUMER’S BUYING BEHAVIOR
IMPACT OF ADVERTISING ON CONSUMER’S BUYING BEHAVIORIMPACT OF ADVERTISING ON CONSUMER’S BUYING BEHAVIOR
IMPACT OF ADVERTISING ON CONSUMER’S BUYING BEHAVIOR
 
Investigating the types of e advertising strategyadvertising strategy and i...
 Investigating the types of e advertising  strategyadvertising strategy and i... Investigating the types of e advertising  strategyadvertising strategy and i...
Investigating the types of e advertising strategyadvertising strategy and i...
 
Investigating the types of e advertising strategyadvertising strategy and i...
 Investigating the types of e advertising  strategyadvertising strategy and i... Investigating the types of e advertising  strategyadvertising strategy and i...
Investigating the types of e advertising strategyadvertising strategy and i...
 

Recently uploaded

Bun (KitWorks Team Study 노별마루 발표 2024.4.22)
Bun (KitWorks Team Study 노별마루 발표 2024.4.22)Bun (KitWorks Team Study 노별마루 발표 2024.4.22)
Bun (KitWorks Team Study 노별마루 발표 2024.4.22)Wonjun Hwang
 
Human Factors of XR: Using Human Factors to Design XR Systems
Human Factors of XR: Using Human Factors to Design XR SystemsHuman Factors of XR: Using Human Factors to Design XR Systems
Human Factors of XR: Using Human Factors to Design XR SystemsMark Billinghurst
 
New from BookNet Canada for 2024: BNC BiblioShare - Tech Forum 2024
New from BookNet Canada for 2024: BNC BiblioShare - Tech Forum 2024New from BookNet Canada for 2024: BNC BiblioShare - Tech Forum 2024
New from BookNet Canada for 2024: BNC BiblioShare - Tech Forum 2024BookNet Canada
 
Snow Chain-Integrated Tire for a Safe Drive on Winter Roads
Snow Chain-Integrated Tire for a Safe Drive on Winter RoadsSnow Chain-Integrated Tire for a Safe Drive on Winter Roads
Snow Chain-Integrated Tire for a Safe Drive on Winter RoadsHyundai Motor Group
 
#StandardsGoals for 2024: What’s new for BISAC - Tech Forum 2024
#StandardsGoals for 2024: What’s new for BISAC - Tech Forum 2024#StandardsGoals for 2024: What’s new for BISAC - Tech Forum 2024
#StandardsGoals for 2024: What’s new for BISAC - Tech Forum 2024BookNet Canada
 
Connect Wave/ connectwave Pitch Deck Presentation
Connect Wave/ connectwave Pitch Deck PresentationConnect Wave/ connectwave Pitch Deck Presentation
Connect Wave/ connectwave Pitch Deck PresentationSlibray Presentation
 
My INSURER PTE LTD - Insurtech Innovation Award 2024
My INSURER PTE LTD - Insurtech Innovation Award 2024My INSURER PTE LTD - Insurtech Innovation Award 2024
My INSURER PTE LTD - Insurtech Innovation Award 2024The Digital Insurer
 
SIEMENS: RAPUNZEL – A Tale About Knowledge Graph
SIEMENS: RAPUNZEL – A Tale About Knowledge GraphSIEMENS: RAPUNZEL – A Tale About Knowledge Graph
SIEMENS: RAPUNZEL – A Tale About Knowledge GraphNeo4j
 
Pigging Solutions in Pet Food Manufacturing
Pigging Solutions in Pet Food ManufacturingPigging Solutions in Pet Food Manufacturing
Pigging Solutions in Pet Food ManufacturingPigging Solutions
 
Build your next Gen AI Breakthrough - April 2024
Build your next Gen AI Breakthrough - April 2024Build your next Gen AI Breakthrough - April 2024
Build your next Gen AI Breakthrough - April 2024Neo4j
 
Are Multi-Cloud and Serverless Good or Bad?
Are Multi-Cloud and Serverless Good or Bad?Are Multi-Cloud and Serverless Good or Bad?
Are Multi-Cloud and Serverless Good or Bad?Mattias Andersson
 
Artificial intelligence in the post-deep learning era
Artificial intelligence in the post-deep learning eraArtificial intelligence in the post-deep learning era
Artificial intelligence in the post-deep learning eraDeakin University
 
Advanced Test Driven-Development @ php[tek] 2024
Advanced Test Driven-Development @ php[tek] 2024Advanced Test Driven-Development @ php[tek] 2024
Advanced Test Driven-Development @ php[tek] 2024Scott Keck-Warren
 
Kotlin Multiplatform & Compose Multiplatform - Starter kit for pragmatics
Kotlin Multiplatform & Compose Multiplatform - Starter kit for pragmaticsKotlin Multiplatform & Compose Multiplatform - Starter kit for pragmatics
Kotlin Multiplatform & Compose Multiplatform - Starter kit for pragmaticscarlostorres15106
 
Making_way_through_DLL_hollowing_inspite_of_CFG_by_Debjeet Banerjee.pptx
Making_way_through_DLL_hollowing_inspite_of_CFG_by_Debjeet Banerjee.pptxMaking_way_through_DLL_hollowing_inspite_of_CFG_by_Debjeet Banerjee.pptx
Making_way_through_DLL_hollowing_inspite_of_CFG_by_Debjeet Banerjee.pptxnull - The Open Security Community
 
CloudStudio User manual (basic edition):
CloudStudio User manual (basic edition):CloudStudio User manual (basic edition):
CloudStudio User manual (basic edition):comworks
 

Recently uploaded (20)

Bun (KitWorks Team Study 노별마루 발표 2024.4.22)
Bun (KitWorks Team Study 노별마루 발표 2024.4.22)Bun (KitWorks Team Study 노별마루 발표 2024.4.22)
Bun (KitWorks Team Study 노별마루 발표 2024.4.22)
 
Human Factors of XR: Using Human Factors to Design XR Systems
Human Factors of XR: Using Human Factors to Design XR SystemsHuman Factors of XR: Using Human Factors to Design XR Systems
Human Factors of XR: Using Human Factors to Design XR Systems
 
New from BookNet Canada for 2024: BNC BiblioShare - Tech Forum 2024
New from BookNet Canada for 2024: BNC BiblioShare - Tech Forum 2024New from BookNet Canada for 2024: BNC BiblioShare - Tech Forum 2024
New from BookNet Canada for 2024: BNC BiblioShare - Tech Forum 2024
 
Snow Chain-Integrated Tire for a Safe Drive on Winter Roads
Snow Chain-Integrated Tire for a Safe Drive on Winter RoadsSnow Chain-Integrated Tire for a Safe Drive on Winter Roads
Snow Chain-Integrated Tire for a Safe Drive on Winter Roads
 
#StandardsGoals for 2024: What’s new for BISAC - Tech Forum 2024
#StandardsGoals for 2024: What’s new for BISAC - Tech Forum 2024#StandardsGoals for 2024: What’s new for BISAC - Tech Forum 2024
#StandardsGoals for 2024: What’s new for BISAC - Tech Forum 2024
 
Connect Wave/ connectwave Pitch Deck Presentation
Connect Wave/ connectwave Pitch Deck PresentationConnect Wave/ connectwave Pitch Deck Presentation
Connect Wave/ connectwave Pitch Deck Presentation
 
My INSURER PTE LTD - Insurtech Innovation Award 2024
My INSURER PTE LTD - Insurtech Innovation Award 2024My INSURER PTE LTD - Insurtech Innovation Award 2024
My INSURER PTE LTD - Insurtech Innovation Award 2024
 
DMCC Future of Trade Web3 - Special Edition
DMCC Future of Trade Web3 - Special EditionDMCC Future of Trade Web3 - Special Edition
DMCC Future of Trade Web3 - Special Edition
 
SIEMENS: RAPUNZEL – A Tale About Knowledge Graph
SIEMENS: RAPUNZEL – A Tale About Knowledge GraphSIEMENS: RAPUNZEL – A Tale About Knowledge Graph
SIEMENS: RAPUNZEL – A Tale About Knowledge Graph
 
Pigging Solutions in Pet Food Manufacturing
Pigging Solutions in Pet Food ManufacturingPigging Solutions in Pet Food Manufacturing
Pigging Solutions in Pet Food Manufacturing
 
Build your next Gen AI Breakthrough - April 2024
Build your next Gen AI Breakthrough - April 2024Build your next Gen AI Breakthrough - April 2024
Build your next Gen AI Breakthrough - April 2024
 
Are Multi-Cloud and Serverless Good or Bad?
Are Multi-Cloud and Serverless Good or Bad?Are Multi-Cloud and Serverless Good or Bad?
Are Multi-Cloud and Serverless Good or Bad?
 
Vulnerability_Management_GRC_by Sohang Sengupta.pptx
Vulnerability_Management_GRC_by Sohang Sengupta.pptxVulnerability_Management_GRC_by Sohang Sengupta.pptx
Vulnerability_Management_GRC_by Sohang Sengupta.pptx
 
Hot Sexy call girls in Panjabi Bagh 🔝 9953056974 🔝 Delhi escort Service
Hot Sexy call girls in Panjabi Bagh 🔝 9953056974 🔝 Delhi escort ServiceHot Sexy call girls in Panjabi Bagh 🔝 9953056974 🔝 Delhi escort Service
Hot Sexy call girls in Panjabi Bagh 🔝 9953056974 🔝 Delhi escort Service
 
Artificial intelligence in the post-deep learning era
Artificial intelligence in the post-deep learning eraArtificial intelligence in the post-deep learning era
Artificial intelligence in the post-deep learning era
 
Advanced Test Driven-Development @ php[tek] 2024
Advanced Test Driven-Development @ php[tek] 2024Advanced Test Driven-Development @ php[tek] 2024
Advanced Test Driven-Development @ php[tek] 2024
 
Kotlin Multiplatform & Compose Multiplatform - Starter kit for pragmatics
Kotlin Multiplatform & Compose Multiplatform - Starter kit for pragmaticsKotlin Multiplatform & Compose Multiplatform - Starter kit for pragmatics
Kotlin Multiplatform & Compose Multiplatform - Starter kit for pragmatics
 
The transition to renewables in India.pdf
The transition to renewables in India.pdfThe transition to renewables in India.pdf
The transition to renewables in India.pdf
 
Making_way_through_DLL_hollowing_inspite_of_CFG_by_Debjeet Banerjee.pptx
Making_way_through_DLL_hollowing_inspite_of_CFG_by_Debjeet Banerjee.pptxMaking_way_through_DLL_hollowing_inspite_of_CFG_by_Debjeet Banerjee.pptx
Making_way_through_DLL_hollowing_inspite_of_CFG_by_Debjeet Banerjee.pptx
 
CloudStudio User manual (basic edition):
CloudStudio User manual (basic edition):CloudStudio User manual (basic edition):
CloudStudio User manual (basic edition):
 

U4102167175

  • 1. Kakuro Amasaka et al Int. Journal of Engineering Research and Applications ISSN : 2248-9622, Vol. 4, Issue 1( Version 2), January 2014, pp.167-175 410121523 RESEARCH ARTICLE www.ijera.com OPEN ACCESS Attention-Grabbing Train Car Advertisements Motoi Ogura1, Takayuki Hachiya2, Kenta Masubuchi3, Kakuro Amasaka4 Graduate School of Science and Engineering Aoyama Gakuin University 5-10-1, Fuchinobe, Chuo-ku, Sagamihara-shi, Kanagawa, 252-5258 JAPAN Abstract Younger people have changed the way they access information in recent years, increasing the number of opportunities to take advantage of transit advertising. Train car advertising in particular boasts a high contact rate and extended length of contact. This study seeks to understand the correlations between passenger information and riding conditions when it comes to train car advertising (hanging posters, above-window posters, and sticker ads) in order to discover the ideal way to advertise inside passenger trains. Specifically, the study first tries to find the correlations among three factors: (1) whether or not passengers pay attention to train car advertisements, (2) basic passenger information (age and gender), and (3) riding conditions (riding time, average number of trips, etc.). Once data on riding conditions is collected, it is then grouped using a cluster analysis and Quantification Theory Type III in order to establish the relationship of the data to passenger attention towards train advertisements once again. Then, in order to conduct an in-depth analysis, a Categorical Automatic Interaction Detector (CAID) analysis is done on each group, using passengers pay attention to train advertisements as the objective variable and basic passenger information as the explanatory variable. The results of the CAID analysis are then used to study the format of existing and future train car advertisements. Keywords: Train Car Advertisements, AIDA model, CAID analysis I. Introduction Younger adults, particularly men in their 20s, have been changing the way they access information and participate in city life. Because they are so frequently on the move for their jobs, there are more opportunities for them to come in contact with forms of outdoor media. Longer times spent traveling and on the internet have been shown to decentralize media contact. Essentially, transit ads are a more effective form of advertising these days since they have a high contract rate among people with hectic modern schedules. This study deals with the in-car train advertisements that have been garnering attention in recent years with research that focuses on attention: the first stage in the AIDA model (A : Attention, I : Interest, D : Desire, A : Action) of consumer behavior. The goal is to first quantify the way passengers pay attention to train car advertisements, and then propose the ideal form that in-car train advertising should take based on a visual representation of passenger information. Specifically, the study first tries to find the correlations among three factors: (1) whether or not passengers pay attention to train car advertisements, (2) basic passenger information (age and gender), and (3) riding conditions (riding time, average number of trips, etc.). Once data on riding conditions is collected, it is then grouped using a cluster analysis and Quantification Theory Type III in order to establish www.ijera.com the relationship of the data to passenger attention towards train advertisements once again. Then, in order to conduct an in-depth analysis, a Categorical Automatic Interaction Detector (CAID) analysis is done on each group, setting whether passengers pay attention to train advertisements as the objective variable and basic passenger information as the explanatory variable. The results of the CAID analysis are then used to study the format of existing and future train car advertisements. II. Background 2.1 The advertising industry: Current status and issues Over the last ten years, Japan has consistently spent around 6.5 trillion yen on advertising. The companies have no choice but to spend money on advertising, and are always looking for a format whose performance will justify their significant investment (Dentsu, 2011). The kinds of advertising that companies use to target consumers can be divided into three major categories: (1) mass media advertising, including TV commercials and newspaper ads; (2) direct mail (DM) advertising; and (3) newer forms of advertising media, such as advertising on public transportation and the internet. In terms of money spent on each category, mass media advertising accounts for as much as two-thirds of company advertising budgets (Dentsu, 2011). It is thought that companies blindly spend 167 | P a g e
  • 2. Kakuro Amasaka et al Int. Journal of Engineering Research and Applications ISSN : 2248-9622, Vol. 4, Issue 1( Version 2), January 2014, pp.167-175 massive amounts of money on mass media advertising in order to get consumers’ attention—which they believe is the only function of their promotional efforts. What is needed is for companies to quantitatively grasp the amount of publicity generated by different forms of advertising media (Amasaka, 2005; Amasaka, 2007; Amasaka, 2010). 2.2 The study of advertising performance In the past, many researchers have studied consumer response patterns as a way of quantitatively grasping advertising performance (Amasaka, 2009). Numerous consumer response models, which predict consumer behavior from the time they learn about a new product through an ad until the time they purchase it, have been offered. The most well-known of these is probably the AIDA (Attention, Interest, Desire, Action) model, which outlines a four-stage consumer response pattern. This model has been further developed through applied research in recent years, with alternative models such as the AIDMA (Attention, Interest, Desire, Motive, Action) and AISAS (Attention, Interest, Search, Action, Share) also being proposed. Despite these variations, the one thing that all of these models have in common is that the initial step in consumer purchase behavior is always the attention phase. Because of this, attention can be considered the most critical element in the process whereby consumers move towards actually making a purchase (Ferrell and Hartline, 2005; Mehta, 2000; Shimizu, 2004). 2.3 Transit advertisements: Current status The number transit advertising opportunities www.ijera.com has increased in recent years. One of the major characteristics of this form of ads is an extended contact period. As Figure 1 shows, railway usage peaks in the morning and evening. Between these two periods, in the hours following 12 noon, train usage and shopping activities follow essentially the same line. What this means is that the form of ads consumers are most likely to come in contact with while they are shopping is transit advertising, a situation that creates major opportunities for these advertisements to lead to purchases. Three key characteristics of transit advertising are listed below (The Kanto Transit Advertising Council, 2009). 1. For male and female teenagers (ages 10–19), group 1 men (age 30–34), and group 2 men (age 35–49), transit advertising is a powerful form of media on par with traditional mass-media advertising in terms of having a good contact rate, long-term contact, and a frequent contact rate. 2. After television, transit advertising scores higher than all other forms of media in terms of natural, habitual viewing, enjoyable viewing, generating surprise or interest in viewers, and other positive characteristics. For this reason, transit advertisements have a powerful ability to draw consumers in, making it difficult for viewers to overlook them. 3. Because they make appeals to consumers while they are out of the house, transit advertisements are known for having a powerful link to outside purchasing behavior. The third most common source of new product information after TV and shop displays, transit advertising is a form of media that positions itself within everyday situations and locations—including buying situations. Figure 1 The media contact situation according to the time on weekdays www.ijera.com 168 | P a g e
  • 3. Kakuro Amasaka et al Int. Journal of Engineering Research and Applications ISSN : 2248-9622, Vol. 4, Issue 1( Version 2), January 2014, pp.167-175 The above characteristics give transit advertising enormous potential when it comes to influencing purchase behavior. This study takes the insights gained from previous advertising research and uses it to lay the foundation for future inquiries on this important topic. 2.4 Prior research on transit advertisements Even within the category of transit advertising, in-car train advertisements are a powerfully influential form of media that is placed right in front of viewers for a certain period of time—whether or not it captures their interest. Still, the authors are not aware of that many studies that have been done on train advertising relative to the amount of research done on TV or newspaper advertising. Two examples of prior research on transit advertising follow. The first study, A Look at Subconscious Awareness in Train Car Advertising by Gonda (2004), focused on the subconscious and saw train advertising as a locally based form of media that was both impactful and could be customized to suit individual train lines or regions. Gonda felt that in-car train advertising was a form of information that improved the quality of life in local areas, and studied the role of transit advertising as a conduit of local information for passengers. A second study by Takenaka and Harada (2003) entitled A Study on Watching Professional Baseball and Information Contact via Transit Advertisements, focused on transit advertisements that promoted professional baseball games, grouping subjects into segments based on how frequently they rode trains and looking at differences in the level of information contact among the groups. The study then examined how those differences affected game www.ijera.com watching. The studies above did not look statistically at the correlations between passenger information and riding conditions. Noting this gap, the authors of this study decided to examine those relationships and how they relate to train car advertising with the aim of defining the ideal format for this type of media. III. Proposing transit advertisements for boosting ad awareness of passengers 3.1 Clarifying the relationships between basic passenger information and riding conditions As mentioned in the previous chapters, the purpose of this study was to examine the correlations between passenger information and riding conditions in train car advertising in order to discover the ideal way to advertise inside passenger trains. For the purpose of this study, in-train advertisements were divided into three different types based on external appearance. The types (No1.hanging posters, No2.above-window posters, and No6.stickers placed to the side of doors) are shown in Figure 2. The number of trains featuring digital advertisements is increasing, but the authors chose to limit their selection to these three based on an examination by a professional market survey company, which indicated that these ads are used on all major railways in the Kanto region, marking them as representative forms of media on every train line. 3.1.1 Field survey In order to suggest ideal positioning for train advertisements, the authors teamed up with the market survey company mentioned above and a related committee to produce a survey to collect information from actual passengers. The interview-style survey Figure 2 The type of in-train advertisements www.ijera.com 169 | P a g e
  • 4. Kakuro Amasaka et al Int. Journal of Engineering Research and Applications ISSN : 2248-9622, Vol. 4, Issue 1( Version 2), January 2014, pp.167-175 was conducted multiple times on two urban train lines (Line A and Line B) between late December 2005 and early January 2006. The number of valid response was 50 people (26 were men and 24 were women ranged from 15 to 54 years). The survey asked passengers a series of multiple-choice questions designed collect the basic information needed to construct personal profiles of the test subjects. Respondents were asked to select their age, gender, time spent riding trains, and the average number of weekly trips they made. Subjects were also shown a diagram of a train interior and asked to point out where they were in the train, what position they took when riding, and whether they were aware of the train advertisements (hanging posters, above-window posters, and stickers to the sides of doors). The authors looked at the format of questionnaires conducted by the marketing survey company for reference (The Kanto Transit Advertising Council, 2006). The data they collected was analyzed and closely examined in order to pinpoint trends that affected passenger’s attention towards hanging posters, above-window posters, and stickers. For each type of advertisements, subjects were asked to respond in one of three ways: ―I saw it‖, ―I think I saw it‖, and ―I didn’t see it‖. The results were used to assign an attention ratio to each form of advertising by taking the total number of ―I saw it‖ and ―I think I saw it‖ responses as a percentage of the total. The authors defined this value as the ―attention rate‖ for that form of media. 3.2 Visualizing causal relationships between basic passenger information and riding conditions using multivariate analysis The survey data used to examine the current state of train car advertising in the previous section was then subjected to a statistical analysis in order to visually represent the correlations between passenger information and riding conditions. The procedure and goals of this analysis follow. 1. Look at overall trends in passenger information using a cross tabulation method that focuses on whether passenger attention turned to hanging posters, above-window posters, or sticker advertisements. 2. Perform a cluster analysis on riding conditions and group the results using Quantification Theory Type III. Then, look at the relationship between (1) the riding conditions grouped in the cross tabulation and (2) whether passenger attention turned to hanging posters, above-window posters, or sticker advertisements. 3. Run a CAID analysis on the grouped riding condition data and basic passenger information to determine how it relates to attention rates established for the three types of advertising. www.ijera.com www.ijera.com 3.2.1 Visualizing causal relationships between basic passenger information and ad awareness of passengers (Analysis step 1) In step 1 of the analysis, the authors performed a cross tabulation on the survey data collected in a previous section and researched the correlations between whether passengers notice each form of train car advertising (hanging, above-window, and sticker) and passenger information (age and gender) in order see how passenger information relates to attention rates. As part of this process, the age information from the surveys was grouped into young (15–25), intermediate (26–40), and older (41 and up) age brackets. Table 1 shows the results of the cross tabulation for passenger information (age and gender) and attention rates for each form of train car advertising. The analysis revealed that younger passengers looked at the hanging posters, while the attention rate for older passengers was low. The results were reversed for advertisements placed above train windows, with older passengers paying close attention to them. Sticker advertisements tended to be noticed by women, and younger passengers in general also tended to look at sticker advertisements. Table 1 The cross tabulation for passenger information and attention rates for each form of train car ad 3.2.2 Visualizing causal relationships between riding conditions and ad awareness of passengers (Analysis step 2) In this step, the authors used the survey data gathered to represent current in-train advertising conditions, subjected it to a cluster analysis, and then used Quantification Theory Type III to group riding conditions. They then looked for correlations between the resulting data and whether passengers paid attention to different types of train advertising. The binary data on riding time (0–15 minutes, 16–45 minutes, 46 minutes or more), average number of weekly trips (Less than two, two or three, four or more), and riding position (standing or sitting) that passengers provided during the survey was subjected 170 | P a g e
  • 5. Kakuro Amasaka et al Int. Journal of Engineering Research and Applications ISSN : 2248-9622, Vol. 4, Issue 1( Version 2), January 2014, pp.167-175 www.ijera.com Figure 3 Cluster analysis of the ride condition Figure 4 Quantification Theory Type III of the ride condition to a Euclidean distance cluster analysis. The results of this analysis are shown in Figure 3. It was found that the eight types indicated in this dendrogram could be separated into two groups. www.ijera.com Similar results were obtained when the Quantification Theory Type III was used on the survey data (Figure 4). Since the first group consisted of standing passengers who ride the train for 0–15 171 | P a g e
  • 6. Kakuro Amasaka et al Int. Journal of Engineering Research and Applications ISSN : 2248-9622, Vol. 4, Issue 1( Version 2), January 2014, pp.167-175 minutes, they were labeled ―short-distance passengers‖. The second group rode the train for a longer period of time and tended to sit, so this group was called the ―long-distance passengers‖. Table 2 The cross tabulation for passenger information and attention rates for each form of train car ad after grouping The passengers in each group were then summarized, and this data was subjected to a cross tabulation with awareness rate for hanging posters, above-window posters, and sticker advertisements to find the correlations (Table 2). The highest awareness rates for the short-distance passenger group were on hanging advertisements, followed by above-window and sticker ads. These short-term riders had higher awareness rates overall than those in the long-distance group, who showed similar results in that they were most aware of hanging posters, followed by above-window posters and stickers. They paid less attention to ads overall than their short-term passenger counterparts. www.ijera.com 3.2.3 Visualizing causal relationships between basic passenger information, riding conditions and ad awareness of passengers (Analysis step 3) The authors then examined the characteristics of the short-term and long-term passenger groups defined in the previous section, conducting a CAID analysis (Murayama, 1982) in order to understand in-depth correlations involving passenger information. The CAID analysis is to search which variable is strongly correlated with criterion variable on the basis of simultaneous distribution of frequency data, and divide a sample population by the category of the related high criterion variable. Specifically, a CAID analysis was conducted for each form of advertising (hanging, above-window, and stickers next to doors) as it related to the two groups discussed in the last section. The data collected in the survey was used for the analysis, with awareness rates for the different forms of advertising used as criterion variables. Passenger information (age and gender) was used for the explanatory variables. In this way, the relationship between on-board riding conditions and passenger information was analyzed. Figure 5 shows some of the results from the analysis. These are the results of the awareness rate for hanging posters among short-term riders is used Figure 5 Quantification Theory Type III of the ride condition www.ijera.com 172 | P a g e
  • 7. Kakuro Amasaka et al Int. Journal of Engineering Research and Applications ISSN : 2248-9622, Vol. 4, Issue 1( Version 2), January 2014, pp.167-175 www.ijera.com Table 3 The results of the CAID analysis on the short-term passenger group as a criterion variable using the CAID analysis. The results indicate that the highest awareness rate in this group is among men in the youngest age category (15–25). Table 3 shows the results of the CAID analysis on the short-term passenger group. A CAID analysis like the one in Table 3 was similarly conducted for each type of media among the long-term passenger group, with passenger information designated as the explanatory variable. Barring a few exceptions, the results indicate an overall trend of awareness rates being higher among the younger generations. Comparing the two groups, the authors found that the short-term passengers (who tended to stand when riding) had higher awareness rates in general. Passengers who sat, on the other hand, had more opportunities to engage in different activities during their ride, such as reading or doing work, which probably contributed to their paying less attention to advertisements than the passengers who were standing. The analysis revealed that women passengers 26 and older in particular did not look at in-car advertisements. It also indicated that older passengers www.ijera.com frequently paid attention to advertisements located above windows. IV. Proposing train car advertisements Based on the results from the previous section, the authors attempted to provide specifics on an ideal format for train car advertisements. Figure 6 uses a picture to indicate the results of the CAID analysis in a way that is easy to understand. Awareness rates for hanging posters were high among younger passengers and standing passengers, and the difference between men and women was slight. Both male and female members of the older age group frequently paid attention to above-window posters. Men 41 and over who sat while riding the train, as well as women who stood while riding, tended to view these advertisements the most. Awareness rates for sticker advertisements were low overall; however, younger riders frequently looked at them, as did standing passengers. To summarize, train car advertisements are most likely to catch the eye of standing passengers, and the younger generation tends to look at them the most. 173 | P a g e
  • 8. Kakuro Amasaka et al Int. Journal of Engineering Research and Applications ISSN : 2248-9622, Vol. 4, Issue 1( Version 2), January 2014, pp.167-175 www.ijera.com Figure 6 Visualizing causal relationships between basic passenger information, riding conditions and ad awareness of passengers Based on these conclusions, the authors’ first recommendation is for existing train car advertising. Because hanging posters, stickers, and other in-car advertisements are likely to attract younger riders, this space should be used to advertise weekly manga magazines, fashion magazines, sales, or other products likely to appeal to this generation. Another important consideration is using popular celebrities to catch the eye of these passengers. Above-window advertising space, on the other hand, may be better used to appeal to those of the older generation. These passengers are more likely to be married and have children, so it may be beneficial to feature family-friendly topics. Specifically, posters advertising events for families or travel may be ideal in this location. Also, because it was found that standing passengers tend to look at advertisements frequently, riders may pay attention not only to ads that help them pass the time while standing, but also those that stimulate their interest or desire. Instead of showing just a picture, a magazine ad, for example, could feature headlines or other clever designs aimed at stimulating purchase behavior. It is important that other advertisements do not simply catch the eye, but encourage viewers to linger. Secondly, the authors suggest that trains adopt new forms of advertising media. The analysis results indicated that passengers who stand tend to have high awareness rates when it comes to in-car advertising, but advertisements on the floor may be www.ijera.com easier for sitting passengers to see. Riders who sit naturally allow their eyes to fall downward, making a floor advertisement an eye-catching option. Those who sit and read are also looking downward as well, increasing the chances that they may see these advertisements. V. Conclusion Focusing on transit advertising which has a good contact rate and long-term contact, the authors decided to examine those relationships and how they relate to train car advertising (hanging posters, above-window posters, and sticker ads) with the aim of defining the ideal format for this type of media. Additional research must be done in order to quantify how the attention captured through train car advertising leads to other stages of purchasing behavior. In addition, a strategic approach method that actually drives consumers to purchase must be considered. The effectiveness of other train-related advertisements, such as in-car digital ads and exterior train advertisements must be studied so that even greater value can be obtained from transit advertising media. VI. Acknowledgement In this study, we appreciate the help received from Nippon Research Center Co. Ltd. and the Kanto Transit Advertising Council with cooperation. 174 | P a g e
  • 9. Kakuro Amasaka et al Int. Journal of Engineering Research and Applications ISSN : 2248-9622, Vol. 4, Issue 1( Version 2), January 2014, pp.167-175 References Amasaka, K., (2005), ―Constructing a Customer Science Application System CS-CIANS - Development of a global strategic vehicle Lexus utilizing New JIT -‖, WSEAS Transactions on Business and Economics, Issue 3, Vol.2, pp. 135-142. [2] Amasaka, K., (2007), ―The validity of Advanced TMS - A strategic development marketing system utilizing New JIT –‖, The International Business & Economics Research Journal, Vol.6, No.8, pp.35-42. [3] Amasaka, K., (2009), ―The effectiveness of flyer advertising employing TMS: Key to scientific automobile sales innovation at Toyota‖, The Academic Journal of China-USA Business Review, Vol.8, No.3, pp.1-12. [4] Amasaka, K., (2010), ―Changes in marketing process management employing TMS: Establishment of Toyota Sales Marketing System‖, The Academic Journal of China-USA Business Review, Vol.10, No.7, pp.539-550. [5] Dentsu, (2011), Advertisement expenses in Japan (2011), http://www.dentsu.co.jp/ books/ad_cost/2011/index.html. (in Japanese) [6] Dentsu, (2011), Advertisement expenses of each media in Japan (2011), http:// www. dentsu.co.jp/books/ad_cost/2011/media.html. (in Japanese) [7] Ferrell, O.C., and Hartline, M., (2005), Marketing Strategy, Thomson SouthWestern. [8] Gonda, M., (2004), (Master thesis) A study of the latent function of train media: Focusing on the index of the local society formed by contact with train media, Tsukuba University (Unpublished) (in Japanese). [9] Murayama, T., et al. (1982), Analyzing CAID, Marketing review: Japan research center, pp. 74-86 (in Japanese). [10] Mehta, A., (2000), ―Advertising attitudes and advertising effectiveness‖, Journal of Advertising Research, Issue 3, Vol.40, pp.67-72. [11] Shimizu, K., (2004), Theory and Strategy of Advertisement, Soseisha. (in Japanese) [12] Takenaka, Y., and Harada, M., (2003), ―The study of the degree of information contact by the traffic advertisement and spectating professional baseball games – Focusing on Osaka Kintetsu Buffaloes-‖, Proceedings of Osaka University of Health and Sport Sciences, Vol.35, pp.15-23. [13] [1] www.ijera.com [14] www.ijera.com The Kanto Transit Advertising Council, (2006), A Joint Survey of Transit Advertising (March, 2006), http://www. train-media.net/report/0502/adreport.pdf. (in Japanese) The Kanto Transit Advertising Council, (2009), A Joint Survey of Transit Advertising (March, 2009), http://www. train-media.net/report/0612/0612.html. (in Japanese) 175 | P a g e