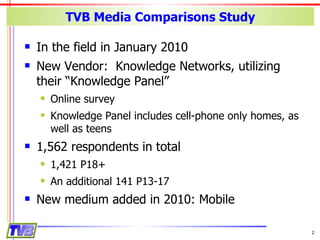
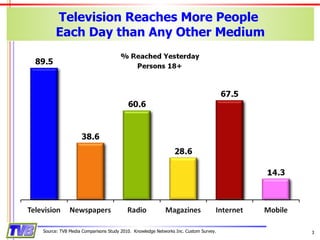
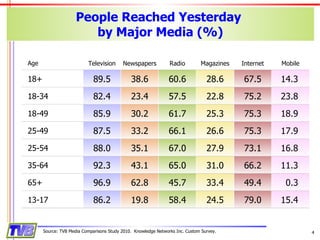
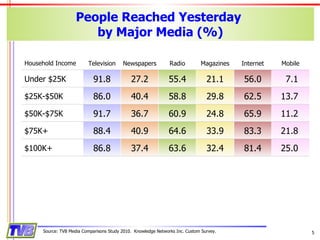
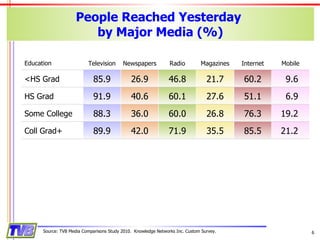
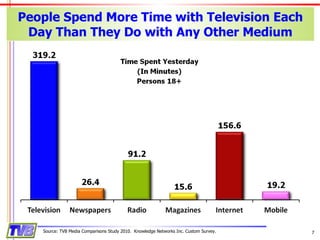
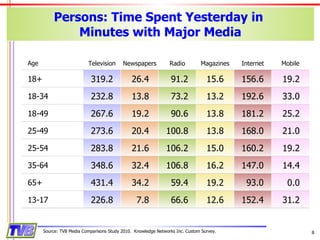
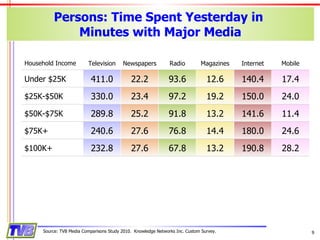
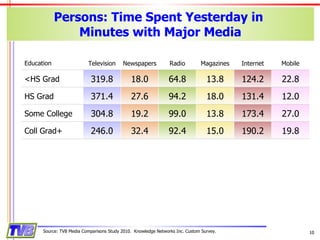
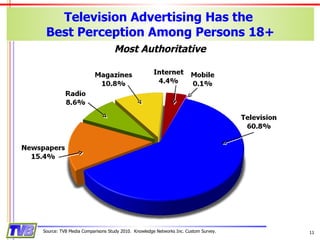
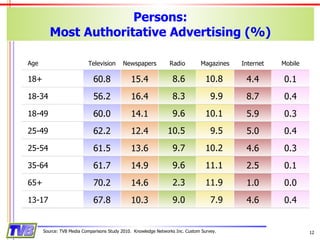
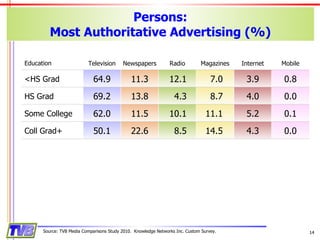
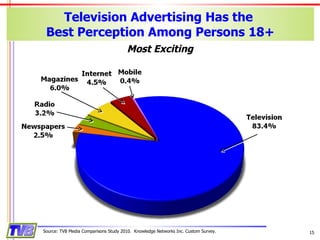
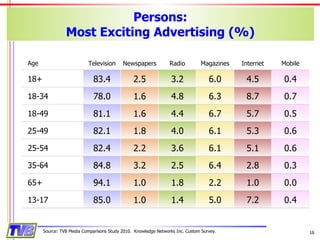
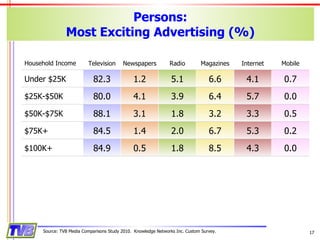
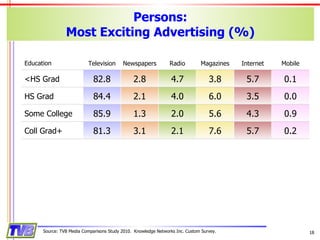
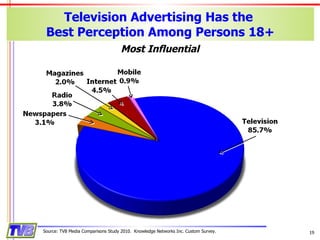
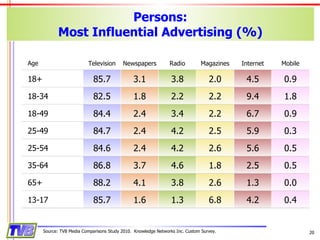
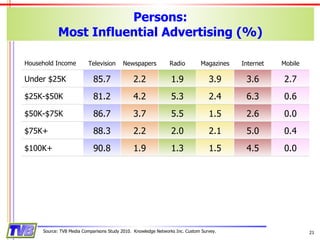
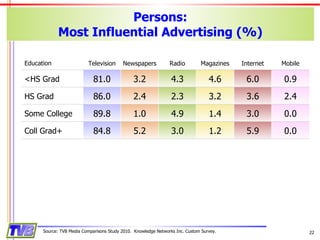
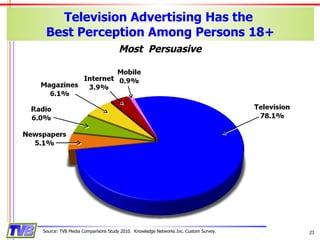
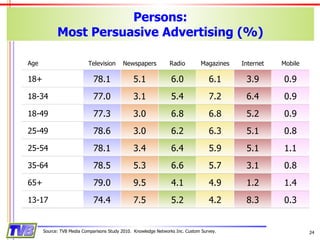
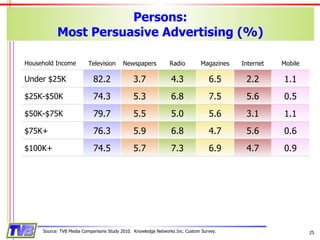
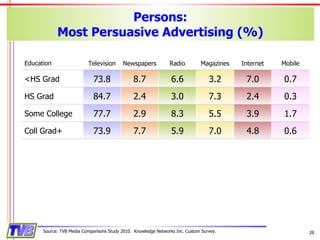
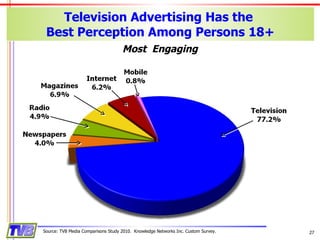
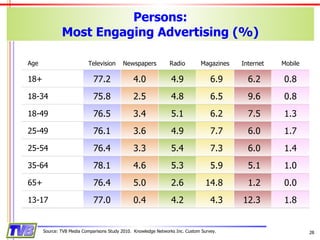
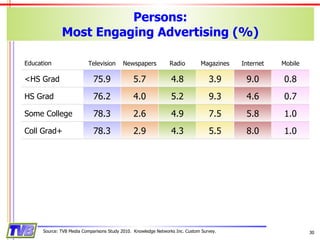
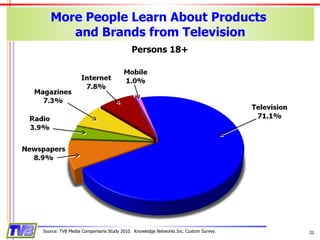
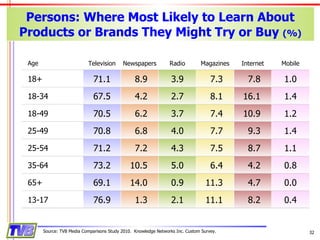
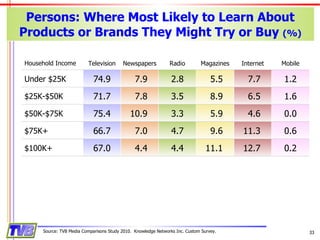
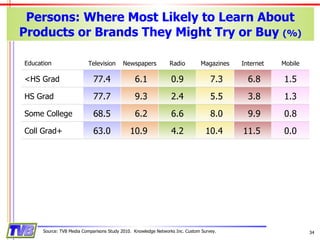
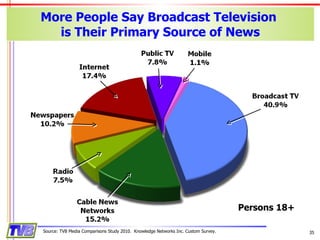
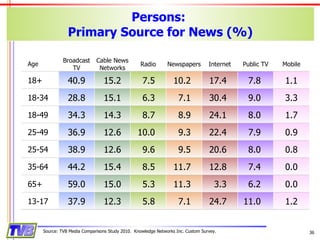
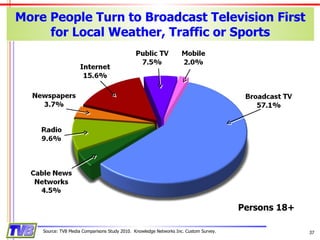
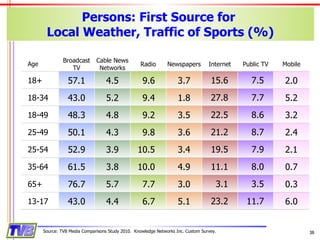
Media Comparisons 2010 Persons
TVB Media Comparisons Study In the field in January 2010 New Vendor:  Knowledge Networks, utilizing their “Knowledge Panel” Online survey Knowledge Panel includes cell-phone only homes, as well as teens 1,562 respondents in total  1,421 P18+ An additional 141 P13-17 New medium added in 2010: Mobile
Television Reaches More People  Each Day than Any Other Medium Source: TVB Media Comparisons Study 2010.  Knowledge Networks Inc. Custom Survey.
People Reached Yesterday  by Major Media (%) Source: TVB Media Comparisons Study 2010.  Knowledge Networks Inc. Custom Survey. Age Television Newspapers Radio Magazines Internet Mobile 18+ 89.5 38.6 60.6 28.6 67.5 14.3 18-34 82.4 23.4 57.5 22.8 75.2 23.8 18-49 85.9 30.2 61.7 25.3 75.3 18.9 25-49 87.5 33.2 66.1 26.6 75.3 17.9 25-54 88.0 35.1 67.0 27.9 73.1 16.8 35-64 92.3 43.1 65.0 31.0 66.2 11.3 65+ 96.9 62.8 45.7 33.4 49.4 0.3 13-17 86.2 19.8 58.4 24.5 79.0 15.4
People Reached Yesterday  by Major Media (%) Source: TVB Media Comparisons Study 2010.  Knowledge Networks Inc. Custom Survey. Household Income Television Newspapers Radio Magazines Internet Mobile Under $25K 91.8 27.2 55.4 21.1 56.0 7.1 $25K-$50K 86.0 40.4 58.8 29.8 62.5 13.7 $50K-$75K 91.7 36.7 60.9 24.8 65.9 11.2 $75K+ 88.4 40.9 64.6 33.9 83.3 21.8 $100K+ 86.8 37.4 63.6 32.4 81.4 25.0
People Reached Yesterday  by Major Media (%) Source: TVB Media Comparisons Study 2010.  Knowledge Networks Inc. Custom Survey. Education Television Newspapers Radio Magazines Internet Mobile <HS Grad 85.9 26.9 46.8 21.7 60.2 9.6 HS Grad 91.9 40.6 60.1 27.6 51.1 6.9 Some College 88.3 36.0 60.0 26.8 76.3 19.2 Coll Grad+ 89.9 42.0 71.9 35.5 85.5 21.2
People Spend More Time with Television Each Day Than They Do with Any Other Medium Source: TVB Media Comparisons Study 2010.  Knowledge Networks Inc. Custom Survey.
Persons: Time Spent Yesterday in  Minutes with Major Media Source: TVB Media Comparisons Study 2010.  Knowledge Networks Inc. Custom Survey. Age Television Newspapers Radio Magazines Internet Mobile 18+ 319.2 26.4 91.2 15.6 156.6 19.2 18-34 232.8 13.8 73.2 13.2 192.6 33.0 18-49 267.6 19.2 90.6 13.8 181.2 25.2 25-49 273.6 20.4 100.8 13.8 168.0 21.0 25-54 283.8 21.6 106.2 15.0 160.2 19.2 35-64 348.6 32.4 106.8 16.2 147.0 14.4 65+ 431.4 34.2 59.4 19.2 93.0 0.0 13-17 226.8 7.8 66.6 12.6 152.4 31.2
Persons: Time Spent Yesterday in  Minutes with Major Media Source: TVB Media Comparisons Study 2010.  Knowledge Networks Inc. Custom Survey. Household Income Television Newspapers Radio Magazines Internet Mobile Under $25K 411.0 22.2 93.6 12.6 140.4 17.4 $25K-$50K 330.0 23.4 97.2 19.2 150.0 24.0 $50K-$75K 289.8 25.2 91.8 13.2 141.6 11.4 $75K+ 240.6 27.6 76.8 14.4 180.0 24.6 $100K+ 232.8 27.6 67.8 13.2 190.8 28.2
Persons: Time Spent Yesterday in  Minutes with Major Media Source: TVB Media Comparisons Study 2010.  Knowledge Networks Inc. Custom Survey. Education Television Newspapers Radio Magazines Internet Mobile <HS Grad 319.8 18.0 64.8 13.8 124.2 22.8 HS Grad 371.4 27.6 94.2 18.0 131.4 12.0 Some College 304.8 19.2 99.0 13.8 173.4 27.0 Coll Grad+ 246.0 32.4 92.4 15.0 190.2 19.8
Television Advertising Has the  Best Perception Among Persons 18+ Source: TVB Media Comparisons Study 2010.  Knowledge Networks Inc. Custom Survey. Most Authoritative
Persons: Most Authoritative Advertising (%) Source: TVB Media Comparisons Study 2010.  Knowledge Networks Inc. Custom Survey. Age Television Newspapers Radio Magazines Internet Mobile 18+ 60.8 15.4 8.6 10.8 4.4 0.1 18-34 56.2 16.4 8.3 9.9 8.7 0.4 18-49 60.0 14.1 9.6 10.1 5.9 0.3 25-49 62.2 12.4 10.5 9.5 5.0 0.4 25-54 61.5 13.6 9.7 10.2 4.6 0.3 35-64 61.7 14.9 9.6 11.1 2.5 0.1 65+ 70.2 14.6 2.3 11.9 1.0 0.0 13-17 67.8 10.3 9.0 7.9 4.6 0.4
Persons: Most Authoritative Advertising (%) Source: TVB Media Comparisons Study 2010.  Knowledge Networks Inc. Custom Survey. Household Income Television Newspapers Radio Magazines Internet Mobile Under $25K 59.7 14.0 12.1 11.4 2.6 0.2 $25K-$50K 59.9 15.9 7.3 11.9 4.3 0.8 $50K-$75K 66.7 12.6 5.9 10.6 4.2 0.0 $75K+ 60.1 16.1 9.0 9.1 5.7 0.0 $100K+ 61.1 13.9 9.9 11.0 4.1 0.0
Persons: Most Authoritative Advertising (%) Source: TVB Media Comparisons Study 2010.  Knowledge Networks Inc. Custom Survey. Education Television Newspapers Radio Magazines Internet Mobile <HS Grad 64.9 11.3 12.1 7.0 3.9 0.8 HS Grad 69.2 13.8 4.3 8.7 4.0 0.0 Some College 62.0 11.5 10.1 11.1 5.2 0.1 Coll Grad+ 50.1 22.6 8.5 14.5 4.3 0.0
Television Advertising Has the  Best Perception Among Persons 18+ Source: TVB Media Comparisons Study 2010.  Knowledge Networks Inc. Custom Survey. Most Exciting
Persons: Most Exciting Advertising (%) Source: TVB Media Comparisons Study 2010.  Knowledge Networks Inc. Custom Survey. Age Television Newspapers Radio Magazines Internet Mobile 18+ 83.4 2.5 3.2 6.0 4.5 0.4 18-34 78.0 1.6 4.8 6.3 8.7 0.7 18-49 81.1 1.6 4.4 6.7 5.7 0.5 25-49 82.1 1.8 4.0 6.1 5.3 0.6 25-54 82.4 2.2 3.6 6.1 5.1 0.6 35-64 84.8 3.2 2.5 6.4 2.8 0.3 65+ 94.1 1.0 1.8 2.2 1.0 0.0 13-17 85.0 1.0 1.4 5.0 7.2 0.4
Persons: Most Exciting Advertising (%) Source: TVB Media Comparisons Study 2010.  Knowledge Networks Inc. Custom Survey. Household Income Television Newspapers Radio Magazines Internet Mobile Under $25K 82.3 1.2 5.1 6.6 4.1 0.7 $25K-$50K 80.0 4.1 3.9 6.4 5.7 0.0 $50K-$75K 88.1 3.1 1.8 3.2 3.3 0.5 $75K+ 84.5 1.4 2.0 6.7 5.3 0.2 $100K+ 84.9 0.5 1.8 8.5 4.3 0.0
Persons: Most Exciting Advertising (%) Source: TVB Media Comparisons Study 2010.  Knowledge Networks Inc. Custom Survey. Education Television Newspapers Radio Magazines Internet Mobile <HS Grad 82.8 2.8 4.7 3.8 5.7 0.1 HS Grad 84.4 2.1 4.0 6.0 3.5 0.0 Some College 85.9 1.3 2.0 5.6 4.3 0.9 Coll Grad+ 81.3 3.1 2.1 7.6 5.7 0.2
Television Advertising Has the  Best Perception Among Persons 18+ Source: TVB Media Comparisons Study 2010.  Knowledge Networks Inc. Custom Survey. Most Influential
Persons: Most Influential Advertising (%) Source: TVB Media Comparisons Study 2010.  Knowledge Networks Inc. Custom Survey. Age Television Newspapers Radio Magazines Internet Mobile 18+ 85.7 3.1 3.8 2.0 4.5 0.9 18-34 82.5 1.8 2.2 2.2 9.4 1.8 18-49 84.4 2.4 3.4 2.2 6.7 0.9 25-49 84.7 2.4 4.2 2.5 5.9 0.3 25-54 84.6 2.4 4.2 2.6 5.6 0.5 35-64 86.8 3.7 4.6 1.8 2.5 0.5 65+ 88.2 4.1 3.8 2.6 1.3 0.0 13-17 85.7 1.6 1.3 6.8 4.2 0.4
Persons: Most Influential Advertising (%) Source: TVB Media Comparisons Study 2010.  Knowledge Networks Inc. Custom Survey. Household Income Television Newspapers Radio Magazines Internet Mobile Under $25K 85.7 2.2 1.9 3.9 3.6 2.7 $25K-$50K 81.2 4.2 5.3 2.4 6.3 0.6 $50K-$75K 86.7 3.7 5.5 1.5 2.6 0.0 $75K+ 88.3 2.2 2.0 2.1 5.0 0.4 $100K+ 90.8 1.9 1.3 1.5 4.5 0.0
Persons: Most Influential Advertising (%) Source: TVB Media Comparisons Study 2010.  Knowledge Networks Inc. Custom Survey. Education Television Newspapers Radio Magazines Internet Mobile <HS Grad 81.0 3.2 4.3 4.6 6.0 0.9 HS Grad 86.0 2.4 2.3 3.2 3.6 2.4 Some College 89.8 1.0 4.9 1.4 3.0 0.0 Coll Grad+ 84.8 5.2 3.0 1.2 5.9 0.0
Television Advertising Has the  Best Perception Among Persons 18+ Source: TVB Media Comparisons Study 2010.  Knowledge Networks Inc. Custom Survey. Most  Persuasive
Persons: Most Persuasive Advertising (%) Source: TVB Media Comparisons Study 2010.  Knowledge Networks Inc. Custom Survey. Age Television Newspapers Radio Magazines Internet Mobile 18+ 78.1 5.1 6.0 6.1 3.9 0.9 18-34 77.0 3.1 5.4 7.2 6.4 0.9 18-49 77.3 3.0 6.8 6.8 5.2 0.9 25-49 78.6 3.0 6.2 6.3 5.1 0.8 25-54 78.1 3.4 6.4 5.9 5.1 1.1 35-64 78.5 5.3 6.6 5.7 3.1 0.8 65+ 79.0 9.5 4.1 4.9 1.2 1.4 13-17 74.4 7.5 5.2 4.2 8.3 0.3
Persons: Most Persuasive Advertising (%) Source: TVB Media Comparisons Study 2010.  Knowledge Networks Inc. Custom Survey. Household Income Television Newspapers Radio Magazines Internet Mobile Under $25K 82.2 3.7 4.3 6.5 2.2 1.1 $25K-$50K 74.3 5.3 6.8 7.5 5.6 0.5 $50K-$75K 79.7 5.5 5.0 5.6 3.1 1.1 $75K+ 76.3 5.9 6.8 4.7 5.6 0.6 $100K+ 74.5 5.7 7.3 6.9 4.7 0.9
Persons: Most Persuasive Advertising (%) Source: TVB Media Comparisons Study 2010.  Knowledge Networks Inc. Custom Survey. Education Television Newspapers Radio Magazines Internet Mobile <HS Grad 73.8 8.7 6.6 3.2 7.0 0.7 HS Grad 84.7 2.4 3.0 7.3 2.4 0.3 Some College 77.7 2.9 8.3 5.5 3.9 1.7 Coll Grad+ 73.9 7.7 5.9 7.0 4.8 0.6
Television Advertising Has the  Best Perception Among Persons 18+ Source: TVB Media Comparisons Study 2010.  Knowledge Networks Inc. Custom Survey. Most  Engaging
Persons: Most Engaging Advertising (%) Source: TVB Media Comparisons Study 2010.  Knowledge Networks Inc. Custom Survey. Age Television Newspapers Radio Magazines Internet Mobile 18+ 77.2 4.0 4.9 6.9 6.2 0.8 18-34 75.8 2.5 4.8 6.5 9.6 0.8 18-49 76.5 3.4 5.1 6.2 7.5 1.3 25-49 76.1 3.6 4.9 7.7 6.0 1.7 25-54 76.4 3.3 5.4 7.3 6.0 1.4 35-64 78.1 4.6 5.3 5.9 5.1 1.0 65+ 76.4 5.0 2.6 14.8 1.2 0.0 13-17 77.0 0.4 4.2 4.3 12.3 1.8
Persons: Most Engaging Advertising (%) Source: TVB Media Comparisons Study 2010.  Knowledge Networks Inc. Custom Survey. Household Income Television Newspapers Radio Magazines Internet Mobile Under $25K 76.6 3.9 5.4 5.5 8.4 0.3 $25K-$50K 71.1 6.4 4.5 10.3 5.7 2.0 $50K-$75K 81.6 3.8 5.5 4.7 3.8 0.7 $75K+ 79.5 1.6 4.2 6.1 8.1 0.5 $100K+ 81.1 1.0 3.9 4.7 9.3 0.0
Persons: Most Engaging Advertising (%) Source: TVB Media Comparisons Study 2010.  Knowledge Networks Inc. Custom Survey. Education Television Newspapers Radio Magazines Internet Mobile <HS Grad 75.9 5.7 4.8 3.9 9.0 0.8 HS Grad 76.2 4.0 5.2 9.3 4.6 0.7 Some College 78.3 2.6 4.9 7.5 5.8 1.0 Coll Grad+ 78.3 2.9 4.3 5.5 8.0 1.0
More People Learn About Products  and Brands from Television Source: TVB Media Comparisons Study 2010.  Knowledge Networks Inc. Custom Survey. Persons 18+
Persons: Where Most Likely to Learn About Products or Brands They Might Try or Buy  (%) Source: TVB Media Comparisons Study 2010.  Knowledge Networks Inc. Custom Survey. Age Television Newspapers Radio Magazines Internet Mobile 18+ 71.1 8.9 3.9 7.3 7.8 1.0 18-34 67.5 4.2 2.7 8.1 16.1 1.4 18-49 70.5 6.2 3.7 7.4 10.9 1.2 25-49 70.8 6.8 4.0 7.7 9.3 1.4 25-54 71.2 7.2 4.3 7.5 8.7 1.1 35-64 73.2 10.5 5.0 6.4 4.2 0.8 65+ 69.1 14.0 0.9 11.3 4.7 0.0 13-17 76.9 1.3 2.1 11.1 8.2 0.4
Persons: Where Most Likely to Learn About Products or Brands They Might Try or Buy  (%) Source: TVB Media Comparisons Study 2010.  Knowledge Networks Inc. Custom Survey. Household Income Television Newspapers Radio Magazines Internet Mobile Under $25K 74.9 7.9 2.8 5.5 7.7 1.2 $25K-$50K 71.7 7.8 3.5 8.9 6.5 1.6 $50K-$75K 75.4 10.9 3.3 5.9 4.6 0.0 $75K+ 66.7 7.0 4.7 9.6 11.3 0.6 $100K+ 67.0 4.4 4.4 11.1 12.7 0.2
Persons: Where Most Likely to Learn About Products or Brands They Might Try or Buy  (%) Source: TVB Media Comparisons Study 2010.  Knowledge Networks Inc. Custom Survey. Education Television Newspapers Radio Magazines Internet Mobile <HS Grad 77.4 6.1 0.9 7.3 6.8 1.5 HS Grad 77.7 9.3 2.4 5.5 3.8 1.3 Some College 68.5 6.2 6.6 8.0 9.9 0.8 Coll Grad+ 63.0 10.9 4.2 10.4 11.5 0.0
More People Say Broadcast Television  is Their Primary Source of News Source: TVB Media Comparisons Study 2010.  Knowledge Networks Inc. Custom Survey. Persons 18+
Persons:  Primary Source for News (%) Source: TVB Media Comparisons Study 2010.  Knowledge Networks Inc. Custom Survey. Age Broadcast TV Cable News Networks Radio Newspapers Internet Public TV Mobile 18+ 40.9 15.2 7.5 10.2 17.4 7.8 1.1 18-34 28.8 15.1 6.3 7.1 30.4 9.0 3.3 18-49 34.3 14.3 8.7 8.9 24.1 8.0 1.7 25-49 36.9 12.6 10.0 9.3 22.4 7.9 0.9 25-54 38.9 12.6 9.6 9.5 20.6 8.0 0.8 35-64 44.2 15.4 8.5 11.7 12.8 7.4 0.0 65+ 59.0 15.0 5.3 11.3 3.3 6.2 0.0 13-17 37.9 12.3 5.8 7.1 24.7 11.0 1.2
More People Turn to Broadcast Television First for Local Weather, Traffic or Sports Source: TVB Media Comparisons Study 2010.  Knowledge Networks Inc. Custom Survey. Persons 18+
Persons: First Source for  Local Weather, Traffic of Sports (%) Source: TVB Media Comparisons Study 2010.  Knowledge Networks Inc. Custom Survey. Age Broadcast TV Cable News Networks Radio Newspapers Internet Public TV Mobile 18+ 57.1 4.5 9.6 3.7 15.6 7.5 2.0 18-34 43.0 5.2 9.4 1.8 27.8 7.7 5.2 18-49 48.3 4.8 9.2 3.5 22.5 8.6 3.2 25-49 50.1 4.3 9.8 3.6 21.2 8.7 2.4 25-54 52.9 3.9 10.5 3.4 19.5 7.9 2.1 35-64 61.5 3.8 10.0 4.9 11.1 8.0 0.7 65+ 76.7 5.7 7.7 3.0 3.1 3.5 0.3 13-17 43.0 4.4 6.7 5.1 23.2 11.7 6.0
More People Turn to Broadcast Television First for Breaking News Source: TVB Media Comparisons Study 2010.  Knowledge Networks Inc. Custom Survey. Persons 18+
Persons: First Source When a Breaking  News Story is in Progress (%) Source: TVB Media Comparisons Study 2010.  Knowledge Networks Inc. Custom Survey. Age Broadcast TV Cable News Networks Radio Newspapers Internet Public TV Mobile 18+ 46.1 25.6 3.9 1.2 16.1 6.4 0.8 18-34 35.9 21.7 4.9 1.0 26.8 8.2 1.6 18-49 39.8 22.6 4.6 0.8 23.7 7.5 1.1 25-49 41.5 22.2 5.4 0.4 22.3 7.4 0.7 25-54 43.4 22.9 4.9 0.3 20.7 6.9 0.7 35-64 47.7 28.0 3.7 1.4 12.7 6.1 0.4 65+ 68.8 24.2 1.8 0.0 2.0 3.2 0.0 13-17 43.3 20.8 3.0 1.3 22.5 8.7 0.4
More People Feel Broadcast Television  is Most Involved in Their Community Source: TVB Media Comparisons Study 2010.  Knowledge Networks Inc. Custom Survey. Persons 18+
Persons:  Most Involved in Community (%) Source: TVB Media Comparisons Study 2010.  Knowledge Networks Inc. Custom Survey. Age Broadcast TV Cable News Networks Radio Newspapers Internet Public TV 18+ 57.0 2.7 6.6 22.9 3.9 6.8 18-34 51.3 2.9 7.1 19.5 9.1 10.2 18-49 55.7 2.8 6.9 20.5 5.9 8.2 25-49 57.4 2.6 7.2 19.9 4.9 8.0 25-54 58.1 2.3 7.1 20.4 4.4 7.8 35-64 58.7 2.9 6.2 24.5 1.7 6.0 65+ 65.3 0.5 7.1 24.8 1.0 1.4 13-17 42.4 4.9 6.9 17.4 14.0 14.5
High Percentages of Adults Have Ever  Visited Websites Affiliated with  Local Broadcast Television Stations Source: TVB Media Comparisons Study 2010.  Knowledge Networks Inc. Custom Survey.
High Percentages of Adults Have Visited Websites  Affiliated with Local Broadcast Television Stations  in the Past 30 Days Source: TVB Media Comparisons Study 2010.  Knowledge Networks Inc. Custom Survey. Base=Respondents who have ever visited local media website(s).
Local Broadcast Television Station Website Visitors are Likely to View Video Content on These Sites Source: TVB Media Comparisons Study 2010.  Knowledge Networks Inc. Custom Survey. Base=Respondents who visited local broadcast station website(s) in the past 30 days.
Adults Turn to Local Television Station Websites  for Local News and Event Information (%)  Source: TVB Media Comparisons Study 2010.  Knowledge Networks Inc. Custom Survey. Note: Multiple responses allowed.
Thank You

Tvb Media Comparisons 2010 Persons

  • 1.
  • 2.
    TVB Media ComparisonsStudy In the field in January 2010 New Vendor: Knowledge Networks, utilizing their “Knowledge Panel” Online survey Knowledge Panel includes cell-phone only homes, as well as teens 1,562 respondents in total 1,421 P18+ An additional 141 P13-17 New medium added in 2010: Mobile
  • 3.
    Television Reaches MorePeople Each Day than Any Other Medium Source: TVB Media Comparisons Study 2010.  Knowledge Networks Inc. Custom Survey.
  • 4.
    People Reached Yesterday by Major Media (%) Source: TVB Media Comparisons Study 2010.  Knowledge Networks Inc. Custom Survey. Age Television Newspapers Radio Magazines Internet Mobile 18+ 89.5 38.6 60.6 28.6 67.5 14.3 18-34 82.4 23.4 57.5 22.8 75.2 23.8 18-49 85.9 30.2 61.7 25.3 75.3 18.9 25-49 87.5 33.2 66.1 26.6 75.3 17.9 25-54 88.0 35.1 67.0 27.9 73.1 16.8 35-64 92.3 43.1 65.0 31.0 66.2 11.3 65+ 96.9 62.8 45.7 33.4 49.4 0.3 13-17 86.2 19.8 58.4 24.5 79.0 15.4
  • 5.
    People Reached Yesterday by Major Media (%) Source: TVB Media Comparisons Study 2010.  Knowledge Networks Inc. Custom Survey. Household Income Television Newspapers Radio Magazines Internet Mobile Under $25K 91.8 27.2 55.4 21.1 56.0 7.1 $25K-$50K 86.0 40.4 58.8 29.8 62.5 13.7 $50K-$75K 91.7 36.7 60.9 24.8 65.9 11.2 $75K+ 88.4 40.9 64.6 33.9 83.3 21.8 $100K+ 86.8 37.4 63.6 32.4 81.4 25.0
  • 6.
    People Reached Yesterday by Major Media (%) Source: TVB Media Comparisons Study 2010.  Knowledge Networks Inc. Custom Survey. Education Television Newspapers Radio Magazines Internet Mobile <HS Grad 85.9 26.9 46.8 21.7 60.2 9.6 HS Grad 91.9 40.6 60.1 27.6 51.1 6.9 Some College 88.3 36.0 60.0 26.8 76.3 19.2 Coll Grad+ 89.9 42.0 71.9 35.5 85.5 21.2
  • 7.
    People Spend MoreTime with Television Each Day Than They Do with Any Other Medium Source: TVB Media Comparisons Study 2010.  Knowledge Networks Inc. Custom Survey.
  • 8.
    Persons: Time SpentYesterday in Minutes with Major Media Source: TVB Media Comparisons Study 2010.  Knowledge Networks Inc. Custom Survey. Age Television Newspapers Radio Magazines Internet Mobile 18+ 319.2 26.4 91.2 15.6 156.6 19.2 18-34 232.8 13.8 73.2 13.2 192.6 33.0 18-49 267.6 19.2 90.6 13.8 181.2 25.2 25-49 273.6 20.4 100.8 13.8 168.0 21.0 25-54 283.8 21.6 106.2 15.0 160.2 19.2 35-64 348.6 32.4 106.8 16.2 147.0 14.4 65+ 431.4 34.2 59.4 19.2 93.0 0.0 13-17 226.8 7.8 66.6 12.6 152.4 31.2
  • 9.
    Persons: Time SpentYesterday in Minutes with Major Media Source: TVB Media Comparisons Study 2010.  Knowledge Networks Inc. Custom Survey. Household Income Television Newspapers Radio Magazines Internet Mobile Under $25K 411.0 22.2 93.6 12.6 140.4 17.4 $25K-$50K 330.0 23.4 97.2 19.2 150.0 24.0 $50K-$75K 289.8 25.2 91.8 13.2 141.6 11.4 $75K+ 240.6 27.6 76.8 14.4 180.0 24.6 $100K+ 232.8 27.6 67.8 13.2 190.8 28.2
  • 10.
    Persons: Time SpentYesterday in Minutes with Major Media Source: TVB Media Comparisons Study 2010.  Knowledge Networks Inc. Custom Survey. Education Television Newspapers Radio Magazines Internet Mobile <HS Grad 319.8 18.0 64.8 13.8 124.2 22.8 HS Grad 371.4 27.6 94.2 18.0 131.4 12.0 Some College 304.8 19.2 99.0 13.8 173.4 27.0 Coll Grad+ 246.0 32.4 92.4 15.0 190.2 19.8
  • 11.
    Television Advertising Hasthe Best Perception Among Persons 18+ Source: TVB Media Comparisons Study 2010.  Knowledge Networks Inc. Custom Survey. Most Authoritative
  • 12.
    Persons: Most AuthoritativeAdvertising (%) Source: TVB Media Comparisons Study 2010.  Knowledge Networks Inc. Custom Survey. Age Television Newspapers Radio Magazines Internet Mobile 18+ 60.8 15.4 8.6 10.8 4.4 0.1 18-34 56.2 16.4 8.3 9.9 8.7 0.4 18-49 60.0 14.1 9.6 10.1 5.9 0.3 25-49 62.2 12.4 10.5 9.5 5.0 0.4 25-54 61.5 13.6 9.7 10.2 4.6 0.3 35-64 61.7 14.9 9.6 11.1 2.5 0.1 65+ 70.2 14.6 2.3 11.9 1.0 0.0 13-17 67.8 10.3 9.0 7.9 4.6 0.4
  • 13.
    Persons: Most AuthoritativeAdvertising (%) Source: TVB Media Comparisons Study 2010.  Knowledge Networks Inc. Custom Survey. Household Income Television Newspapers Radio Magazines Internet Mobile Under $25K 59.7 14.0 12.1 11.4 2.6 0.2 $25K-$50K 59.9 15.9 7.3 11.9 4.3 0.8 $50K-$75K 66.7 12.6 5.9 10.6 4.2 0.0 $75K+ 60.1 16.1 9.0 9.1 5.7 0.0 $100K+ 61.1 13.9 9.9 11.0 4.1 0.0
  • 14.
    Persons: Most AuthoritativeAdvertising (%) Source: TVB Media Comparisons Study 2010.  Knowledge Networks Inc. Custom Survey. Education Television Newspapers Radio Magazines Internet Mobile <HS Grad 64.9 11.3 12.1 7.0 3.9 0.8 HS Grad 69.2 13.8 4.3 8.7 4.0 0.0 Some College 62.0 11.5 10.1 11.1 5.2 0.1 Coll Grad+ 50.1 22.6 8.5 14.5 4.3 0.0
  • 15.
    Television Advertising Hasthe Best Perception Among Persons 18+ Source: TVB Media Comparisons Study 2010.  Knowledge Networks Inc. Custom Survey. Most Exciting
  • 16.
    Persons: Most ExcitingAdvertising (%) Source: TVB Media Comparisons Study 2010.  Knowledge Networks Inc. Custom Survey. Age Television Newspapers Radio Magazines Internet Mobile 18+ 83.4 2.5 3.2 6.0 4.5 0.4 18-34 78.0 1.6 4.8 6.3 8.7 0.7 18-49 81.1 1.6 4.4 6.7 5.7 0.5 25-49 82.1 1.8 4.0 6.1 5.3 0.6 25-54 82.4 2.2 3.6 6.1 5.1 0.6 35-64 84.8 3.2 2.5 6.4 2.8 0.3 65+ 94.1 1.0 1.8 2.2 1.0 0.0 13-17 85.0 1.0 1.4 5.0 7.2 0.4
  • 17.
    Persons: Most ExcitingAdvertising (%) Source: TVB Media Comparisons Study 2010.  Knowledge Networks Inc. Custom Survey. Household Income Television Newspapers Radio Magazines Internet Mobile Under $25K 82.3 1.2 5.1 6.6 4.1 0.7 $25K-$50K 80.0 4.1 3.9 6.4 5.7 0.0 $50K-$75K 88.1 3.1 1.8 3.2 3.3 0.5 $75K+ 84.5 1.4 2.0 6.7 5.3 0.2 $100K+ 84.9 0.5 1.8 8.5 4.3 0.0
  • 18.
    Persons: Most ExcitingAdvertising (%) Source: TVB Media Comparisons Study 2010.  Knowledge Networks Inc. Custom Survey. Education Television Newspapers Radio Magazines Internet Mobile <HS Grad 82.8 2.8 4.7 3.8 5.7 0.1 HS Grad 84.4 2.1 4.0 6.0 3.5 0.0 Some College 85.9 1.3 2.0 5.6 4.3 0.9 Coll Grad+ 81.3 3.1 2.1 7.6 5.7 0.2
  • 19.
    Television Advertising Hasthe Best Perception Among Persons 18+ Source: TVB Media Comparisons Study 2010.  Knowledge Networks Inc. Custom Survey. Most Influential
  • 20.
    Persons: Most InfluentialAdvertising (%) Source: TVB Media Comparisons Study 2010.  Knowledge Networks Inc. Custom Survey. Age Television Newspapers Radio Magazines Internet Mobile 18+ 85.7 3.1 3.8 2.0 4.5 0.9 18-34 82.5 1.8 2.2 2.2 9.4 1.8 18-49 84.4 2.4 3.4 2.2 6.7 0.9 25-49 84.7 2.4 4.2 2.5 5.9 0.3 25-54 84.6 2.4 4.2 2.6 5.6 0.5 35-64 86.8 3.7 4.6 1.8 2.5 0.5 65+ 88.2 4.1 3.8 2.6 1.3 0.0 13-17 85.7 1.6 1.3 6.8 4.2 0.4
  • 21.
    Persons: Most InfluentialAdvertising (%) Source: TVB Media Comparisons Study 2010.  Knowledge Networks Inc. Custom Survey. Household Income Television Newspapers Radio Magazines Internet Mobile Under $25K 85.7 2.2 1.9 3.9 3.6 2.7 $25K-$50K 81.2 4.2 5.3 2.4 6.3 0.6 $50K-$75K 86.7 3.7 5.5 1.5 2.6 0.0 $75K+ 88.3 2.2 2.0 2.1 5.0 0.4 $100K+ 90.8 1.9 1.3 1.5 4.5 0.0
  • 22.
    Persons: Most InfluentialAdvertising (%) Source: TVB Media Comparisons Study 2010.  Knowledge Networks Inc. Custom Survey. Education Television Newspapers Radio Magazines Internet Mobile <HS Grad 81.0 3.2 4.3 4.6 6.0 0.9 HS Grad 86.0 2.4 2.3 3.2 3.6 2.4 Some College 89.8 1.0 4.9 1.4 3.0 0.0 Coll Grad+ 84.8 5.2 3.0 1.2 5.9 0.0
  • 23.
    Television Advertising Hasthe Best Perception Among Persons 18+ Source: TVB Media Comparisons Study 2010.  Knowledge Networks Inc. Custom Survey. Most Persuasive
  • 24.
    Persons: Most PersuasiveAdvertising (%) Source: TVB Media Comparisons Study 2010.  Knowledge Networks Inc. Custom Survey. Age Television Newspapers Radio Magazines Internet Mobile 18+ 78.1 5.1 6.0 6.1 3.9 0.9 18-34 77.0 3.1 5.4 7.2 6.4 0.9 18-49 77.3 3.0 6.8 6.8 5.2 0.9 25-49 78.6 3.0 6.2 6.3 5.1 0.8 25-54 78.1 3.4 6.4 5.9 5.1 1.1 35-64 78.5 5.3 6.6 5.7 3.1 0.8 65+ 79.0 9.5 4.1 4.9 1.2 1.4 13-17 74.4 7.5 5.2 4.2 8.3 0.3
  • 25.
    Persons: Most PersuasiveAdvertising (%) Source: TVB Media Comparisons Study 2010.  Knowledge Networks Inc. Custom Survey. Household Income Television Newspapers Radio Magazines Internet Mobile Under $25K 82.2 3.7 4.3 6.5 2.2 1.1 $25K-$50K 74.3 5.3 6.8 7.5 5.6 0.5 $50K-$75K 79.7 5.5 5.0 5.6 3.1 1.1 $75K+ 76.3 5.9 6.8 4.7 5.6 0.6 $100K+ 74.5 5.7 7.3 6.9 4.7 0.9
  • 26.
    Persons: Most PersuasiveAdvertising (%) Source: TVB Media Comparisons Study 2010.  Knowledge Networks Inc. Custom Survey. Education Television Newspapers Radio Magazines Internet Mobile <HS Grad 73.8 8.7 6.6 3.2 7.0 0.7 HS Grad 84.7 2.4 3.0 7.3 2.4 0.3 Some College 77.7 2.9 8.3 5.5 3.9 1.7 Coll Grad+ 73.9 7.7 5.9 7.0 4.8 0.6
  • 27.
    Television Advertising Hasthe Best Perception Among Persons 18+ Source: TVB Media Comparisons Study 2010.  Knowledge Networks Inc. Custom Survey. Most Engaging
  • 28.
    Persons: Most EngagingAdvertising (%) Source: TVB Media Comparisons Study 2010.  Knowledge Networks Inc. Custom Survey. Age Television Newspapers Radio Magazines Internet Mobile 18+ 77.2 4.0 4.9 6.9 6.2 0.8 18-34 75.8 2.5 4.8 6.5 9.6 0.8 18-49 76.5 3.4 5.1 6.2 7.5 1.3 25-49 76.1 3.6 4.9 7.7 6.0 1.7 25-54 76.4 3.3 5.4 7.3 6.0 1.4 35-64 78.1 4.6 5.3 5.9 5.1 1.0 65+ 76.4 5.0 2.6 14.8 1.2 0.0 13-17 77.0 0.4 4.2 4.3 12.3 1.8
  • 29.
    Persons: Most EngagingAdvertising (%) Source: TVB Media Comparisons Study 2010.  Knowledge Networks Inc. Custom Survey. Household Income Television Newspapers Radio Magazines Internet Mobile Under $25K 76.6 3.9 5.4 5.5 8.4 0.3 $25K-$50K 71.1 6.4 4.5 10.3 5.7 2.0 $50K-$75K 81.6 3.8 5.5 4.7 3.8 0.7 $75K+ 79.5 1.6 4.2 6.1 8.1 0.5 $100K+ 81.1 1.0 3.9 4.7 9.3 0.0
  • 30.
    Persons: Most EngagingAdvertising (%) Source: TVB Media Comparisons Study 2010.  Knowledge Networks Inc. Custom Survey. Education Television Newspapers Radio Magazines Internet Mobile <HS Grad 75.9 5.7 4.8 3.9 9.0 0.8 HS Grad 76.2 4.0 5.2 9.3 4.6 0.7 Some College 78.3 2.6 4.9 7.5 5.8 1.0 Coll Grad+ 78.3 2.9 4.3 5.5 8.0 1.0
  • 31.
    More People LearnAbout Products and Brands from Television Source: TVB Media Comparisons Study 2010.  Knowledge Networks Inc. Custom Survey. Persons 18+
  • 32.
    Persons: Where MostLikely to Learn About Products or Brands They Might Try or Buy (%) Source: TVB Media Comparisons Study 2010.  Knowledge Networks Inc. Custom Survey. Age Television Newspapers Radio Magazines Internet Mobile 18+ 71.1 8.9 3.9 7.3 7.8 1.0 18-34 67.5 4.2 2.7 8.1 16.1 1.4 18-49 70.5 6.2 3.7 7.4 10.9 1.2 25-49 70.8 6.8 4.0 7.7 9.3 1.4 25-54 71.2 7.2 4.3 7.5 8.7 1.1 35-64 73.2 10.5 5.0 6.4 4.2 0.8 65+ 69.1 14.0 0.9 11.3 4.7 0.0 13-17 76.9 1.3 2.1 11.1 8.2 0.4
  • 33.
    Persons: Where MostLikely to Learn About Products or Brands They Might Try or Buy (%) Source: TVB Media Comparisons Study 2010.  Knowledge Networks Inc. Custom Survey. Household Income Television Newspapers Radio Magazines Internet Mobile Under $25K 74.9 7.9 2.8 5.5 7.7 1.2 $25K-$50K 71.7 7.8 3.5 8.9 6.5 1.6 $50K-$75K 75.4 10.9 3.3 5.9 4.6 0.0 $75K+ 66.7 7.0 4.7 9.6 11.3 0.6 $100K+ 67.0 4.4 4.4 11.1 12.7 0.2
  • 34.
    Persons: Where MostLikely to Learn About Products or Brands They Might Try or Buy (%) Source: TVB Media Comparisons Study 2010.  Knowledge Networks Inc. Custom Survey. Education Television Newspapers Radio Magazines Internet Mobile <HS Grad 77.4 6.1 0.9 7.3 6.8 1.5 HS Grad 77.7 9.3 2.4 5.5 3.8 1.3 Some College 68.5 6.2 6.6 8.0 9.9 0.8 Coll Grad+ 63.0 10.9 4.2 10.4 11.5 0.0
  • 35.
    More People SayBroadcast Television is Their Primary Source of News Source: TVB Media Comparisons Study 2010.  Knowledge Networks Inc. Custom Survey. Persons 18+
  • 36.
    Persons: PrimarySource for News (%) Source: TVB Media Comparisons Study 2010.  Knowledge Networks Inc. Custom Survey. Age Broadcast TV Cable News Networks Radio Newspapers Internet Public TV Mobile 18+ 40.9 15.2 7.5 10.2 17.4 7.8 1.1 18-34 28.8 15.1 6.3 7.1 30.4 9.0 3.3 18-49 34.3 14.3 8.7 8.9 24.1 8.0 1.7 25-49 36.9 12.6 10.0 9.3 22.4 7.9 0.9 25-54 38.9 12.6 9.6 9.5 20.6 8.0 0.8 35-64 44.2 15.4 8.5 11.7 12.8 7.4 0.0 65+ 59.0 15.0 5.3 11.3 3.3 6.2 0.0 13-17 37.9 12.3 5.8 7.1 24.7 11.0 1.2
  • 37.
    More People Turnto Broadcast Television First for Local Weather, Traffic or Sports Source: TVB Media Comparisons Study 2010.  Knowledge Networks Inc. Custom Survey. Persons 18+
  • 38.
    Persons: First Sourcefor Local Weather, Traffic of Sports (%) Source: TVB Media Comparisons Study 2010.  Knowledge Networks Inc. Custom Survey. Age Broadcast TV Cable News Networks Radio Newspapers Internet Public TV Mobile 18+ 57.1 4.5 9.6 3.7 15.6 7.5 2.0 18-34 43.0 5.2 9.4 1.8 27.8 7.7 5.2 18-49 48.3 4.8 9.2 3.5 22.5 8.6 3.2 25-49 50.1 4.3 9.8 3.6 21.2 8.7 2.4 25-54 52.9 3.9 10.5 3.4 19.5 7.9 2.1 35-64 61.5 3.8 10.0 4.9 11.1 8.0 0.7 65+ 76.7 5.7 7.7 3.0 3.1 3.5 0.3 13-17 43.0 4.4 6.7 5.1 23.2 11.7 6.0
  • 39.
    More People Turnto Broadcast Television First for Breaking News Source: TVB Media Comparisons Study 2010.  Knowledge Networks Inc. Custom Survey. Persons 18+
  • 40.
    Persons: First SourceWhen a Breaking News Story is in Progress (%) Source: TVB Media Comparisons Study 2010.  Knowledge Networks Inc. Custom Survey. Age Broadcast TV Cable News Networks Radio Newspapers Internet Public TV Mobile 18+ 46.1 25.6 3.9 1.2 16.1 6.4 0.8 18-34 35.9 21.7 4.9 1.0 26.8 8.2 1.6 18-49 39.8 22.6 4.6 0.8 23.7 7.5 1.1 25-49 41.5 22.2 5.4 0.4 22.3 7.4 0.7 25-54 43.4 22.9 4.9 0.3 20.7 6.9 0.7 35-64 47.7 28.0 3.7 1.4 12.7 6.1 0.4 65+ 68.8 24.2 1.8 0.0 2.0 3.2 0.0 13-17 43.3 20.8 3.0 1.3 22.5 8.7 0.4
  • 41.
    More People FeelBroadcast Television is Most Involved in Their Community Source: TVB Media Comparisons Study 2010.  Knowledge Networks Inc. Custom Survey. Persons 18+
  • 42.
    Persons: MostInvolved in Community (%) Source: TVB Media Comparisons Study 2010.  Knowledge Networks Inc. Custom Survey. Age Broadcast TV Cable News Networks Radio Newspapers Internet Public TV 18+ 57.0 2.7 6.6 22.9 3.9 6.8 18-34 51.3 2.9 7.1 19.5 9.1 10.2 18-49 55.7 2.8 6.9 20.5 5.9 8.2 25-49 57.4 2.6 7.2 19.9 4.9 8.0 25-54 58.1 2.3 7.1 20.4 4.4 7.8 35-64 58.7 2.9 6.2 24.5 1.7 6.0 65+ 65.3 0.5 7.1 24.8 1.0 1.4 13-17 42.4 4.9 6.9 17.4 14.0 14.5
  • 43.
    High Percentages ofAdults Have Ever Visited Websites Affiliated with Local Broadcast Television Stations Source: TVB Media Comparisons Study 2010.  Knowledge Networks Inc. Custom Survey.
  • 44.
    High Percentages ofAdults Have Visited Websites Affiliated with Local Broadcast Television Stations in the Past 30 Days Source: TVB Media Comparisons Study 2010.  Knowledge Networks Inc. Custom Survey. Base=Respondents who have ever visited local media website(s).
  • 45.
    Local Broadcast TelevisionStation Website Visitors are Likely to View Video Content on These Sites Source: TVB Media Comparisons Study 2010.  Knowledge Networks Inc. Custom Survey. Base=Respondents who visited local broadcast station website(s) in the past 30 days.
  • 46.
    Adults Turn toLocal Television Station Websites for Local News and Event Information (%) Source: TVB Media Comparisons Study 2010.  Knowledge Networks Inc. Custom Survey. Note: Multiple responses allowed.
  • 47.