Download to read offline


![6 | P a g e
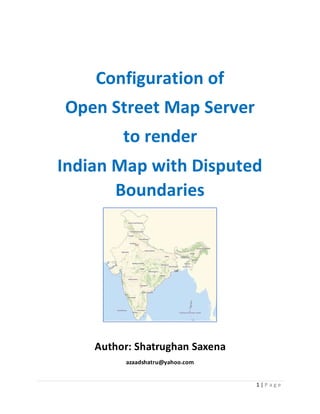
The build mechanism used by osm2pgsql has changed since older versions, so we’ll need to install
some more prerequisites for that:
sudo apt install make cmake g++ libboost-dev libboost-system-dev libboost-filesystem-dev libexpat1-dev zlib1g-
dev libbz2-dev libpq-dev libgeos-dev libgeos++-dev libproj-dev lua5.2 liblua5.2-dev
Again, say yes to install.
mkdir build && cd build
cmake ..
(the output from that should end with “build files have been written to…)
make
(the output from that should finish with “[100%] Built target osm2pgsql”)
sudo make install
Mapnik
Next, we’ll install Mapnik. We’ll use the default version in Ubuntu 18.04:
sudo apt-get install autoconf apache2-dev libtool libxml2-dev libbz2-dev libgeos-dev libgeos++-dev libproj-dev
gdal-bin libmapnik-dev mapnik-utils python-mapnik ttf-dejavu
We’ll check that Mapnik has been installed correctly:
python
>>> import mapnik
>>>
If python replies with the second chevron prompt >>> and without errors, then Mapnik library was
found by Python. Congratulations! You can leave Python with this command:
>>> quit()
Install mod_tile and renderd
Next, we’ll install mod_tile and renderd.“mod_tile” is an Apache module that handlesrequestsfor tiles;
“renderd” is a daemon that actually renders tiles when “mod_tile” requests them. We’ll use the
“switch2osm” branch of mod_tile: https://github.com/SomeoneElseOSM/mod_tile, which is itself
forked from https://github.com/openstreetmap/mod_tile,butmodified so that it supportsUbuntu 16.04,
and with a couple of other changes to work on a standard Ubuntu server rather than one of OSM’s
rendering servers.Compile the mod_tile source code:
cd ~/src](https://image.slidesharecdn.com/configurationofosmservertoredndercorrectmapofindia-190718220149/85/Tutorial-to-setup-OpenStreetMap-tileserver-with-customized-boundaries-of-India-6-320.jpg)
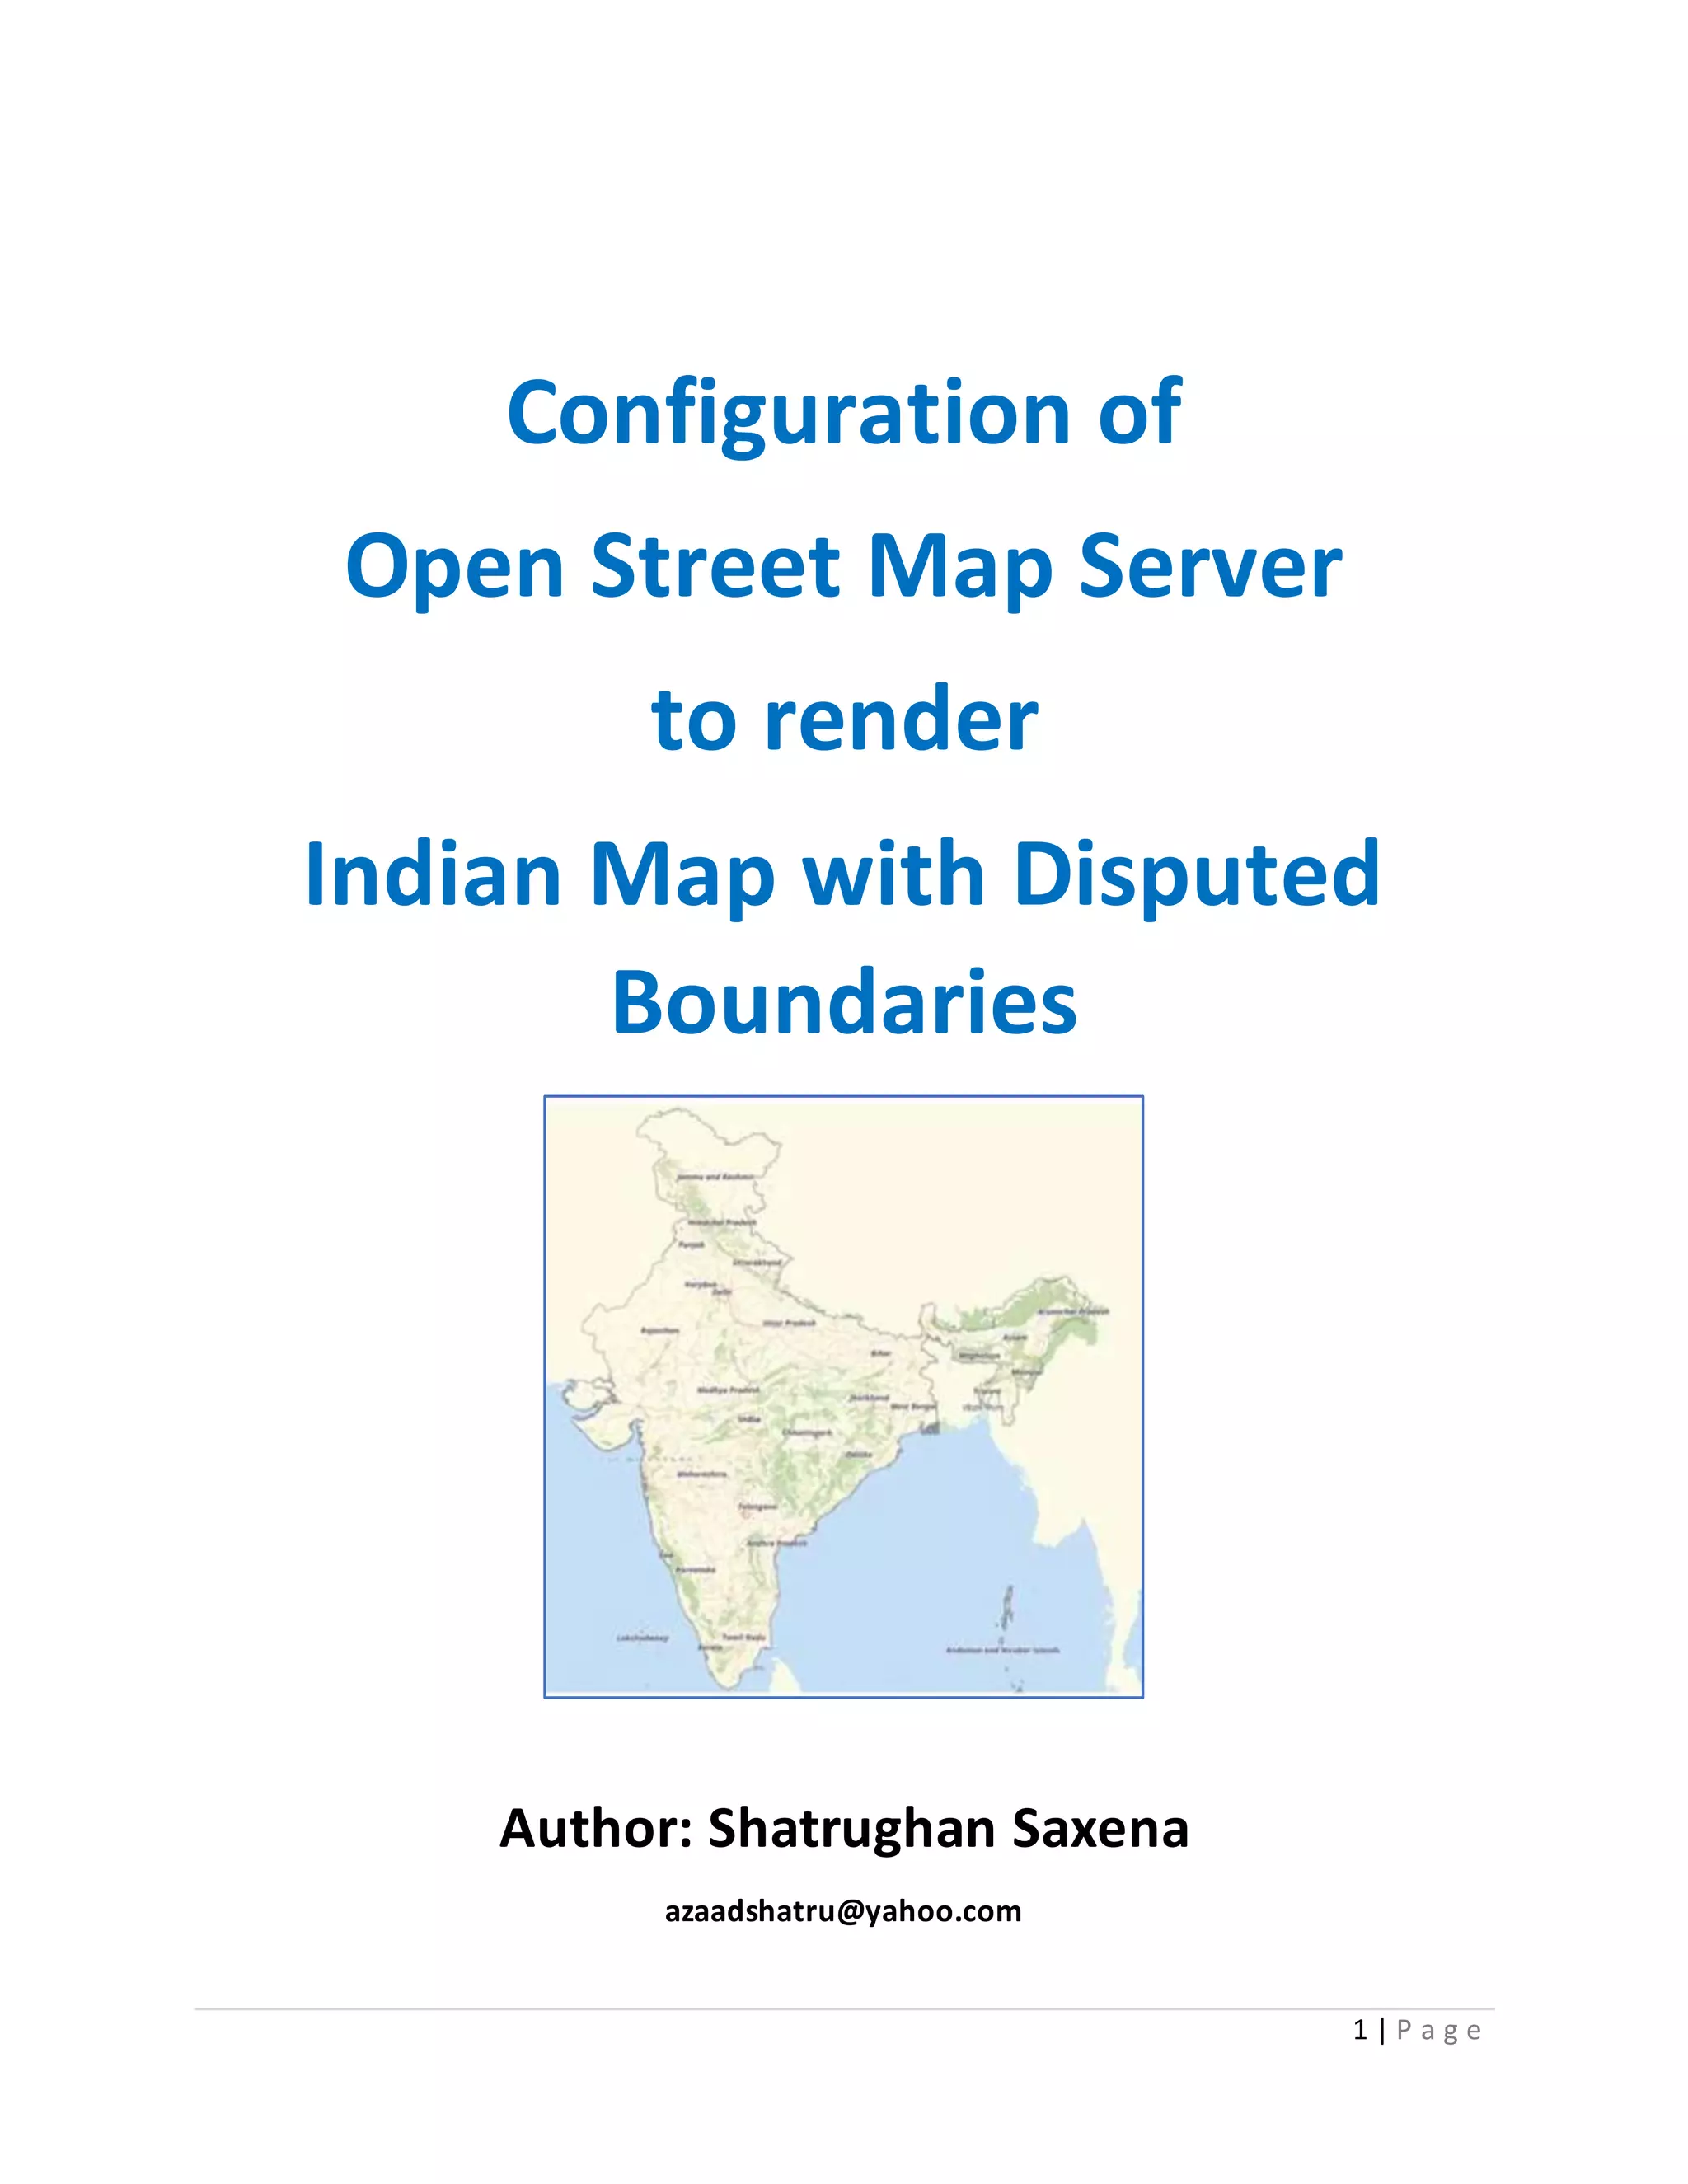
![7 | P a g e
git clone -b switch2osm git://github.com/SomeoneElseOSM/mod_tile.git
cd mod_tile
./autogen.sh
(that should finish with “autoreconf: Leaving directory `.'”)
./configure
(that should finish with “config.status: executing libtool commands”)
make
Note that some “worrying” messages will scroll up the screen here. However it should finish with
“make[1]: Leaving directory ‘/home/osm/src/mod_tile'”.
sudo make install
(that should finish with “make[1]: Leaving directory ‘/home/osm/src/mod_tile'”)
sudo make install-mod_tile
(that should finish with “chmod 644 /usr/lib/apache2/modules/mod_tile.so”)
sudo ldconfig
(that shouldn’t reply with anything)
Stylesheet configuration
Now that all of the necessary software is installed, you will need to download and configure a
stylesheet. The style we’ll use here is the one thatuse by the “standard” map on the openstreetmap.org
website. It’s chosen because it’s well documented and should work anywhere in the world (including
in places with non-latin place names). There are a couple of downsides though – it’s very much a
compromise designed to work globally, and it’s quite complicated to understand and modify, should
you need to do that.
The home of “OpenStreetMap Carto” on the web is
https://github.com/gravitystorm/openstreetmap-carto/
and it has its own installation instructions at
https://github.com/gravitystorm/openstreetmap-carto/blob/master/INSTALL.md
although we’ll cover everything that needs to be done here. Here we’re assuming that we’re storing
the stylesheet details in a directory below “src” below the home directory of the “osm” user (or
whichever other one you are using)
cd ~/src](https://image.slidesharecdn.com/configurationofosmservertoredndercorrectmapofindia-190718220149/85/Tutorial-to-setup-OpenStreetMap-tileserver-with-customized-boundaries-of-India-7-320.jpg)


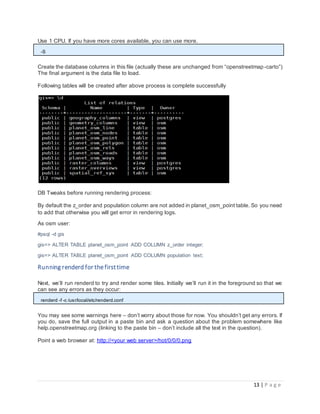
![10 | P a g e
cp configure.py.sample configure.py
vi configure.py
Change the config line pointing to ~/Documents/Mapbox/project to /usr/local/share/maps/style
instead and change dbname from osm to gis. Save and exit.
Run the pre-processor and then carto:
./make.py
cd ../OSMBright/
carto project.mml > OSMBright.xml
You now have a Mapnik XML stylesheetat /usr/local/share/maps/style/OSMBright/OSMBright.xml
.
Setting up your webserver
Next we need to plug renderd and mod_tile into the Apache webserver, ready to receive tile requests.
Configure renderd
Change the the renderd settings by editing the /usr/local/etc/renderd.conf (you’ll need to do it as root
via “sudo”) and change the following five lines, uncommenting (removing the ‘;’) when required. They
are found in the [renderd], [mapnik] and [default] sections.
socketname=/var/run/renderd/renderd.sock
plugins_dir=/usr/local/lib/mapnik/input
font_dir=/usr/share/fonts/truetype/ttf-dejavu
XML=/usr/local/share/maps/style/OSMBright/OSMBright.xml
HOST=localhost
Create the files required for the mod_tile system to run (remember to change username to your user’s
name ‘osm’):
sudo mkdir /var/run/renderd
sudo chown osm /var/run/renderd
sudo mkdir /var/lib/mod_tile
sudo chown osm /var/lib/mod_tile
Configure mod_tile
Next, we need to tell the Apache web server about our new mod_tile installation.
Using your favourite text editor, create the file /etc/apache2/conf-available/mod_tile.conf and add one
line:
sudo vi /etc/apache2/conf-available/mod_tile.conf
Copy the following line in the newly created mod_tile.conf fie and save it.
LoadModule tile_module /usr/lib/apache2/modules/mod_tile.so
Apache’s default website configuration file needs to be modified to include mod_tile settings. Modify
the file /etc/apache2/sites-available/000-default.conf to include the following lines immediately after
the admin e-mail address line:
sudo vi /etc/apache2/sites-available/000-default.conf](https://image.slidesharecdn.com/configurationofosmservertoredndercorrectmapofindia-190718220149/85/Tutorial-to-setup-OpenStreetMap-tileserver-with-customized-boundaries-of-India-10-320.jpg)


![14 | P a g e
You should see a map of whole world map without boundaries and India with India boundaries in your
browser and some more debug on the command line, including “DEBUG: START TILE” and “DEBUG:
DONE TILE”. Ignore any “DEBUG: Failed to read cmd on fd” message – it is not an error. If you don’t
get a tile and get other errors again save the full output in a paste bin and ask a question about the
problem somewhere like help.openstreetmap.org.
If that all works, press control-c to stop the foreground rendering process.
Running renderd in the background
Next we’ll set up “renderd” to run in the background. First, edit the “~/src/mod_tile/debian/renderd.init”
file so that “RUNASUSER” is set to the non-root account that you have used before, such as “osm”,
then copy it to the system directory:
vi ~/src/mod_tile/debian/renderd.init
sudo cp ~/src/mod_tile/debian/renderd.init /etc/init.d/renderd
sudo chmod u+x /etc/init.d/renderd
sudo cp ~/src/mod_tile/debian/renderd.service /lib/systemd/system/
The “renderd.service” file is a “systemd” service file. The version used here just calls old-style init
commands. In order to test that the start command works:
sudo /etc/init.d/renderd start
(that should reply with “[ ok ] Starting renderd (via systemctl): renderd.service.”)
To make it start automatically every time:
sudo systemctl enable renderd](https://image.slidesharecdn.com/configurationofosmservertoredndercorrectmapofindia-190718220149/85/Tutorial-to-setup-OpenStreetMap-tileserver-with-customized-boundaries-of-India-14-320.jpg)
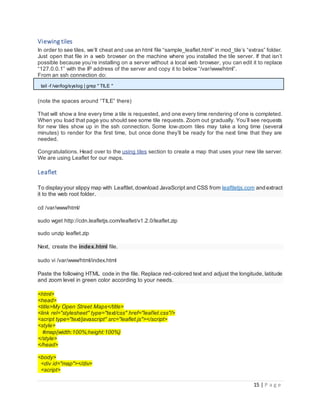
![16 | P a g e
var map = L.map('map').setView([23.259933,77.412613],4.5);
L.tileLayer('http://<your web server>/hot/{z}/{x}/{y}.png',{maxZoom:18}).addTo(map);
</script>
</body>
</html>
Save and close the file. Restart apache2 service. Now you can view your slippy map by typing your
server IP address in browser.
http://<your web server>/
The above map shows the India only map without India’s complete administrative
boundaries also called as disputed boundaries.](https://image.slidesharecdn.com/configurationofosmservertoredndercorrectmapofindia-190718220149/85/Tutorial-to-setup-OpenStreetMap-tileserver-with-customized-boundaries-of-India-16-320.jpg)


![20 | P a g e
Successful completion of run.py script
Make sure you have data populated inside this table, other you need to check what went
wrong and run run.py once again.
Edit OSMBright.xml Style File
Hide any borders which have the ''disputed'' tag set to yes. Overlay our custom ''claimed_by
(India)'' data on the map when rendering tiles. For the second step above, find the
OSMBright.xml style after cloning the repository and building the style file. Find the Layer
definition for ''admin''. These are the administrative boundaries we need to selectively hide.
The existing xml would look something like this:
/usr/local/share/maps/style/OSMBright/OSMBright.xml
Existing entry will look like the code below:
<Layer name="admin" srs="+proj=merc +a=6378137 +b=6378137 +lat_ts=0.0 +lon_0=0.0 +
x_0=0.0 +y_0=0.0 +k=1.0 +units=m +nadgrids=@null +wktext +no_defs +over">
<StyleName><![CDATA[admin]]></StyleName>
<Datasource>
<Parameter name="dbname"><![CDATA[gis]]></Parameter>
<Parameter name="extent"><![CDATA[-20037508.34,-20037508.34,20037508.34,2003
7508.34]]></Parameter>
<Parameter name="geometry_field"><![CDATA[way]]></Parameter>](https://image.slidesharecdn.com/configurationofosmservertoredndercorrectmapofindia-190718220149/85/Tutorial-to-setup-OpenStreetMap-tileserver-with-customized-boundaries-of-India-20-320.jpg)
![21 | P a g e
<Parameter name="id"><![CDATA[admin]]></Parameter>
<Parameter name="key_field"><![CDATA[]]></Parameter>
<Parameter name="project"><![CDATA[osm-bright-imposm]]></Parameter>
<Parameter name="table"><![CDATA[( SELECT way, admin_level
FROM planet_osm_line
WHERE boundary = 'administrative'
AND admin_level IN ('2','3','4')
) AS data]]></Parameter>
<Parameter name="type"><![CDATA[postgis]]></Parameter>
</Datasource>
</Layer>
Edit it to look like this:
<Layer name="admin" srs="+proj=merc +a=6378137 +b=6378137 +lat_ts=0.0 +lon_0=0.0 +
x_0=0.0 +y_0=0.0 +k=1.0 +units=m +nadgrids=@null +wktext +no_defs +over">
<StyleName>admin</StyleName>
<Datasource>
<Parameter name="dbname"><![CDATA[gis]]></Parameter>
<Parameter name="extent"><![CDATA[-20037508.34,-20037508.34,20037508.34,
20037508.34]]></Parameter>
<Parameter name="geometry_field"><![CDATA[geom]]></Parameter>
<Parameter name="id"><![CDATA[admin]]></Parameter>
<Parameter name="key_field"><![CDATA[]]></Parameter>
<Parameter name="project"><![CDATA[osm-bright-imposm]]></Parameter>
<Parameter name="table"><![CDATA[( SELECT geom, admin_level, disputed, mar
itime FROM carto_boundary WHERE admin_level IN ('1','2','3','4') AND disputed = 0 ) AS da
ta]]></Parameter>
<Parameter name="type"><![CDATA[postgis]]></Parameter>
</Datasource>
</Layer>
Explanation of the changes: * Instead of using ''planet_osm_line'', use the ''carto_boundary''
table, which has the ''disputed'' information.
Only apply the style and render the boundary if ''disputed = 0''.
In the next step, we will overlay the ''claimed_by'' information. For this, the
https://github.com/datameet/maps/tree/master/Country should be used to generate the data
. For the borders claimed by India, download the file india-osm.geojson. Rename the file and
remove hyphen from file name (indiaosm.geojson). Copy the file to
server at /usr/local/share/maps/style/osm-bright-master/geojson/boundary_claimed_b
y_india folder. If this folder doesn’t exist, create one.
Add the following definitions to the OSMBright.xml style file.
<Layer name="india_boundary" status="on" minimum-scale-denominator="7500" maximum-
scale-denominator="5000000000" srs="+proj=longlat +ellps=WGS84 +datum=WGS84 +no_
defs">
<StyleName>india_boundary</StyleName>](https://image.slidesharecdn.com/configurationofosmservertoredndercorrectmapofindia-190718220149/85/Tutorial-to-setup-OpenStreetMap-tileserver-with-customized-boundaries-of-India-21-320.jpg)
![22 | P a g e
<Datasource>
<Parameter name="layer"><![CDATA[indiaosm]]></Parameter>
<Parameter name="type"><![CDATA[ogr]]></Parameter>
<Parameter name="file"><![CDATA[/usr/local/share/maps/style/osm-bright-mas
ter/geojson/boundary_claimed_by_india/indiaosm.geojson]]></Parameter>
</Datasource>
</Layer>
Additionally, you would need to create the ''india_boundary'' style, which should be a copy
of the ''admin'' style minus all entries using filters. In our case it looks like this: all filter
enteries are removed.
<Style name="india_boundary" filter-mode="first" opacity="0.5">
<Rule>
<MaxScaleDenominator>3000000</MaxScaleDenominator>
<LineSymbolizer stroke-width="4" stroke-linecap="round" stroke-linejoin="
round" stroke="#444466" />
</Rule>
<Rule>
<MaxScaleDenominator>12500000</MaxScaleDenominator>
<MinScaleDenominator>3000000</MinScaleDenominator>
<LineSymbolizer stroke-width="2" stroke-linecap="round" stroke-linejoin="
round" stroke="#444466" />
</Rule>
<Rule>
<MaxScaleDenominator>50000000</MaxScaleDenominator>
<MinScaleDenominator>12500000</MinScaleDenominator>
<LineSymbolizer stroke-width="1.2" stroke-linecap="round" stroke-linejoin
="round" stroke="#444466" />
</Rule>
<Rule>
<MinScaleDenominator>50000000</MinScaleDenominator>
<LineSymbolizer stroke-width="0.8" stroke-linecap="round" stroke-linejoin
="round" stroke="#444466" />
</Rule>
<Rule>
<LineSymbolizer stroke-linejoin="round" stroke="#444466" />
</Rule>
</Style>
Once you have made these changes, restart the apache server and start the tile rendering
process.
You should now see the administrative boundaries as required. Please wait for some time
for tiles to get rendered.](https://image.slidesharecdn.com/configurationofosmservertoredndercorrectmapofindia-190718220149/85/Tutorial-to-setup-OpenStreetMap-tileserver-with-customized-boundaries-of-India-22-320.jpg)


The document provides a comprehensive guide on building and configuring an OpenStreetMap tile server using Ubuntu 18.04 LTS, detailing steps for software installation, database setup, and rendering tile configurations. It covers the installation of essential components such as PostgreSQL/PostGIS, osm2pgsql, Mapnik, and mod_tile, as well as tuning the system for optimal performance. Additionally, the document addresses correcting the Indian map regarding disputed borders with Pakistan and China, providing specific instructions for various configurations and stylesheet adjustments.
![[ Pycon Korea 2017 ] Infrastructure as Code를위한 Ansible 활용](https://cdn.slidesharecdn.com/ss_thumbnails/pycon2017iacansible-170811160817-thumbnail.jpg?width=640&height=640&fit=bounds)
![[MeetUp][2nd] 오리뎅이의_쿠버네티스_네트워킹_v1.2](https://cdn.slidesharecdn.com/ss_thumbnails/3-191220022100-thumbnail.jpg?width=640&height=640&fit=bounds)