


![empirical bayesian@ieee.org
Proof of Glivenko-Cantelli Theorem
After R. Durrett, 2010, 4th edition, Probability: Theory and Examples, 76-77
1 Fix x. Let Zn = IXn ≤x (x ).
2 Since Zn i.i.d. with E [Zn ] = P (Xn < x ) = F (x − ) = limy →x F (y ), strong law ⇒ Fn (x − ) = n ∑n =1 Zk → F (x − ) a.s.
1
k
3 i
For 1 ≤ i ≤ k − 1, let xi ,k = inf{y : F (y ) ≥ k }.
4 Pointwise convergence of Fn (x ), Fn (x − ) ⇒ can pick Wk so
1
n ≥ Wk ⇒ |Fn (xi ,k ) − F (xi ,k )| <
k
1
n ≥ Wk ⇒ |Fn (xi− ) − F (xi− )| <
,k ,k k
for 1 ≤ i ≤ k − 1.
5 Let x0,k = −∞ and xk ,k = ∞. Then last inequalities valid for i = 0 or i = k .
6 Given u = xi −1,k or u = xi ,k , 1 ≤ i ≤ k − 1, n ≥ Wk , monotonicity of Fn , monotonicity of F , F (xi− ) − F (xi −1,k ) ≤ k ,
,k
1
1 2 2
Fn (u ) ≤ Fn (xi− ) ≤ F (xi− ) +
,k ,k ≤ F (xi −1,k ) + ≤ F (u ) +
k k k
1 2 2
Fn (u ) ≥ Fn (xi −1,k ) ≥ F (xi −1,k ) − ≥ F (xi− ) −
,k ≥ F (u ) −
k k k
7 2
Consequently, supu |Fn (u ) − F (u )| ≤ k . Result proved.
J. T. Galkowski Bootstrapping Independent Data 20 / 44](https://image.slidesharecdn.com/2012bootstrapresamplingwithindependentdatajgalkowskipresentation-13535097066406-phpapp02-121121085653-phpapp02/75/Tutorial-on-Bootstrap-resampling-with-independent-data-20-2048.jpg)


 −→ δ y = f(δ x ) + δ f (x + δ x )
This is gotten wrong a lot. Important to separate variation in data from variation
in model.
Will present the standard set of methods, and then offer one Bootstrap-based
alternative.
J. T. Galkowski Bootstrapping Independent Data 27 / 44](https://image.slidesharecdn.com/2012bootstrapresamplingwithindependentdatajgalkowskipresentation-13535097066406-phpapp02-121121085653-phpapp02/75/Tutorial-on-Bootstrap-resampling-with-independent-data-27-2048.jpg)


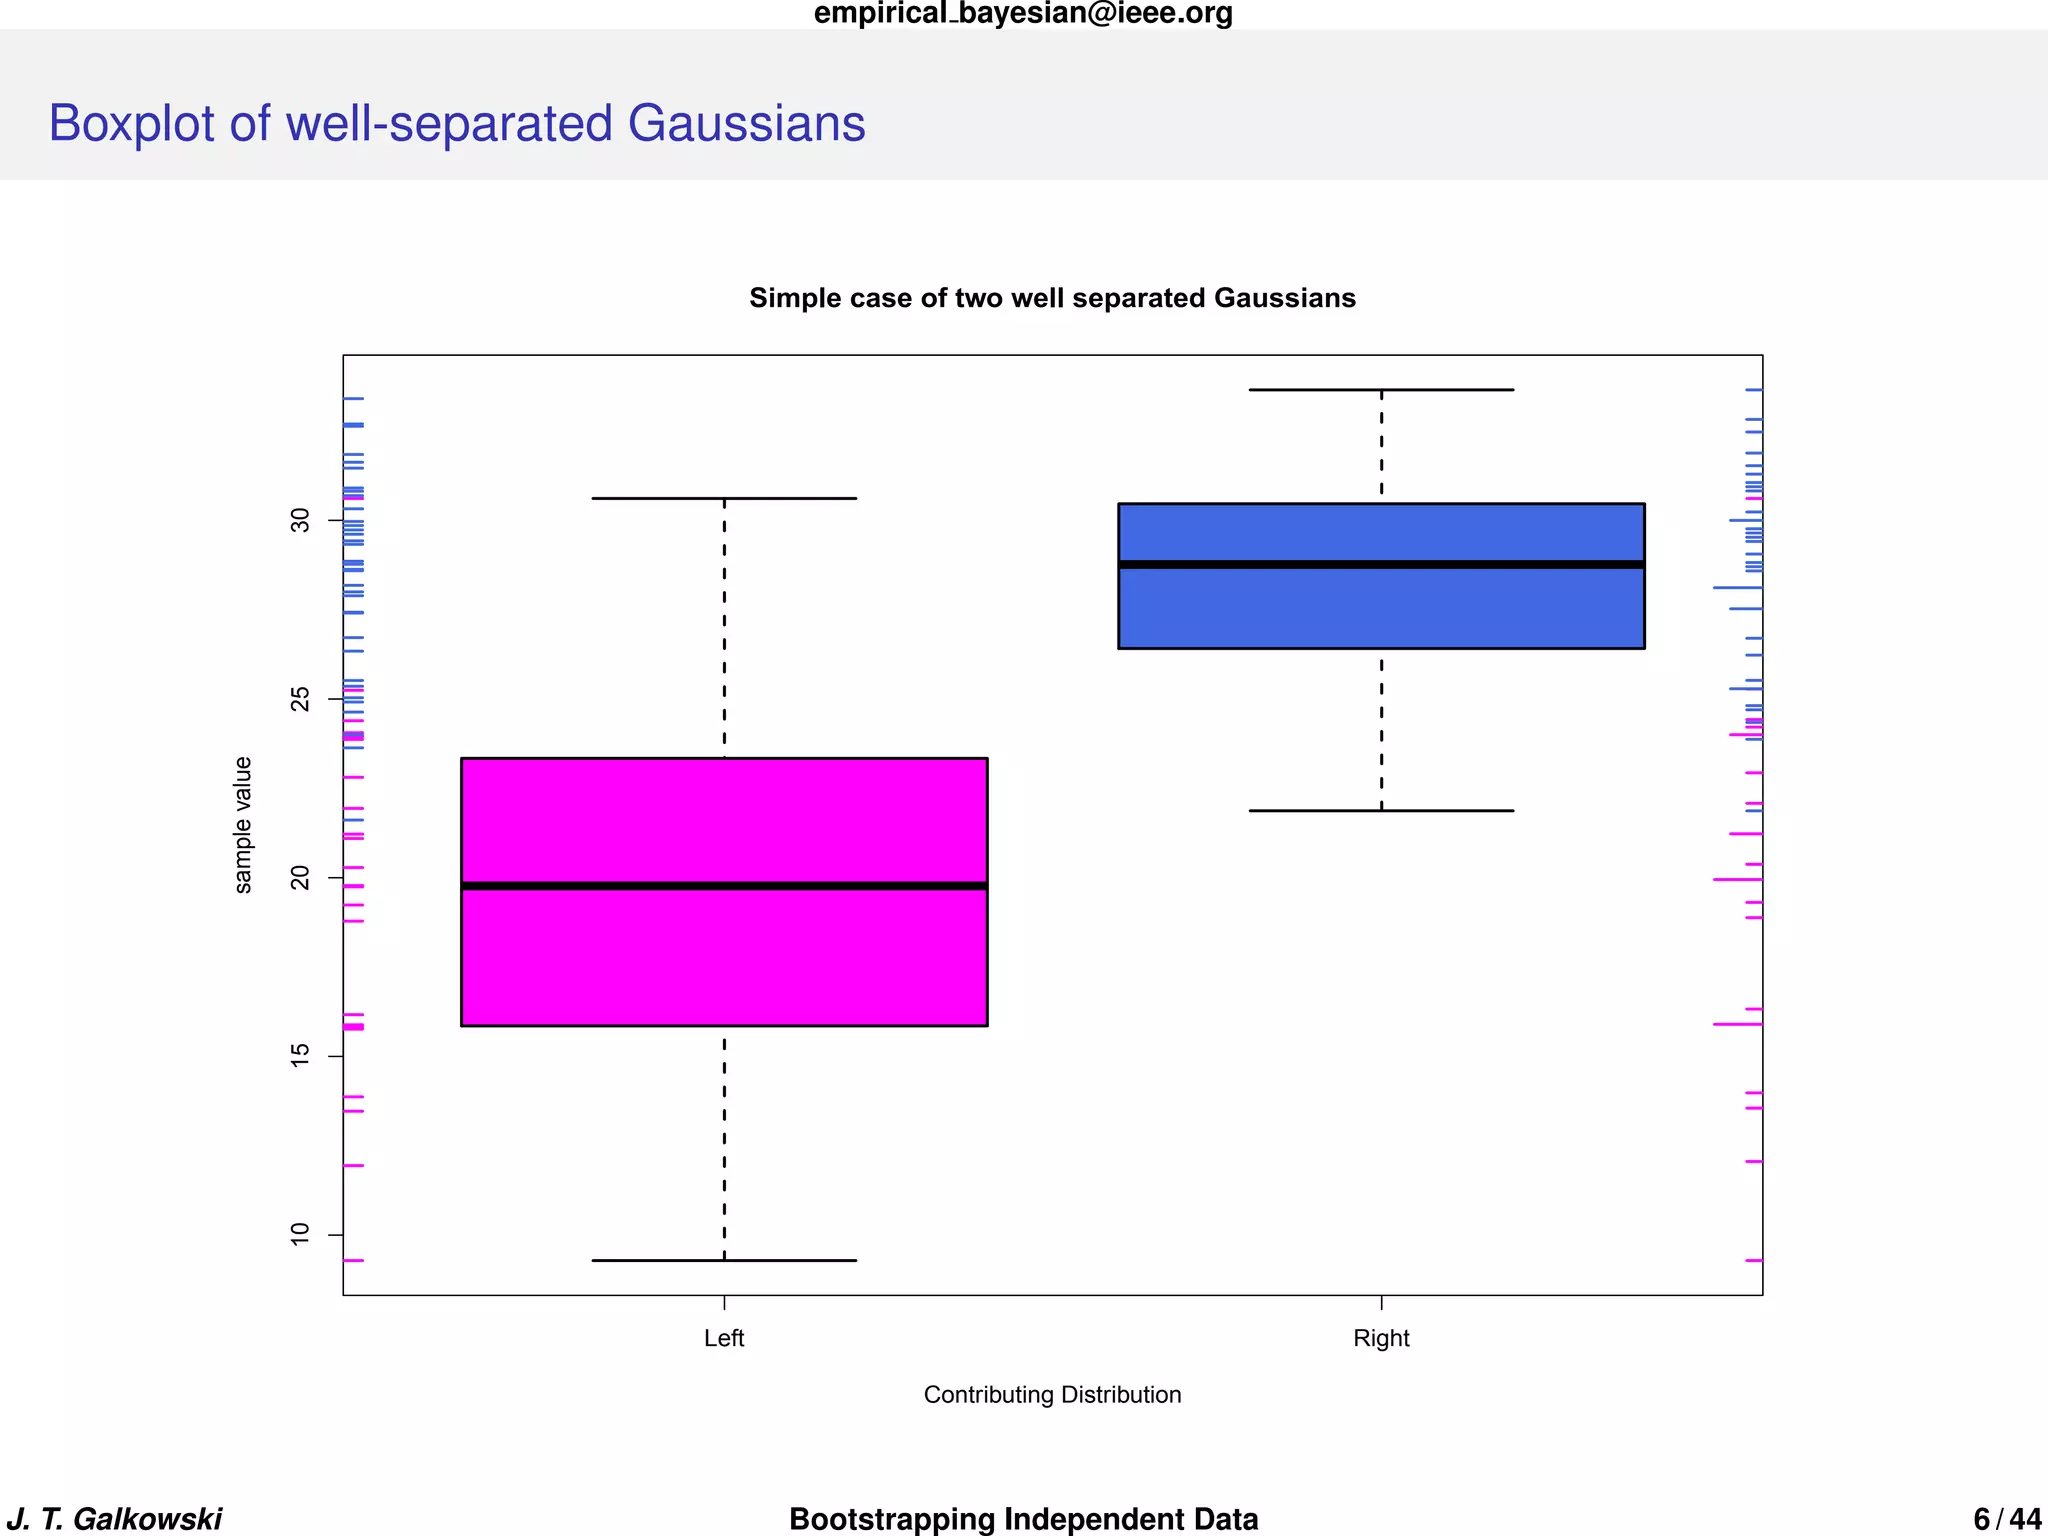
The document discusses uncertainty quantification and the bootstrap resampling method. It provides a sketch of how the bootstrap works by resampling the data with replacement many times to estimate properties of the population. As an example, it applies the bootstrap to test data modeled as two well-separated Gaussian distributions and shows that the bootstrap replicates the results of a standard t-test and characterizes the uncertainty in the difference between the distributions.