Download to read offline

![IRIS
Twenty-three patients (33%) had IRIS (95% CI 22–44), 19 cases
being considered ‘definite’ according to the French, INSHI
(International Network for the Study of HIV IRIS) and ERC classi-
fications. Discrepancies among the three classifications were
noted in the remaining four cases.
Five episodes (22%) were considered serious (two cases of
acute renal failure, two cerebral tuberculomas with seizures or
intracranial hypertension, and one case of segmental bronchus
compression), and 12 patients (52%) required steroid therapy.
The median time between cART initiation and the onset of IRIS
was 8 days (IQR 5–14). In multivariate analysis, a higher BMI
(OR¼0.84 per additional unit, 95% CI 0.71–0.98, P¼0.03) and
a higher haemoglobin level (OR¼0.66 per additional unit, 95%
CI 0.45–0.95, P¼0.02) were protective against IRIS (Table 4).
Discussion
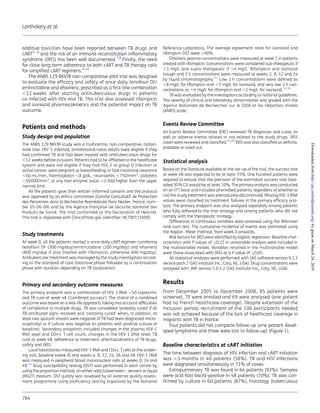
In the ANRS 129 BKVIR trial, 83% of HIV-infected patients with TB
were successfully treated, with tuberculosis cure and HIV viral
control at week 48. Our findings thus support UK, EACS (European
AIDS Clinical Society) and WHO recommendations advocating
first-line tenofovir DF/emtricitabine and efavirenz combination
therapy for antiretroviral-naive HIV-infected patients receiving TB
drugs.3,17
Previous studies of efavirenz combined with other nucleoside
analogues have also given encouraging results.18–23
Subsequent
studies favoured efavirenz rather than nevirapine co-administration
with rifampicin.6
Given the deleterious pharmacokinetic interaction
between rifampicin and efavirenz,24
we initially prescribed efavirenz
at 800 mg/day. However, 50% of patients who discontinued the
study regimen did so because of efavirenz intolerance, mostly at
800 mg/day, in keeping with British data.25
The optimal efavirenz
dosage for use in combination with rifampicin remains a matter
of heated debate. One study showed that ethnicity and low body
weight influenced efavirenz concentrations.26
Earlier studies of
slim Thai patients failed to show differences in efavirenz concentra-
tions or efficacy when used with rifampicin.20,21
In South Africa, efa-
virenz at 600 mg/day plus rifampicin was associated with wide
variations in efavirenz concentrations and with neurological adverse
effects in up to 50% of patients but resulted in good virological out-
comes.27
A more recent study showed that efavirenz concentra-
tions did not decrease after adding rifampicin when 600 mg/day
dosage was used, while they increased when 800 mg/day dosage
was used.28
Our data support recommendations advocating efavir-
enz at 600 mg/day for co-administration with rifampicin, but efavir-
enz at 800 mg/day remains an option for patients weighing
.60 kg,3,4
who tend to have lower efavirenz concentrations.29
A
higher risk of treatment failure was found when the efavirenz
dose was not adjusted to body weight,30
but the recent STRIDE
study showed no benefit of weight-based dosing.31
The tenofovir
DF/emtricitabine and efavirenz combination tested here, although
associated with a high rate of well-known adverse effects (partially
due to close observation in the hospital setting), appears to be an
acceptable option. Other options, such as nevirapine-containing
regimens, could also be acceptable.32
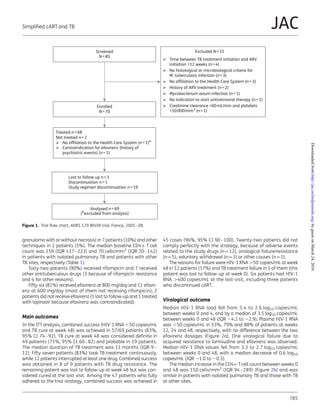
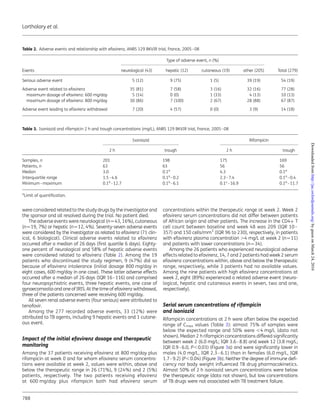
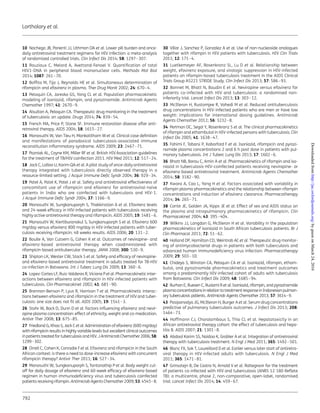
We found low concentrations of both rifampicin (75% of
patients) and isoniazid (50% of patients) in these HIV-infected
patients with TB. In four earlier studies, around three-quarters of
patients had rifampicin concentrations ,8 mg/L (,4 mg/L in
around one-third of cases).33–36
In three studies, around 50% of
patients had isoniazid concentrations ,3 mg/L.33,35,36
Of note, we
found no influence of body weight on rifampicin concentrations,
contrary to a recent study of South African patients.33
Two former
studies and the present study showed lower rifampicin concentra-
tions in male patients.33,37
Surprisingly, isoniazid plasma levels were
also low, whereas HIV serostatus is supposed to have little or no
effect on isoniazid concentrations.38–40
We found that low rifampi-
cin and isoniazid serum concentrations did not affect TB treatment
efficacy. Likewise, Chideya et al.41
and Burhan et al.42
only found a
relationship between low pyrazinamide concentrations and poorer
outcome in Botswana and Indonesia, respectively. Together, these
data suggest that routine monitoring of isoniazid and rifampicin
concentrations is not mandatory for HIV-infected patients with
TB, even though low drug exposure is predictive of poor clinical out-
come in all-comer patients with tuberculosis.43
Twelve percent of adverse events were attributed to TB drugs,
including 9/12 hepatic and 1/19 cutaneous events, although it
should be noted that recording only started at the time of inclu-
sion and that early TB drug-related adverse effects were therefore
0
2 8
Visit week
12 24
10
(a)
(b)
Rifampicin2hconc(mg/L)
0
F
Sex
M
10
Rifampicin2hconc(mg/L)
Figure 3. (a) Median rifampicin 2 h concentrations at each protocol visit
and (b) according to gender [male (M); female (F)]. Error bars indicate
the range of concentrations and boxes represent the IQRs. ANRS 129
BKIVR trial, France, 2005–08.
Simplified cART and TB
789
JAC
byguestonMarch24,2016http://jac.oxfordjournals.org/Downloadedfrom](https://image.slidesharecdn.com/truvadaefvenvihtb-160324214926/85/Truvada-EFV-en-VIH-TB-7-320.jpg)

The ANRS 129 BKVIR trial evaluated the efficacy and safety of once-daily tenofovir df/emtricitabine and efavirenz in HIV-infected patients with tuberculosis. At 48 weeks, combined success of achieving HIV-1 RNA <50 copies/ml and TB cure was 83%, with a significantly higher success rate (96%) among adherent patients. The trial also found that serious adverse events occurred in 45% of patients, with most resolving without long-term issues.


![PERI-PROSTHETIC FRACTURE NAIL-PLATE CONSTRUCT [NPC].pptx](https://cdn.slidesharecdn.com/ss_thumbnails/drarunkumardrmohamedashrafperiprostheticfrasturenail-plateconstructnpc-260209164459-7e9d15a1-thumbnail.jpg?width=640&height=640&fit=bounds)


