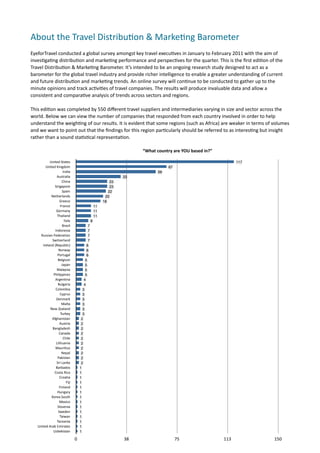
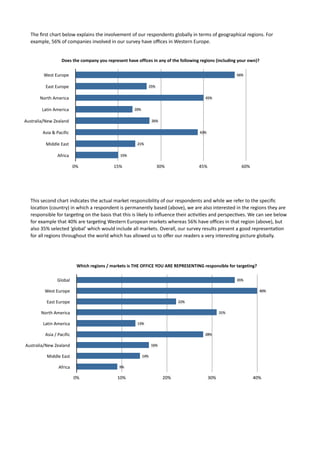
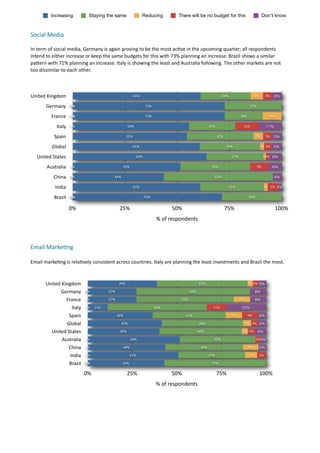
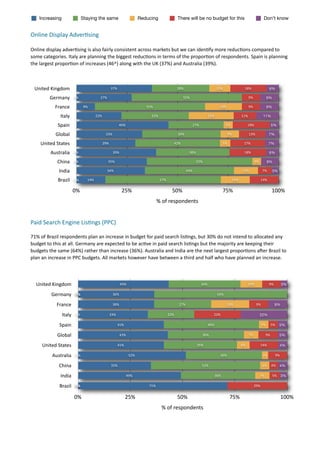
EyeforTravel conducted a global survey amongst key travel execu7ves
in
January
to
February
2011
with
the
aim
of
inves7ga7ng
distribu7on
and
marke7ng
performance
and
perspec7ves
for
the
quarter.
This
is
the
first
edi7on
of
the
Travel
Distribu7on
&
Marke7ng
Barometer.
It’s
intended
to
be
an
ongoing
research
study
designed
to
act
as
a
barometer
for
the
global
travel
industry
and
provide
richer
intelligence
to
enable
a
greater
understanding
of
current
and
future
distribu7on
and
marke7ng
trends.
2. About
the
Travel
Distribu.on
&
Marke.ng
Barometer
EyeforTravel
conducted
a
global
survey
amongst
key
travel
execu7ves
in
January
to
February
2011
with
the
aim
of
inves7ga7ng
distribu7on
and
marke7ng
performance
and
perspec7ves
for
the
quarter.
This
is
the
first
edi7on
of
the
Travel
Distribu7on
&
Marke7ng
Barometer.
It’s
intended
to
be
an
ongoing
research
study
designed
to
act
as
a
barometer
for
the
global
travel
industry
and
provide
richer
intelligence
to
enable
a
greater
understanding
of
current
and
future
distribu7on
and
marke7ng
trends.
An
online
survey
will
con7nue
to
be
conducted
to
gather
up
to
the
minute
opinions
and
track
ac7vi7es
of
travel
companies.
The
results
will
produce
invaluable
data
and
allow
a
consistent
and
compara7ve
analysis
of
trends
across
sectors
and
regions.
This
edi7on
was
completed
by
550
different
travel
suppliers
and
intermediaries
varying
in
size
and
sector
across
the
world.
Below
we
can
view
the
number
of
companies
that
responded
from
each
country
involved
in
order
to
help
understand
the
weigh7ng
of
our
results.
It
is
evident
that
some
regions
(such
as
Africa)
are
weaker
in
terms
of
volumes
and
we
want
to
point
out
that
the
findings
for
this
region
par7cularly
should
be
referred
to
as
interes7ng
but
insight
rather
than
a
sound
sta7s7cal
representa7on.
“What
country
are
YOU
based
in?”
United
States 117
United
Kingdom 67
India 59
Australia 33
China 23
Singapore 23
Spain 22
Netherlands 20
Greece 18
France 11
Germany 11
Thailand 11
Italy 9
Brazil 7
Indonesia 7
Russian
Federation 7
Switzerland 7
Ireland
{Republic} 6
Norway 6
Portugal 6
Belgium 5
Japan 5
Malaysia 5
Philippines 5
Argentina 4
Bulgaria 4
Colombia 3
Cyprus 3
Denmark 3
Malta 3
New
Zealand 3
Turkey 3
Afghanistan 2
Austria 2
Bangladesh 2
Canada 2
Chile 2
Lithuania 2
Mauritius 2
Nepal 2
Pakistan 2
Sri
Lanka 2
Barbados 1
Costa
Rica 1
Croatia 1
Fiji 1
Finland 1
Hungary 1
Korea
South 1
Mexico 1
Slovenia 1
Sweden 1
Taiwan 1
Tanzania 1
United
Arab
Emirates 1
Uzbekistan 1
0 38 75 113 150
3. The
first
chart
below
explains
the
involvement
of
our
respondents
globally
in
terms
of
geographical
regions.
For
example,
56%
of
companies
involved
in
our
survey
have
offices
in
Western
Europe.
Does
the
company
you
represent
have
offices
in
any
of
the
following
regions
(including
your
own)?
West
Europe 56%
East
Europe 25%
North
America 45%
Latin
America 20%
Australia/New
Zealand 26%
Asia
&
Pacific 43%
Middle
East 21%
Africa 15%
0% 15% 30% 45% 60%
This
second
chart
indicates
the
actual
market
responsibility
of
our
respondents
and
while
we
refer
to
the
specific
loca7on
(country)
in
which
a
respondent
is
permanently
based
(above),
we
are
also
interested
in
the
regions
they
are
responsible
for
targe7ng
on
the
basis
that
this
is
likely
to
influence
their
ac7vi7es
and
perspec7ves.
We
can
see
below
for
example
that
40%
are
targe7ng
Western
European
markets
whereas
56%
have
offices
in
that
region
(above),
but
also
35%
selected
‘global’
which
would
include
all
markets.
Overall,
our
survey
results
present
a
good
representa7on
for
all
regions
throughout
the
world
which
has
allowed
us
to
offer
our
readers
a
very
interes7ng
picture
globally.
Which
regions
/
markets
is
THE
OFFICE
YOU
ARE
REPRESENTING
responsible
for
targeting?
Global 35%
West
Europe 40%
East
Europe 22%
North
America 31%
Latin
America 13%
Asia
/
Pacific 28%
Australia/New
Zealand 16%
Middle
East 14%
Africa 9%
0% 10% 20% 30% 40%
4. Contents
SecOon
1:
Distribu(on
Channels
SecOon
2:
Online
Penetra(on
(for
suppliers)
SecOon
3:
Direct
vs
Indirect
Distribu(on
(for
suppliers)
SecOon
4:
Current
Sen(ment
Towards
the
OTA-‐Supplier
Partnership
SecOon
5:
Sources
of
Online
Traffic
In
Travel
SecOon
6:
Marke(ng
Channels
SecOon
7:
Marke(ng
Budgets
SecOon
8:
Online
Marke(ng
Ac(vi(es
-‐
What’s
Working
SecOon
9:
Social
Media
Par(cipa(on
SecOon
10:
Mobile
SecOon
11:
Next
Quarter
Budgets
SecOon
12:
Biggest
Challenges
SecOon
13:
What
Has
The
Industry
Learnt
Recently?
SecOon
14:
Biggest
Opportuni(es
Iden(fied
SecOon
15:
Next
Big
Thing
in
Travel
Distribu(on
&
Marke(ng
If
you’d
like
to
join
our
research
panel
please
contact
Tim
Gunstone:
Om@eyefortravel.com
6. Distribu.on
Channels
Booking
Channels
Figure
x
analyses
channels
for
bookings
(volumes)
over
the
last
quarter
represen7ng
the
respondents
of
our
supplier
focussed
survey.
72%
have
experienced
an
increase
in
bookings
direct
from
their
websites
with
only
a
small
propor7on
registering
a
decline
(5%).
Bookings
direct
via
voice/call
centre
have
declined
for
20%
of
respondents
and
increased
for
29%.
42%
have
not
experienced
any
change
from
this
channel.
30%
have
experienced
an
increase
in
bookings
via
mobile
device,
52%
have
not
had
bookings
at
all
via
this
channel.
47%
have
had
an
increase
in
bookings
from
3rd
par7es,
31%
from
GDS/agency
and
24%
from
tour
operators.
Figure
1:
Have
your
bookings
(volumes)
generated
via
the
following
channels
increased
or
decreased
over
the
last
3
months
(from
the
previous
quarter)?
Increased About
the
same
volume Decreased No
bookings
via
this
channel
Direct
from
your
website 72% 22% 5% 2%
Direct
via
voice/call
centre 29% 42% 20% 10%
Direct
from
a
mobile
device 30% 16% 2% 52%
Third
party
Internet
channel
(e.g.
OTA) 47% 35% 9% 10%
GDS/agency 31% 36% 19% 15%
Tour
operator 24% 39% 22% 15%
0% 25% 50% 75% 100%
In
the
charts
below
we
have
then
explored
our
data
based
on
the
regions
that
respondents
are
responsible
for
in
order
to
inves7gate
any
interes7ng
trends
geographically.
Direct
distribu7on
from
their
websites
shows
no
major
varia7ons.
The
majority
have
experienced
an
increase
across
all
regions.
Those
represen7ng
La7n
America
register
the
highest
number
of
respondents
with
an
increase
at
79%.
It
clear
that
in
all
markets,
companies
have
either
had
an
increase
in
bookings
direct
from
their
websites
or
the
volumes
have
stayed
the
same.
The
largest
decline
across
all
regions
is
bookings
from
tour
operators.
The
GDS/agency
channel
closely
follows
but
s7ll
around
a
quarter
of
respondents
in
most
regions
have
experienced
an
increase
from
this
channel.
3rd
party
internet
channels
have
been
genera7ng
more
bookings
for
most
regions
as
well.
Most
are
hovering
around
the
50%
mark
except
La7n
America
where
36%
of
respondents
have
seen
an
increase.
Fewer
companies
from
those
represen7ng
Australia/NZ
have
experienced
a
decline
from
these
indirect
channels
in
comparisons
tother
markets.
Those
represen7ng
North
America,
Africa
and
the
Middle
East
seem
to
have
been
having
the
most
ac7vity
in
terms
of
mobile
bookings.
For
North
America
for
example,
37%
of
respondents
have
seen
an
increase
in
bookings
direct
from
a
mobile
device.
North
America
have
also
registered
a
larger
propor7on
with
an
increase
in
bookings
via
voice/call
centre
(31%).
The
biggest
decline
is
from
those
represen7ng
Eastern
Europe
(24%).
7. Booking
Channels
By
Region
Increased About
the
same
volume Decreased No
bookings
via
this
channel
Western
Europe
Direct
from
your
website 71% 22% 7% 1%
Tour
operator
25% 34% 25% 16%
GDS/agency 24% 38% 22% 16%
Third
party
Internet
channel
(e.g.
OTA) 45% 35% 11% 9%
Direct
from
a
mobile
device 27% 16% 2% 55%
Direct
via
voice/call
centre 22% 44% 20% 14%
0% 25% 50% 75% 100%
%
of
respondents
representing
Western
Europe
Eastern
Europe
Direct
from
your
website 0% 72% 20% 8%
Tour
operator
30% 29% 25% 16%
GDS/agency 26% 40% 16% 18%
Third
party
Internet
channel
(e.g.
OTA) 51% 28% 8% 13%
Direct
from
a
mobile
device 29% 20% 1% 50%
Direct
via
voice/call
centre 18% 46% 24% 12%
0% 25% 50% 75% 100%
Eastern
Europe
North
America
Direct
from
your
website 0% 76% 20% 4%
Tour
operator
21% 34% 29% 16%
GDS/agency 22% 38% 21% 18%
Third
party
Internet
channel
(e.g.
OTA) 38% 39% 11% 12%
Direct
from
a
mobile
device 37% 16% 1% 46%
Direct
via
voice/call
centre 31% 44% 14% 11%
0% 25% 50% 75% 100%
North
America
8. Increased About the same volume Decreaed No bookings via this channel
Australia
/
New
Zealand
Direct
from
your
website 0% 78% 22%
Tour
operator
31% 29% 29% 10%
GDS/agency 26% 38% 19% 17%
Third
party
Internet
channel
(e.g.
OTA) 47% 36% 3% 14%
Direct
from
a
mobile
device 29% 16% 2% 53%
Direct
via
voice/call
centre 26% 47% 14% 14%
0% 25% 50% 75% 100%
Australia/NZ
Asia
Pacific
Direct
from
your
website 69% 27% 3%
1%
Tour
operator
32% 38% 21% 9%
GDS/agency 29% 36% 20% 15%
Third
party
Internet
channel
(e.g.
OTA) 49% 34% 11% 5%
Direct
from
a
mobile
device 30% 19% 3% 48%
Direct
via
voice/call
centre 26% 46% 19% 9%
0% 25% 50% 75% 100%
APAC
Africa
Direct
from
your
website 0% 77% 17% 7%
Tour
operator
27% 33% 27% 13%
GDS/agency 17% 50% 23% 10%
Third
party
Internet
channel
(e.g.
OTA) 53% 33% 10% 3%
Direct
from
a
mobile
device 0% 37% 17% 47%
Direct
via
voice/call
centre 20% 57% 17% 7%
0% 25% 50% 75% 100%
Africa
9. La.n
America
Direct
from
your
website 79% 15% 3%3%
Tour
operator
23% 26% 33% 18%
GDS/agency 18% 41% 23% 18%
Third
party
Internet
channel
(e.g.
OTA) 36% 38% 10% 15%
Direct
from
a
mobile
device 0% 28% 18% 54%
Direct
via
voice/call
centre 23% 46% 15% 15%
0% 25% 50% 75% 100%
Latin
America
Middle
East
Direct
from
your
website 70% 22% 6% 2%
Tour
operator
30% 28% 28% 14%
GDS/agency 24% 38% 18% 20%
Third
party
Internet
channel
(e.g.
OTA) 44% 36% 10% 10%
Direct
from
a
mobile
device 34% 14% 4% 48%
Direct
via
voice/call
centre 20% 52% 16% 12%
0% 25% 50% 75% 100%
%
Middle
Esst
Booking
Channels
By
Company
Sector
Considering
movements
in
bookings
channels
based
on
company
sector
we
can
see
that
there
are
again
no
major
trends
in
this
category
between
sectors,
except
that
a
larger
propor7on
of
DMCs/tourism
boards
have
experienced
a
decline
(27%)
in
bookings
direct
from
their
website.
Cruise,
Car
Rental
and
Airline
have
registered
the
largest
propor7ons
with
an
increase
at
75%,
75%
and
73%
respec7vely.
There
are
more
varia7ons
between
sectors
when
looking
at
bookings
via
voice/call
centre.
50%
of
Cruise
have
registered
an
increase
from
this
channel,
but
on
the
other
hand
50%
have
registered
a
decline
so
there
is
certainly
some
movement
in
this
sector
and
varying
trends
between
companies.
It
is
clear
that
although
this
channel
is
declining
for
a
number
of
companies
across
all
sectors,
such
as
21%
of
Hotel
and
Other
Accommoda7on,
and
a
quarter
of
Car
rental
companies,
it
is
s7ll
an
ac7ve
channel
for
bookings.
Bookings
via
mobile
devices
are
not
common
in
any
sector,
apart
from
perhaps
Car
Rental
where
only
13%
of
respondents
have
received
no
bookings
from
mobile
at
all.
Car
Rental
are
evidently
the
most
ac7ve
in
the
mobile
space
at
the
moment
and
a
huge
75%
of
respondents
have
experienced
an
increase
from
this
channel.
Hotel
and
Airline
are
also
faring
well
with
32%
and
35%
respec7vely
registering
an
increase
in
mobile
bookings
which
is
significant.
The
largest
decline
is
in
the
DMC/tourism
board
category.
10. Increased About the same volume Decreased No bookings via this channel
Direct
from
Website
Tour
operator 67% 25% 6% 2%
Other
accommodation 71% 13% 13% 4%
Hotel 74% 22% 2%1%
DMC
/
tourism
board 0% 64% 9% 27%
Cruise 0% 75% 25%
Car
Rental 0% 75% 25%
Airline 0% 73% 19% 8%
0% 25% 50% 75% 100%
%
of
respondents
Direct
via
voice/call
centre
Tour
operator 31% 46% 15% 8%
Other
accommodation 21% 33% 21% 25%
Hotel 32% 41% 21% 5%
DMC
/
tourism
board 9% 55% 18% 18%
Cruise 0% 50% 50%
Car
Rental 0% 13% 63% 25%
Airline 19% 62% 15% 4%
0% 25% 50% 75% 100%
%
of
respondents
Direct
from
mobile
device
Tour
operator 23% 23% 2% 52%
Other
accommodation 17% 17% 4% 62%
Hotel 32% 14% 2% 52%
DMC/tourism
board 9% 18% 18% 55%
Cruise 0% 25% 25% 50%
Car
Rental 0% 75% 13% 13%
Airline 0% 35% 19% 46%
0% 25% 50% 75% 100%
%
of
respondents
11. Increased About the same volume Decreased No bookings via this channel
Third
party
internet
channel
(e.g.
OTA)
Tour
operator 37% 27% 8% 29%
Other
accommodation 50% 17% 13% 21%
Hotel 54% 39% 6% 1%
DMC
/
tourism
board 0% 45% 36% 18%
Cruise 25% 25% 25% 25%
Car
Rental 0% 38% 25% 38%
Airline 58% 27% 12% 4%
0% 25% 50% 75% 100%
%
of
respondents
GDS/Agency
Tour
operator 25% 40% 6% 29%
Other
accommodation 21% 33% 21% 25%
Hotel 34% 35% 24% 7%
DMC
/
tourism
board 45% 27% 18% 9%
Cruise 0% 50% 50%
Car
Rental 13% 50% 25% 13%
Airline 35% 39% 19% 8%
0% 25% 50% 75% 100%
%
of
respondents
Tour
Operator
Other
accommodation 25% 17% 13% 46%
Hotel 19% 42% 32% 6%
DMC/
tourism
board 36% 18% 18% 27%
Cruise 0% 50% 50%
Car
Rental 0% 50% 38% 13%
Airline 35% 42% 12% 12%
0% 25% 50% 75% 100%
%
of
respondents
13. Online
Distribu.on
Propor.ons
for
Suppliers
Over
the
last
quarter
and
across
all
companies
globally,
the
average
propor7on
of
total
booking
volumes
that
travel
suppliers
distributed
via
online
channels
was
41%.
As
expected
the
extent
of
online
distribu7on
varies
amongst
respondents.
While
par7cipants
were
asked
approximate
propor7ons
to
the
nearest
percent,
we
have
grouped
the
propor7ons
into
ranges
to
make
it
easier
to
iden7fy
trends.
With
reference
to
the
chart
below
we
can
see
that
7%
of
respondents
distributed
between
91%
and
100%
via
online
channels
and
9%
in
the
range
of
76%
to
90%.
That
results
in
16%
of
travel
suppliers
distribu7ng
over
¾
of
their
products
via
online
channels
in
the
last
quarter.
19%
of
companies
distributed
between
50%
and
75%
online,
and
21%
between
30%
to
49%
online.
The
largest
group
at
29%
sit
within
11%
to
29%
range.
It
is
revealed
that
14%
rely
heavily
on
offline
channels
with
less
than
10%
of
their
product
volume
sold
online,
but
we
can
see
clearly
in
the
graph
that
a
large
propor7on
have
now
shihed
over
50%
of
their
product
distribu7on
online.
Approximately
what
proporOon
(%)
of
your
total
bookings
(volume)
were
distributed
via
online
channels
over
the
last
3
months?
14% 7%
9% 91%
-‐
100%
76%
-‐
90%
50%
-‐
75%
30%
-‐
49%
29%
19% 11%
-‐
29%
Less
then
10%
21%
Looking
further
into
the
data
we
have
considered
the
varia7ons
based
on
some
of
the
top
travel
markets
looking
at
Europe
specifically
against
some
other
key
global
markets.
The
top
travel
markets
refer
to
the
specific
country
in
which
the
respondent
is
based.
The
top
band
(91%
to
100%)
is
most
dominant
amongst
UK
respondents.
A
significant
21%
fall
within
this
range.
Germany
(17%),
China
(7%),
Spain
(6%)
and
the
US
(2%)
have
also
indicated
high
dominance
of
online
channels
for
their
businesses.
On
the
other
end
of
the
scale,
China
indicates
the
dominance
of
offline
channels
with
40%
distribu7ng
less
than
10%
of
their
product
volume
online.
35%
of
Australian
respondents
and
27%
of
Indian
respondents
also
fall
within
this
range.
The
UK
illustrates
a
rela7vely
even
spread
of
online
distribu7on
propor7ons
but
edging
on
the
higher
bands
of
over
50%.
Spain
is
not
too
dissimilar
to
the
UK
but
with
a
larger
group
within
the
30%
to
49%
range.
Germany
and
France
are
dominated
by
companies
in
the
11%
to
29%
range,
Germany
also
includes
17%
at
the
top
end
of
the
scale,
but
neither
are
represen7ng
companies
with
very
low
online
distribu7on
levels.
Italy
very
evenly
falls
within
the
middle
ranges
but
with
a
compara7vely
high
propor7on
amongst
the
76%
to
90%.
100% 6% 6% 7%
2%
6%
21% 17% 9% 18%
13% 25% 13%
33%
91% - 100% 28%
75% 11% 19% 24%
76% - 90% 33% 29%
50% - 75% 25%
40%
24%
30% - 49%
50% 31%
33% 100% 31%
11% - 29% 33% 18%
Less then 10% 18%
25% 50% 50% 20%
25% 40%
18% 33% 35%
27%
13%
8% 6%
0% 0%
0% 0%
0% 0%
0% 0% 0% 0%
0% 0%
UK
n
y
ce
ly
es
a
a
il
lia
an
az
di
in
ai
Ita
at
an
ra
Sp
In
Ch
Br
rm
St
st
Fr
Au
d
Ge
ite
Un
14. Whilst
it
is
important
to
consider
the
loca7on
where
the
company
is
based,
more
importantly
it
is
relevant
to
consider
where
the
majority
of
their
customers
come
from
as
it
is
the
level
of
online
penetra7on
in
their
source
markets
and
specific
characteris7cs
that
may
have
a
real
influence
on
the
results.
It
must
however
be
realised
that
the
results
will
be
somewhat
skewed
as
this
is
not
data
in
rela7on
to
that
specific
market
only,
but
indica7ve.
For
example,
those
who
are
distribu7ng
predominantly
to
Africa
are
selling
between
11%
and
29%
via
online
channels.
Of
those
distribu7ng
predominantly
to
the
Middle
East,
21%
sell
90%
via
offline
channels.
Propor.on
Distributed
Online
Based
On
Where
Majority
Of
Customer
Come
From
100%
8% 2% 4% 2% 4% 100% 9% 3%
10%
9% 11% 9% 12% 10% 91%
-‐
100%
14% 18% 7%
28% 76%
-‐
90%
75% 14% 7%
21%
27% 13%
28%
23% 26% 29% 50%
-‐
75%
50% 42% 46% 38% 30%
-‐
49%
26%
30% 29% 29% 11%
-‐
29%
25% Less
then
10%
21% 21%
14% 15% 15% 14%
12%
0%
0% 0%
0% 0%
e
e
c
ica
ica
ca
d
st
i
op
op
an
cif
Ea
ri
er
er
Af
al
ur
ur
Pa
e
m
m
Ze
dl
t
E
E
/
A
A
st
id
ew
ia
es
rth
tin
Ea
M
As
W
/N
La
No
lia
ra
st
Au
15. SecOon
3:
Direct
vs
Indirect
Distribu.on
(for
suppliers)
16. Direct
vs.
Indirect
Distribu.on
(Suppliers)
Travel
suppliers
distribu7ng
their
product
online
either
sell
via
direct
channels
or
via
an
intermediary
(indirect).
In
this
survey
of
all
suppliers
combined
globally
the
average
propor7on
of
direct
distribu7on
is
49%.
The
chart
below
indicates
the
varia7on
in
online
distribu7on
pamerns
amongst
respondents
for
example
14%
of
respondents
are
distribu7ng
less
than
10%
of
their
online
sales
through
direct
channels,
which
means
90%
is
sold
via
an
intermediary.
26%
of
all
respondents
are
distribu7ng
over
¾
of
their
online
sales
direct.
When
asked
what
their
ideal
propor7on
of
direct
sales
would
be,
this
averaged
at
62%
Propor.on
of
respondents
in
the
direct
distribu.on
propor.on
categories
30%
% of repondents
23% 24%
20% 19%
15% 17%
14%
8%
7%
0%
%
%
%
0%
%
%
29
49
90
10
75
10
-‐
-‐
-‐
-‐
en
-‐
%
%
%
%
%
11
30
76
th
50
91
ss
Le
Propor.on
of
respondents
in
the
indirect
distribu.on
propor.on
categories
Whilst
the
figures
below
should
match
neatly
with
the
figures
above
there
may
be
some
discrepancy
here
as
it
was
led
up
to
the
respondents
to
be
as
accurate
as
possible.
What
we
can
deduce
from
the
data
is
that
travel
suppliers
are
not
en7rely
reliant
on
online
intermediaries
for
their
sales
whilst
they
are
clearly
playing
a
significant
role
for
the
suppliers.
%
of
respondents
30%
26%
23%
23%
20%
15% 17%
8% 10%
3%
0%
%
%
%
0%
0%
%
29
49
90
75
10
1
-‐
-‐
-‐
-‐
en
-‐
%
%
%
%
%
11
30
76
th
50
91
ss
Le
17. Aetudes
Towards
Direct
vs.
Indirect
Distribu.on
The
barometer
is
looking
to
understand
the
sen7ment
of
the
travel
industry
during
the
last
quarter.
It
looks
to
have
been
a
generally
posi7ve
quarter
for
online
sales
with
28%
feeling
that
their
direct
online
sales
were
bemer
than
they
expected
and
26%
for
indirect
sales.
Both
direct
and
indirect
sales
were
as
expected
for
the
majority
of
respondents,
44%
and
47%
respec7vely.
9%
of
respondents
were
extremely
posi7ve
sta7ng
that
their
direct
sales
were
much
bemer
than
expected
and
8%
for
indirect
sales.
Those
on
the
nega7ve
end
of
the
scale
amounted
to
18%
in
rela7on
to
direct
and
17%
for
indirect
sales.
Only
a
small
propor7on
stated
either
online
channel
was
much
worse
than
expected.
How
do
you
feel
about
the
results
of
your
direct
and
indirect
sales
over
the
last
quarter
Direct Indirect
9%
Much
better
than
I
expected
8%
28%
Better
than
expected
26%
44%
As
expected
47%
15%
Worse
than
expected
15%
3%
Much
worse
than
expected
2%
1%
None
distributed
via
this
channel
2%
0% 13% 25% 38% 50%
The
role
of
online
intermediaries
in
the
distribu7on
of
travel
supplier
products
is
clearly
significant.
Over
half
of
all
respondents
state
that
indirect
online
channels
have
been
extremely
or
very
important
to
their
company
in
the
last
3
months.
Also
adding
those
respondents
that
consider
indirect
channels
‘important’
it
results
in
85%
of
respondents.
Whilst
suppliers
are
aiming
to
distribute
a
higher
propor7on
of
online
sales
via
direct
channels,
it
is
clear
that
intermediaries
are
rates
as
a
channel
by
most.
47%
have
increased
the
number
of
online
third
party
distribu7on
channels
that
they
have
worked
with
over
the
last
quarter
and
44%
are
maintaining
the
same
number.
Just
6%
have
reduced
the
number
of
partners
and
4%
did
not
work
with
any
at
all.
Please
rate
below
how
important
INDIRECT
online
channels
have
been
to
your
company
in
the
last
3
months
Extremely
important 19%
Very
important 34%
Important 32%
Neither
important
nor
unimportant 11%
% of respondents
Not
important 4%
0% 10% 20% 30% 40%
18. Has
the
number
of
online
3rd
party
distribu.on
channels
you’ve
worked
with
increased
or
declined
in
the
last
3
months
compared
to
the
previous
quarter?
Increased 47%
About
the
same
volume 44%
Suppliers
Declined 6%
We
did
not
work
with
any 4%
0% 13% 25% 38% 50%
%
of
respondents
Considering
the
different
travel
sectors,
Cruise
are
the
most
reliant
upon
indirect
channels
for
online
distribu7on
with
50%
ra7ng
them
extremely
important.
In
comparison
only
8%
of
airlines
stated
them
extremely
important
but
a
further
38%
rate
them
very
important.
The
accommoda7on
sector
rate
them
highly
with
Hotel
resul7ng
in
61%
of
respondents
ra7ng
indirect
channels
either
extremely
or
very
important.
13%
of
the
Other
Accommoda7on
sector
rate
indirect
channels
as
‘not
important’
which
could
perhaps
be
in
rela7on
to
the
type
or
size
of
inventory.
Indirect
channels
are
less
relevant
for
DMCs/tourism
boards
which
is
understandable
based
on
the
nature
of
their
product.
Please
rate
below
how
important
INDIRECT
online
channels
have
been
to
your
company
in
the
last
3
months
Extremely important Very important Important Neither important nor unimportant Not important
Tour
operator 17% 19% 37% 17% 10%
Other
accommodation 21% 25% 21% 21% 13%
Hotel 0% 22% 39% 32% 7%
DMC
/
tourism
board 0% 9% 36% 36% 18%
Cruise 0%
0% 50% 25% 25%
Car
Rental 0% 25% 38% 13% 25%
Airline 8% 39% 42% 8% 4%
0% 25% 50% 75% 100%
%
of
respondents
19. Has
the
number
of
online
3rd
party
distribu.on
channels
you’ve
worked
with
increased
or
declined
in
the
last
3
months
compared
to
the
previous
quarter?
Echoing
the
results
above,
Cruise
have
been
increasing
the
number
of
3rd
party
distribu7on
channels
they
are
working
with
in
the
last
quarter.
Tour
Operator,
Other
Accommoda7on,
Hotel,
DMC/tourism
board
and
Airline
have
reduced
the
number,
10%,
8%,
4%,
9%
and
12%
respec7vely.
The
tour
operators,
which
can
blur
over
the
borders
of
supplier
and
intermediary,
Other
Accommoda7on
and
the
DMC/tourism
board
sectors
have
propor7ons
that
do
not
work
with
3rd
party
partners
at
all.
Cruise
and
Car
Rental
have
both
either
increased
or
remained
consistent
with
the
number
of
indirect
channels.
Increased About the same volume Declined We did not work with any
Tour
operator 39% 40% 10% 12%
Other
accommodation 58% 25% 8% 8%
Hotel 49% 46% 4% 1%
DMC
/
tourism
board 45% 36% 9% 9%
Cruise 0% 75% 25%
Car
Rental 0% 50% 50%
Airline 0% 46% 42% 12%
0% 25% 50% 75% 100%
%
of
responents
Do
you
mind
what
the
ra.o
of
direct
vs.
Indirect
distribu.on
is?
It
has
been
established
that
indirect
distribu7on
channels
are
playing
an
important
role
for
online
distribu7on.
When
asked
if
they
mind
what
the
ra7o
of
direct
vs
indirect
distribu7on
is
84%
stated
yes.
Due
to
cost
of
sale
and
other
such
reasons
suppliers
are
unexpectedly
preferable
towards
direct
distribu7on.
The
chart
below
indicates
the
ideal
propor7on
of
direct
sales
as
a
total
of
online
sales.
12%
are
aiming
for
100%
direct
distribu7on
whereas
the
average
for
all
respondents
combined
as
men7oned
earlier
is
62%.
Yes
No
16%
84%
20. Ideal
propor.on
of
direct
sales
15%
12% 12%
%
of
respondents
11%
11% 10%
9%
7%
8%
5% 5%
4%
4%
4% 2% 2% 3%
2% 2%
1% 1% 2% 2%
1% 1% 1% 1% 0%
0% 0% 0% 0% 0% 0% 0% 0%
0%
1 5 8 10 11 12 14 15 17 20 25 28 30 33 35 40 45 50 55 60 65 70 75 76 80 85 90 92 95 98 99 100
Ideal
%
on
online
distribution
via
direct
channels
How
fair
suppliers
feel
the
partnership
with
OTAs
are
There
is
currently
some
debate
amongst
the
travel
industry
as
to
the
value
of
the
partnerships
between
suppliers
and
OTAs.
We
ques7onned
the
fairness
of
the
current
partnership
with
both
suppliers
and
OTAs.
The
chart
below
illustrates
that
most
suppliers
are
siong
on
the
fence
but
it’s
weighed
towards
being
more
unfair.
33%
feel
that
it
is
neither
fair
nor
unfair.,
and
23%
‘quite
unfair’.
Results
from
the
more
open
ques7ons
reveal
that
while
elements
of
the
partnership
are
not
enormously
praised
they
are
channel
of
distribu7on
that
are
valued
in
some
respects.
Only
3%
state
it
is
extremely
unfair.
How
fair
intermediaries
feel
the
partnership
with
suppliers
is
Extremely
FAIR 1%
Very
fair 5%
Quite
fair 29%
Neither
fair
nor
unfair 33%
Quite
unfair 23%
Very
unfair 7%
Extremely
UNFAIR 3%
0% 10.0% 20.0% 30.0% 40.0%
%
of
respondents
The
intermediary
perspec7ve
is
not
too
dissimilar
but
weighted
more
to
being
fair.
35%
state
neither
fair
not
unfair
and
32%
state
it’s
quite
fair.
Extremely
FAIR 2%
Very
fair 11%
Quite
fair 32%
Neither
fair
nor
unfair 35%
Quite
unfair 16%
Very
unfair 2%
Extremely
UNFAIR 3%
0% 10.0% 20.0% 30.0% 40.0%
21. SecOon
4:
Current
Sen.ment
Towards
the
OTA-‐Supplier
Partnership
22. Sen.ment
towards
the
OTA-‐Supplier
Partnership
Below
we
highlight
some
of
the
key
themes
emerging
in
this
edi7on
surrounding
the
partnership
between
the
Online
Travel
Agents
(OTAs)
and
suppliers.
In
the
first
image
we
can
iden7fy
that
the
key
concern
is
that
commission
rates
are
too
high
and
margins
are
being
squeezed.
Rate
parity
is
another
major
concern
in
the
current
situa7on.
What
suppliers
dislike
about
the
partnership
with
OTAs
From
the
OTA
perspec7ve,
the
image
below
illustrates
their
concerns.
The
main
theme
is
around
availability,
or
lack
of,
and
the
growth
in
direct
bookings
of
course.
Their
are
concerns
around
the
level
of
technology
that
suppliers
invest
in
to
maximise
the
partnership
and
are
looking
for
developments
in
this
area.
Readers
can
study
the
image
to
pick
up
some
of
them
other
issues.
The
larger
the
word
the
more
common
it
was
in
the
responses.
What
OTAs
dislike
about
the
current
partnership
with
suppliers
23. Looking
at
more
posi7ve
sen7ment,
the
OTAs
feel
that
suppliers
are
really
good
at
being
flexible
and
value
this
characteris7c
in
a
partner
that
is
having
to
operate
in
such
a
dynamic
industry.
They
feel
the
range
of
products
on
offer
are
great
and
they’ve
really
improved
in
their
online
presence
to
help
the
partnership
reach
new
levels.
Suppliers
that
are
efficient
and
willing
to
work
with
the
OTAs
are
rated.
What
do
the
OTAs
like
about
the
partnership
with
suppliers?
While
suppliers
have
iden7fied
(as
we
show
above)
their
concerns
over
the
commission
rates,
the
OTAs
are
s7ll
hugely
valued
as
a
distribu7on
and
marke7ng
channel
in
today’s
market.
The
level
of
reach
that
they
have
the
ability
to
drive
for
distribu7on
and
overall
marke7ng
purposes
is
the
most
common
theme.
It
is
also
noted
that
the
strength
of
their
brands
in
some
of
the
more
marginal
markets
makes
the
partnership
a
very
valuable
one.
For
many
travel
companies
the
OTAs
are
brining
them
in
incremental
business
and
any
sale
is
considered
good.
What
suppliers
like
about
the
partnership
with
intermediaries…