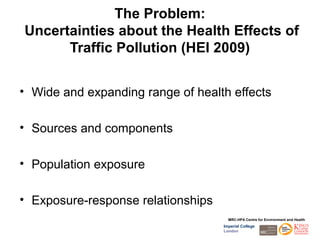
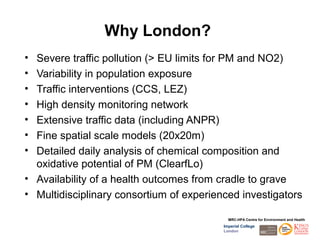
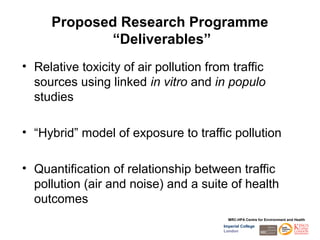
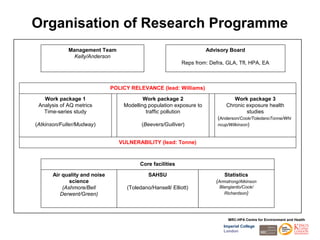
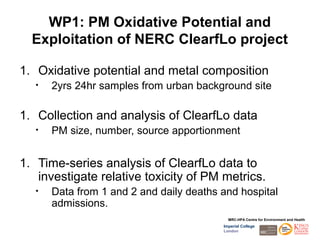
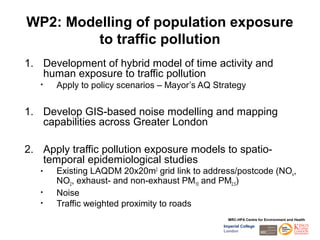
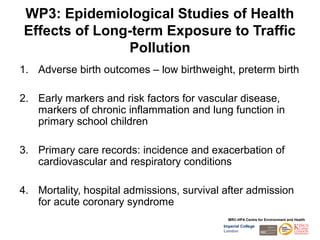
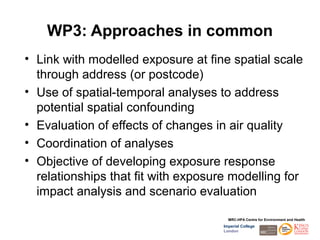
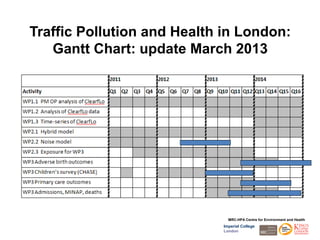
Traffic Pollution and Health in London

          EEHI-ESEI Meeting
           12th March 2013


       Ross Anderson, KCL and SGUL
       Sean Beevers, KCL


                                MRC-HPA Centre for Environment and Health
                              Imperial College
                              London
Traffic Pollution and Health in London:
                       NERC/MRC 2011-2014

          PI: Frank Kelly, King’s College London

King’s College – Ross Anderson, Sean Beevers, Gary Fuller, Martin
Williams

Imperial College – Mireille Toledano, Marta Blangiardo, John Gulliver,
Sylvia Richardson

St George’s UOL – Richard Atkinson, Derek Cook, Peter Whincup

LSH&TM – Paul Wilkinson, Cathryn Tonne

Other collaborators:

Dick Derwent, Margaret Bell, Ben Armstrong, Mike Ashmore, David Green,
                       Anna Hansell, Paul Elliott    MRC-HPA Centre for Environment and Health
                                                                  Imperial College
                                                                  London
The Problem:
Uncertainties about the Health Effects of
      Traffic Pollution (HEI 2009)


• Wide and expanding range of health effects

• Sources and components

• Population exposure

• Exposure-response relationships
                                      MRC-HPA Centre for Environment and Health
                                    Imperial College
                                    London
Why London?
• Severe traffic pollution (> EU limits for PM and NO2)
• Variability in population exposure
• Traffic interventions (CCS, LEZ)
• High density monitoring network
• Extensive traffic data (including ANPR)
• Fine spatial scale models (20x20m)
• Detailed daily analysis of chemical composition and
  oxidative potential of PM (ClearfLo)
• Availability of a health outcomes from cradle to grave
• Multidisciplinary consortium of experienced investigators

                                            MRC-HPA Centre for Environment and Health
                                          Imperial College
                                          London
NOx, Borough of Lambeth 2005                                                                                       London annual mean NOx (20x20m) 2004


                                                                                                                                   Histogram of NOx values in 158,493 London postcodes
                                                                                                            30%


                                                                                                                                                                                   NO x D e c ile s we r e de f ine d a s
                                                                                                            25%                                                                    1 = 2 1. 7 t o 3 7 . 7
                                   160                                                                                                                                             2 = 37.8 to 42.4
                                                                                                                                                                                   3 = 42.4 to 46.1
                                                                                                            20%                                                                    4 = 46.2 to 49.9
-3


                                                                                               Percentage


                                   140
NO X concentration in 2005 µ g m


                                                                                                                                                                                   5 = 49.9 to 54.2
                                                                                                                                                                                   6 = 54.2 to 58.8

                                                                                                            15%                                                                    7 = 58.8 to 63.7
                                   120
                                                                                                                                                                                   8 = 63.7 to 69.9
                                                                                                                                                                                   9 = 69.9 to 82.1

                                   100                                                                      10%


                                    80
                                                                                                            5%


                                    60
                                                                                                            0%

                                         528000   529000   530000   531000   532000   533000
                                                                                                                  0    10    20   30   40   50   60    70   80   90   100   110   120     130       140     150    160      170   180   190   200+

                                                             Easting (m)                                                                              Modelled NOx value for postcode


                                   Transect. NOx 2005                                                                 % distribution of NOx for population of London
Proposed Research Programme
             “Deliverables”
• Relative toxicity of air pollution from traffic
  sources using linked in vitro and in populo
  studies

• “Hybrid” model of exposure to traffic pollution

• Quantification of relationship between traffic
  pollution (air and noise) and a suite of health
  outcomes
                                          MRC-HPA Centre for Environment and Health
                                        Imperial College
                                        London
Organisation of Research Programme
             Management Team                                         Advisory Board
               Kelly/Anderson
                                                           Reps from: Defra, GLA, Tfl, HPA, EA


                              POLICY RELEVANCE (lead: Williams)

   Work package 1                         Work package 2                        Work package 3
 Analysis of AQ metrics           Modelling population exposure to           Chronic exposure health
   Time-series study                       traffic pollution                         studies
                                                                         (Anderson/Cook/ToledanoTonne/Whi
(Atkinson/Fuller/Mudway)                 (Beevers/Gulliver)              ncup/Wilkinson)


                                 VULNERABILITY (lead: Tonne)


                                        Core facilities

      Air quality and noise                 SAHSU                           Statistics
             science                                                    (Armstrong/Atkinson
          (Ashmore/Bell            (Toledano/Hansell/ Elliott)            Blangiardo/Cook/
         Derwent/Green)                                                     Richardson)


                                                                              MRC-HPA Centre for Environment and Health
                                                                            Imperial College
                                                                            London
WP1: PM Oxidative Potential and
  Exploitation of NERC ClearfLo project

1. Oxidative potential and metal composition
   •   2yrs 24hr samples from urban background site

1. Collection and analysis of ClearfLo data
   •   PM size, number, source apportionment


1. Time-series analysis of ClearfLo data to
   investigate relative toxicity of PM metrics.
   •   Data from 1 and 2 and daily deaths and hospital
       admissions.
                                            MRC-HPA Centre for Environment and Health
                                          Imperial College
                                          London
WP2: Modelling of population exposure
         to traffic pollution
1. Development of hybrid model of time activity and
   human exposure to traffic pollution
   •   Apply to policy scenarios – Mayor’s AQ Strategy


1. Develop GIS-based noise modelling and mapping
   capabilities across Greater London

2. Apply traffic pollution exposure models to spatio-
   temporal epidemiological studies
   •   Existing LAQDM 20x20m2 grid link to address/postcode (NOx,
       NO2, exhaust- and non-exhaust PM10 and PM2.5)
   •   Noise
   •   Traffic weighted proximity to roads
                                                  MRC-HPA Centre for Environment and Health
                                                Imperial College
                                                London
WP3: Epidemiological Studies of Health
Effects of Long-term Exposure to Traffic
               Pollution
1. Adverse birth outcomes – low birthweight, preterm birth

2. Early markers and risk factors for vascular disease,
   markers of chronic inflammation and lung function in
   primary school children

3. Primary care records: incidence and exacerbation of
   cardiovascular and respiratory conditions

4. Mortality, hospital admissions, survival after admission
   for acute coronary syndrome
                                             MRC-HPA Centre for Environment and Health
                                           Imperial College
                                           London
WP3: Approaches in common
• Link with modelled exposure at fine spatial scale
  through address (or postcode)
• Use of spatial-temporal analyses to address
  potential spatial confounding
• Evaluation of effects of changes in air quality
• Coordination of analyses
• Objective of developing exposure response
  relationships that fit with exposure modelling for
  impact analysis and scenario evaluation

                                       MRC-HPA Centre for Environment and Health
                                     Imperial College
                                     London
Traffic Pollution and Health in London:
   Gantt Chart: update March 2013


                              MRC-HPA Centre for Environment and Health
                            Imperial College
                            London
THANK YOU


              MRC-HPA Centre for Environment and Health
            Imperial College
            London

TRAFFIC

  • 1.
    Traffic Pollution andHealth in London EEHI-ESEI Meeting 12th March 2013 Ross Anderson, KCL and SGUL Sean Beevers, KCL MRC-HPA Centre for Environment and Health Imperial College London
  • 2.
    Traffic Pollution andHealth in London: NERC/MRC 2011-2014 PI: Frank Kelly, King’s College London King’s College – Ross Anderson, Sean Beevers, Gary Fuller, Martin Williams Imperial College – Mireille Toledano, Marta Blangiardo, John Gulliver, Sylvia Richardson St George’s UOL – Richard Atkinson, Derek Cook, Peter Whincup LSH&TM – Paul Wilkinson, Cathryn Tonne Other collaborators: Dick Derwent, Margaret Bell, Ben Armstrong, Mike Ashmore, David Green, Anna Hansell, Paul Elliott MRC-HPA Centre for Environment and Health Imperial College London
  • 3.
    The Problem: Uncertainties aboutthe Health Effects of Traffic Pollution (HEI 2009) • Wide and expanding range of health effects • Sources and components • Population exposure • Exposure-response relationships MRC-HPA Centre for Environment and Health Imperial College London
  • 4.
    Why London? • Severetraffic pollution (> EU limits for PM and NO2) • Variability in population exposure • Traffic interventions (CCS, LEZ) • High density monitoring network • Extensive traffic data (including ANPR) • Fine spatial scale models (20x20m) • Detailed daily analysis of chemical composition and oxidative potential of PM (ClearfLo) • Availability of a health outcomes from cradle to grave • Multidisciplinary consortium of experienced investigators MRC-HPA Centre for Environment and Health Imperial College London
  • 5.
    NOx, Borough ofLambeth 2005 London annual mean NOx (20x20m) 2004 Histogram of NOx values in 158,493 London postcodes 30% NO x D e c ile s we r e de f ine d a s 25% 1 = 2 1. 7 t o 3 7 . 7 160 2 = 37.8 to 42.4 3 = 42.4 to 46.1 20% 4 = 46.2 to 49.9 -3 Percentage 140 NO X concentration in 2005 µ g m 5 = 49.9 to 54.2 6 = 54.2 to 58.8 15% 7 = 58.8 to 63.7 120 8 = 63.7 to 69.9 9 = 69.9 to 82.1 100 10% 80 5% 60 0% 528000 529000 530000 531000 532000 533000 0 10 20 30 40 50 60 70 80 90 100 110 120 130 140 150 160 170 180 190 200+ Easting (m) Modelled NOx value for postcode Transect. NOx 2005 % distribution of NOx for population of London
  • 6.
    Proposed Research Programme “Deliverables” • Relative toxicity of air pollution from traffic sources using linked in vitro and in populo studies • “Hybrid” model of exposure to traffic pollution • Quantification of relationship between traffic pollution (air and noise) and a suite of health outcomes MRC-HPA Centre for Environment and Health Imperial College London
  • 7.
    Organisation of ResearchProgramme Management Team Advisory Board Kelly/Anderson Reps from: Defra, GLA, Tfl, HPA, EA POLICY RELEVANCE (lead: Williams) Work package 1 Work package 2 Work package 3 Analysis of AQ metrics Modelling population exposure to Chronic exposure health Time-series study traffic pollution studies (Anderson/Cook/ToledanoTonne/Whi (Atkinson/Fuller/Mudway) (Beevers/Gulliver) ncup/Wilkinson) VULNERABILITY (lead: Tonne) Core facilities Air quality and noise SAHSU Statistics science (Armstrong/Atkinson (Ashmore/Bell (Toledano/Hansell/ Elliott) Blangiardo/Cook/ Derwent/Green) Richardson) MRC-HPA Centre for Environment and Health Imperial College London
  • 8.
    WP1: PM OxidativePotential and Exploitation of NERC ClearfLo project 1. Oxidative potential and metal composition • 2yrs 24hr samples from urban background site 1. Collection and analysis of ClearfLo data • PM size, number, source apportionment 1. Time-series analysis of ClearfLo data to investigate relative toxicity of PM metrics. • Data from 1 and 2 and daily deaths and hospital admissions. MRC-HPA Centre for Environment and Health Imperial College London
  • 9.
    WP2: Modelling ofpopulation exposure to traffic pollution 1. Development of hybrid model of time activity and human exposure to traffic pollution • Apply to policy scenarios – Mayor’s AQ Strategy 1. Develop GIS-based noise modelling and mapping capabilities across Greater London 2. Apply traffic pollution exposure models to spatio- temporal epidemiological studies • Existing LAQDM 20x20m2 grid link to address/postcode (NOx, NO2, exhaust- and non-exhaust PM10 and PM2.5) • Noise • Traffic weighted proximity to roads MRC-HPA Centre for Environment and Health Imperial College London
  • 10.
    WP3: Epidemiological Studiesof Health Effects of Long-term Exposure to Traffic Pollution 1. Adverse birth outcomes – low birthweight, preterm birth 2. Early markers and risk factors for vascular disease, markers of chronic inflammation and lung function in primary school children 3. Primary care records: incidence and exacerbation of cardiovascular and respiratory conditions 4. Mortality, hospital admissions, survival after admission for acute coronary syndrome MRC-HPA Centre for Environment and Health Imperial College London
  • 11.
    WP3: Approaches incommon • Link with modelled exposure at fine spatial scale through address (or postcode) • Use of spatial-temporal analyses to address potential spatial confounding • Evaluation of effects of changes in air quality • Coordination of analyses • Objective of developing exposure response relationships that fit with exposure modelling for impact analysis and scenario evaluation MRC-HPA Centre for Environment and Health Imperial College London
  • 12.
    Traffic Pollution andHealth in London: Gantt Chart: update March 2013 MRC-HPA Centre for Environment and Health Imperial College London
  • 13.
    THANK YOU MRC-HPA Centre for Environment and Health Imperial College London

Editor's Notes

  • #2 Routine sources of health data are attractive for air pollution studies for various reasons: large scale, relatively cheap. Most common source is mortality data Less common are hospital utilization data Less common still are primary care data Fortunate in UK to have the potential to use all three. Primary care data from primary care research databases have been used by us in the past for daily time-series and episode studies in London. (can provide one or two slides if needed). More recently we have become interested in using primary care data for investigating the health effects of exposure to traffic and the possible health benefits of interventions, in particular the LEZ for London. This talk is in three parts: Describe the nature of these databases Describe experience with a pilot study using DIN Outline plans for future work
  • #3 Routine sources of health data are attractive for air pollution studies for various reasons: large scale, relatively cheap. Most common source is mortality data Less common are hospital utilization data Less common still are primary care data Fortunate in UK to have the potential to use all three. Primary care data from primary care research databases have been used by us in the past for daily time-series and episode studies in London. (can provide one or two slides if needed). More recently we have become interested in using primary care data for investigating the health effects of exposure to traffic and the possible health benefits of interventions, in particular the LEZ for London. This talk is in three parts: Describe the nature of these databases Describe experience with a pilot study using DIN Outline plans for future work
  • #6 Transect of Lambeth to show relationship to traffic sources Distribution of annual average NOx at postcode level. Modelled NOx at 20X20m spatial resolution. Obtained by mapping centroids to postcode using a digitized postcode file. Shows considerable heterogeneity. Pilot study using DIN Linkage with estimates for chronic exposure to traffic pollutants using the postcode Derivation of relevant outcome variables Investigation of confounding by smoking and SES Cross-sectional analysis Estimation of power for evaluation of the LEZ