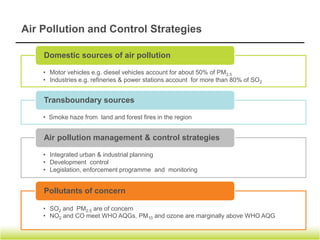
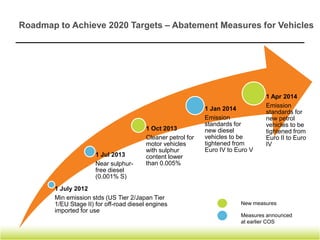
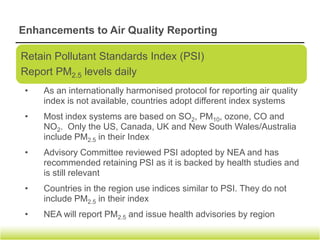
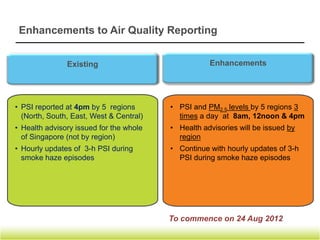
The document discusses trends in Singapore's air quality from 1993 to 2011, noting that air quality has improved significantly over that period. It also compares Singapore's air quality to other Asian and European/US cities. Additionally, it outlines Singapore's targets for reducing various air pollutants by 2020 and long term, and provides roadmaps for achieving the targets through measures related to vehicles and industries. Finally, it mentions enhancements to air quality reporting such as continuing to report the Pollutant Standards Index while also reporting daily PM2.5 levels.
The efect of diesel Sulfur content on PM2.5 aburra valley colombiaEnrique Posada
This paper was presented at the Air Pollution conference in Athens in 2012. Describes research done at the Aburra Valley during the change in sulfur content of the diesel fuel
The efect of diesel Sulfur content on PM2.5 aburra valley colombiaEnrique Posada
This paper was presented at the Air Pollution conference in Athens in 2012. Describes research done at the Aburra Valley during the change in sulfur content of the diesel fuel
A presentation about how the Covenant of Mayors is implemented in Sweden. Some exemples are given from the sustainable energy action plans, and especially Växjö the first Swedidh SEAP approved by Covenant of Mayors office.
Presentació de Xavier Querol (Institut de Diagnosi Ambiental del CSIC) en en el marc de la jornada "30 anys vigilant i millorant la qualitat de l'aire a Catalunya" sobre els nivells de contaminants atmosfèrics corresponent a l'any 2013 i sobre les novetats de qualitat de l'aire, organitzada per la Direcció General de Qualitat Ambiental i la Diputació de Barcelona.
Time and climate change - London Climate Forum 2012Clive Bates
Presentation by Clive Bates 15:00 Saturday 24 November 2012. The presentation focuses on six 'time traps' - reasons why time complicates climate change, and suggests ten overall approaches to address the challenges.
Armonización de políticas para vehículos ligeros nuevos en América del Norte: Estándares de eficiencia energética, gases de efecto invernadero y contaminantes criterio
7/9/2014-7/10/2014
Mexico City
Effect of Waste Foundry Sand on Durability Properties of ConcreteIEI GSC
Presentation on Effect of Waste Foundry Sand on Durability Properties of Concrete by Tirth Doshi guided by Dr Urmil Dave & Prof Tejas Joshi at #33NCCE 33rd National Convention of Civil Engineers at #IEIGSC
UiPath Test Automation using UiPath Test Suite series, part 3DianaGray10
Welcome to UiPath Test Automation using UiPath Test Suite series part 3. In this session, we will cover desktop automation along with UI automation.
Topics covered:
UI automation Introduction,
UI automation Sample
Desktop automation flow
Pradeep Chinnala, Senior Consultant Automation Developer @WonderBotz and UiPath MVP
Deepak Rai, Automation Practice Lead, Boundaryless Group and UiPath MVP
Neuro-symbolic is not enough, we need neuro-*semantic*Frank van Harmelen
Neuro-symbolic (NeSy) AI is on the rise. However, simply machine learning on just any symbolic structure is not sufficient to really harvest the gains of NeSy. These will only be gained when the symbolic structures have an actual semantics. I give an operational definition of semantics as “predictable inference”.
All of this illustrated with link prediction over knowledge graphs, but the argument is general.
Kubernetes & AI - Beauty and the Beast !?! @KCD Istanbul 2024Tobias Schneck
As AI technology is pushing into IT I was wondering myself, as an “infrastructure container kubernetes guy”, how get this fancy AI technology get managed from an infrastructure operational view? Is it possible to apply our lovely cloud native principals as well? What benefit’s both technologies could bring to each other?
Let me take this questions and provide you a short journey through existing deployment models and use cases for AI software. On practical examples, we discuss what cloud/on-premise strategy we may need for applying it to our own infrastructure to get it to work from an enterprise perspective. I want to give an overview about infrastructure requirements and technologies, what could be beneficial or limiting your AI use cases in an enterprise environment. An interactive Demo will give you some insides, what approaches I got already working for real.
Encryption in Microsoft 365 - ExpertsLive Netherlands 2024Albert Hoitingh
In this session I delve into the encryption technology used in Microsoft 365 and Microsoft Purview. Including the concepts of Customer Key and Double Key Encryption.
DevOps and Testing slides at DASA ConnectKari Kakkonen
My and Rik Marselis slides at 30.5.2024 DASA Connect conference. We discuss about what is testing, then what is agile testing and finally what is Testing in DevOps. Finally we had lovely workshop with the participants trying to find out different ways to think about quality and testing in different parts of the DevOps infinity loop.
Smart TV Buyer Insights Survey 2024 by 91mobiles.pdf91mobiles
91mobiles recently conducted a Smart TV Buyer Insights Survey in which we asked over 3,000 respondents about the TV they own, aspects they look at on a new TV, and their TV buying preferences.
Transcript: Selling digital books in 2024: Insights from industry leaders - T...BookNet Canada
The publishing industry has been selling digital audiobooks and ebooks for over a decade and has found its groove. What’s changed? What has stayed the same? Where do we go from here? Join a group of leading sales peers from across the industry for a conversation about the lessons learned since the popularization of digital books, best practices, digital book supply chain management, and more.
Link to video recording: https://bnctechforum.ca/sessions/selling-digital-books-in-2024-insights-from-industry-leaders/
Presented by BookNet Canada on May 28, 2024, with support from the Department of Canadian Heritage.
GDG Cloud Southlake #33: Boule & Rebala: Effective AppSec in SDLC using Deplo...James Anderson
Effective Application Security in Software Delivery lifecycle using Deployment Firewall and DBOM
The modern software delivery process (or the CI/CD process) includes many tools, distributed teams, open-source code, and cloud platforms. Constant focus on speed to release software to market, along with the traditional slow and manual security checks has caused gaps in continuous security as an important piece in the software supply chain. Today organizations feel more susceptible to external and internal cyber threats due to the vast attack surface in their applications supply chain and the lack of end-to-end governance and risk management.
The software team must secure its software delivery process to avoid vulnerability and security breaches. This needs to be achieved with existing tool chains and without extensive rework of the delivery processes. This talk will present strategies and techniques for providing visibility into the true risk of the existing vulnerabilities, preventing the introduction of security issues in the software, resolving vulnerabilities in production environments quickly, and capturing the deployment bill of materials (DBOM).
Speakers:
Bob Boule
Robert Boule is a technology enthusiast with PASSION for technology and making things work along with a knack for helping others understand how things work. He comes with around 20 years of solution engineering experience in application security, software continuous delivery, and SaaS platforms. He is known for his dynamic presentations in CI/CD and application security integrated in software delivery lifecycle.
Gopinath Rebala
Gopinath Rebala is the CTO of OpsMx, where he has overall responsibility for the machine learning and data processing architectures for Secure Software Delivery. Gopi also has a strong connection with our customers, leading design and architecture for strategic implementations. Gopi is a frequent speaker and well-known leader in continuous delivery and integrating security into software delivery.
Accelerate your Kubernetes clusters with Varnish CachingThijs Feryn
A presentation about the usage and availability of Varnish on Kubernetes. This talk explores the capabilities of Varnish caching and shows how to use the Varnish Helm chart to deploy it to Kubernetes.
This presentation was delivered at K8SUG Singapore. See https://feryn.eu/presentations/accelerate-your-kubernetes-clusters-with-varnish-caching-k8sug-singapore-28-2024 for more details.
JMeter webinar - integration with InfluxDB and GrafanaRTTS
Watch this recorded webinar about real-time monitoring of application performance. See how to integrate Apache JMeter, the open-source leader in performance testing, with InfluxDB, the open-source time-series database, and Grafana, the open-source analytics and visualization application.
In this webinar, we will review the benefits of leveraging InfluxDB and Grafana when executing load tests and demonstrate how these tools are used to visualize performance metrics.
Length: 30 minutes
Session Overview
-------------------------------------------
During this webinar, we will cover the following topics while demonstrating the integrations of JMeter, InfluxDB and Grafana:
- What out-of-the-box solutions are available for real-time monitoring JMeter tests?
- What are the benefits of integrating InfluxDB and Grafana into the load testing stack?
- Which features are provided by Grafana?
- Demonstration of InfluxDB and Grafana using a practice web application
To view the webinar recording, go to:
https://www.rttsweb.com/jmeter-integration-webinar
Key Trends Shaping the Future of Infrastructure.pdfCheryl Hung
Keynote at DIGIT West Expo, Glasgow on 29 May 2024.
Cheryl Hung, ochery.com
Sr Director, Infrastructure Ecosystem, Arm.
The key trends across hardware, cloud and open-source; exploring how these areas are likely to mature and develop over the short and long-term, and then considering how organisations can position themselves to adapt and thrive.
Empowering NextGen Mobility via Large Action Model Infrastructure (LAMI): pav...
Air quality 2012
1. Trends in Air Quality
• Our air quality has been improving
- Air quality in ‘Good’ range 96% of the time in 2011 compared
to 82% 10 years ago
AIR QUALITY IN TERMS OF PSI
( 1993 TO 2011 )
100
93 88 88 95 96
83 85 91 93 96
82
80 70 70
68
% of Days
64 65
61
60 4946 4948
39
40 32 36 35
30 30
17 18
20 12 12 14
7 5 4 9 7 4
0
93 94 95 96 97 98 99 00 01 02 03 04 05 06 07 08 09 10 11
Good Moderate Unhealthy
2. Trends in Air Quality
PM10 (Annual Mean)
80 Transboundary haze with
Unhealthy air quality days Transboundary haze with
Unhealthy air quality
µg/m3
60
days
40
20
0
1994 1995 1996 1997 1998 1999 2000 2001 2002 2003 2004 2005 2006 2007 2008 2009 2010 2011
PM2.5 (Annual Mean)
45 Euro IV Emission
Ultra Low Standards for
Sulphur Diesel Vehicles
35 Diesel from Oct 2006
(<0.005% S)
µg/m3
from Dec
25 2005
15
5
1998 1999 2000 2001 2002 2003 2004 2005 2006 2007 2008 2009 2010 2011
3. Trends in Air Quality
Sulphur Dioxide (Annual Mean)
50
40 Limit S content n Ultra Low
Natural gas for power Sulphur Diesel
fuel oil to 1% from generation
30 Dec 2005. (<0.005% S)
from Dec 2005
20
10
0
1994 1995 1996 1997 1998 1999 2000 2001 2002 2003 2004 2005 2006 2007 2008 2009 2010 2011
50
Ozone (Annual Mean)
40
µg/m3
30
20
10
0
1994 1995 1996 1997 1998 1999 2000 2001 2002 2003 2004 2005 2006 2007 2008 2009 2010 2011
5. Air Quality Benchmarked Against Asian Cities - Asian Green City Index
The Asian Green City Index, a 2011 research project by the Economist Intelligence
Unit, sponsored by Siemens, assessed the environmental performance of 22 Asian cities
across 8 criteria (Energy and CO2, Land use and
Buildings, Transport, Waste, Water, Sanitation, Air Quality, and Environmental Governance).
The chart compares the air quality data presented in the report.
6. Air Quality Benchmarked Against European and US Cities
80
70 SO2 NO2 PM10 PM2.5
60
Annual Average
50
40
30
20
10
0
Los Angeles (2011) Washington DC (2011)
Compiled by NEA from various published sources
8. Air Pollution and Control Strategies
Domestic sources of air pollution
• Motor vehicles e.g. diesel vehicles account for about 50% of PM2.5
• Industries e.g. refineries & power stations account for more than 80% of SO2
Transboundary sources
• Smoke haze from land and forest fires in the region
Air pollution management & control strategies
• Integrated urban & industrial planning
• Development control
• Legislation, enforcement programme and monitoring
Pollutants of concern
• SO2 and PM2.5 are of concern
• NO2 and CO meet WHO AQGs. PM10 and ozone are marginally above WHO AQG
12. Roadmap to Achieve 2020 Targets – Abatement Measures for Vehicles
1 Apr 2014
Emission
1 Jan 2014
standards for
Emission new petrol
standards for vehicles to be
1 Oct 2013 new diesel tightened from
Cleaner petrol for vehicles to be Euro II to Euro
motor vehicles tightened from IV
with sulphur Euro IV to Euro V
1 Jul 2013 content lower
Near sulphur- than 0.005%
free diesel
(0.001% S)
1 July 2012
Min emission stds (US Tier 2/Japan Tier
1/EU Stage II) for off-road diesel engines New measures
imported for use
Measures announced
at earlier COS
13. Roadmap to Achieve 2020 Targets – Abatement Measures for Industries
Reduce SO2 emissions from refineries
• Cleaner fuels such as natural gas and lower sulphur fuel oil
• Improve sulphur recovery processes
• Adopt cost effective measures and practices to further reduce emissions eg.
SO2 scrubbing system
Reduce SO2 emissions from power stations
•Currently, gencos use mainly natural gas (NG) and some fuel oil for
power generation
• Gencos will increase use of NG and lower sulphur fuel oil
15. Enhancements to Air Quality Reporting
Retain Pollutant Standards Index (PSI)
Report PM2.5 levels daily
• As an internationally harmonised protocol for reporting air quality
index is not available, countries adopt different index systems
• Most index systems are based on SO2, PM10, ozone, CO and
NO2. Only the US, Canada, UK and New South Wales/Australia
include PM2.5 in their Index
• Advisory Committee reviewed PSI adopted by NEA and has
recommended retaining PSI as it is backed by health studies and
is still relevant
• Countries in the region use indices similar to PSI. They do not
include PM2.5 in their index
• NEA will report PM2.5 and issue health advisories by region
16. Enhancements to Air Quality Reporting
Existing Enhancements
• PSI reported at 4pm by 5 regions • PSI and PM2.5 levels by 5 regions 3
(North, South, East, West & Central) times a day at 8am, 12noon & 4pm
• Health advisory issued for the whole • Health advisories will be issued by
of Singapore (not by region) region
• Hourly updates of 3-h PSI during • Continue with hourly updates of 3-h
smoke haze episodes PSI during smoke haze episodes
To commence on 24 Aug 2012
17. Example of Air Quality Information Posted on NEA Website
PSI Pollutant Concentration
Air Quality at 8 am on 17 Aug 2012
Region Health Advisory
24-hour PM2.5
PSI
Concentration (µg/m3)
None for the general population. Unusually sensitive people
North 44 34
should consider reducing prolonged or heavy exertion.
None for the general population. Unusually sensitive people
South 34 20
should consider reducing prolonged or heavy exertion.
None for the general population. Unusually sensitive people
East 42 26
should consider reducing prolonged or heavy exertion.
None for the general population. Unusually sensitive people
West 41 27
should consider reducing prolonged or heavy exertion.
None for the general population. Unusually sensitive people
Central 39 19
should consider reducing prolonged or heavy exertion.
Overall Singapore 34 - 44 19 - 34 -
*Sensitive groups : People with heart and lung diseases, older adults (ages 65 and above) and children.
Note: Air quality based on PSI is as follows:
PSI Value Air Quality Descriptor
0 – 50 Good
51 – 100 Moderate
101 – 200 Unhealthy
201 – 300 Very unhealthy
Above 300 Hazardous
Notes:-WHO does not set standard for SO2 annual mean. The annual mean of 15μg/m3 to be met by 2020 as set out under SSB is retained.-WHO IT-3 target of 37.5 µg/m3 for PM2.5 (24-hour mean) and 15 µg/m3 for PM2.5 (annual mean) is recommended by Advisory Committee. SSB target for PM2.5 annual mean of 12μg/m3 supersede WHO IT-3 of 15μg/m3, and corresponding 24-h target of 37.5μg/m3 is retained.-The WHO AQG Global Update 2005 recommend revised limits for the concentration of selected air pollutants: PM10, PM2.5, ozone, NO2 and SO2, but the earlier WHO AQG update in 1997 for the rest of the air pollutants, including CO is retained.