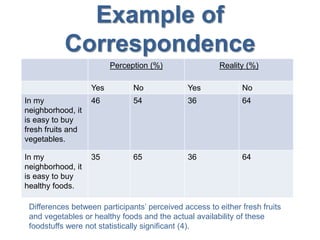
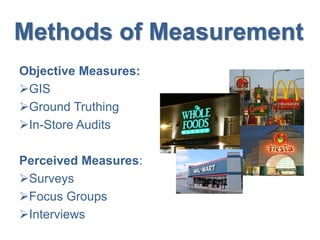
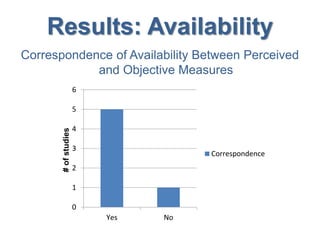
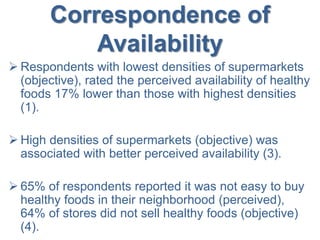
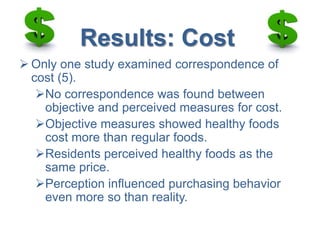
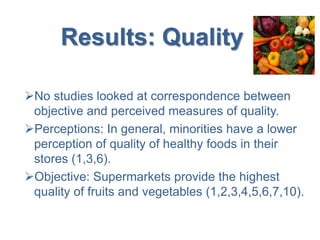
1. The Neighborhood Food
Environment
Correspondence between participant perceptions of
availability of goods and services and healthy
eating options and objective assessments (i.e. VF
mapping exercise data + GASI).
By: Rosie Ford
Mentors: Heather Adamus and Kyle Cheung
2. Outline
Define correspondence
Method for researching topic
Methods of measurement used
Characteristics of food stores
Results
Other influences
Challenges
Recommendations
Conclusions
Super Study
Questions
4. Example of
Correspondence
Perception (%) Reality (%)
Yes No Yes No
In my
neighborhood, it
is easy to buy
fresh fruits and
vegetables.
46 54 36 64
In my
neighborhood, it
is easy to buy
healthy foods.
35 65 36 64
Differences between participants’ perceived access to either fresh fruits
and vegetables or healthy foods and the actual availability of these
foodstuffs were not statistically significant (4).
6. Studies Used
10 articles within 5 years
Only 6 studies actually examined the
correspondence between objective measures and
perceived measures
2 used objective measures only
2 were reviews of methods used to measure the
food environment with recommendations for future
research
7. Methods of Measurement
Objective Measures:
GIS
Ground Truthing
In-Store Audits
Perceived Measures:
Surveys
Focus Groups
Interviews
10. Correspondence of
Availability
Respondents with lowest densities of supermarkets
(objective), rated the perceived availability of healthy
foods 17% lower than those with highest densities
(1).
High densities of supermarkets (objective) was
associated with better perceived availability (3).
65% of respondents reported it was not easy to buy
healthy foods in their neighborhood (perceived),
64% of stores did not sell healthy foods (objective)
(4).
11. Results: Cost
Only one study examined correspondence of
cost (5).
No correspondence was found between
objective and perceived measures for cost.
Objective measures showed healthy foods
cost more than regular foods.
Residents perceived healthy foods as the
same price.
Perception influenced purchasing behavior
even more so than reality.
12. Results: Quality
No studies looked at correspondence between
objective and perceived measures of quality.
Perceptions: In general, minorities have a lower
perception of quality of healthy foods in their
stores (1,3,6).
Objective: Supermarkets provide the highest
quality of fruits and vegetables (1,2,3,4,5,6,7,10).
14. Race/Ethnicity
Minorities have low perceived availability (1).
More convenience stores and less super
markets in non-white communities (1).
African Americans have low perceived
availability (2,6).
African Americans have low perceived quality
(2).
15. SES
Convenience stores have higher prices for
healthy foods and are more common in deprived
areas (10).
Residents of low-income neighborhoods have
low perceived availability (1).
Low-income neighborhoods have lower
densities of super markets (1).
16. Distance
Only distance had a direct association with
satisfaction (6).
Transportation
Lack of transportation can influence where
people shop (2).
17. Challenges
With Objective Measures
Need for standardized methods
Defining geographical limits
Types of food stores
Accessibility within stores
Defining quality and freshness (8,9)
19. Recommendations
For Future Research:
Based on prior formative research
Consider all food sources
Include information on access to food within stores
Consider seasonal variation in pricing and
availability
Consider differential acceptance of food assistance
program benefits
Include perceptions, cultural differences, and
social/cultural patterns (8,9)
20. Recommendations
For Policy Makers:
Zoning laws to standardize proportion of
supermarkets and convenience stores in all
neighborhoods
Provide grants/funding for
community gardens
Raise taxes on “high fat” unhealthy foods to equal
out higher cost of healthy foods
21. Recommendations
For Practitioners:
Educate people on the importance of
accessibility to supermarkets when choosing a
neighborhood
Educate policy makers on the nutritional effect of
the food environment
Build coalitions with policy makers to promote
change
Educate people on community gardening
22. Conclusions
There needs to be more studies done.
Perceptions seem to mirror reality in most cases.
When perceptions and reality are different,
people’s perceptions have a greater impact on
purchasing behavior.
Complimentary measures should be used.
23. My Super Study
I would choose several different sites to study,
varying by rural/urban, geography, SES,
ethnicity, and race.
I would use face-to-face interviews to measure
perceptions of availability, cost, and quality of
food environment.
I would then conduct an assessment of the
actual availability, cost, quality, and accessibility
of those stores using in-store audits.
I would compare the findings from the perceived
and objective measures to look for patterns or
correlations.
24. References
1. Moore LV, Diez-Roux AVD, Brines S. Comparing perception-based and
geographic information system (GIS)-based characterizations of the local food
environment. Journal of Urban Health: Bulletin of the New York Academy of
Medicine. March 2009;85(2):206-16.
2. Kumar S, Quinn SC, Kriska AM, Thomas SB. “Food is directed to the area”:
African Americans’ perceptions of the neighborhood nutrition environment in
Pittsburgh. Health & Place. January 2011;17(1):370-78.
3. Moore LV, Diez-Roux AV, Nettleton JA, Jacobs DR Jr. Associations of the local
food environment with diet quality—a comparison of assessments based on
surveys and geographic information systems: the multi-ethnic study of
atherosclerosis. The American Journal of Epidemiology . April 2008;167(8):917-
24.
4. Freedman DA, Bell BA. Access to healthful foods among an urban food insecure
population: perceptions versus reality. Journal of Urban Health: Bulletin of the
New York Academy of Medicine. November 2009;86(6):825-38.
5. Giskes K, Van Lenthe FJ, Brug J, Mackenbach JP, Turrell G. Socioeconomic
inequalities in food purchasing: the contribution of respondent-perceived and
actual (objectively measured) price and availability of foods. Preventive Medicine.
July 2007;45(1):41-8.
25. References (Cont.)
6. Zenk SN, Schulz AJ, Lachance LL, et al. Multivlevel correlates of
satisfaction with neighborhood availability of fresh fruits and vegetables. Annals
of Behavioral Medicine. August 2009;38(1):48-59.
7. Smith DM, Cummins S, Taylor M, et al. Neighbourhood food environment
and area deprivation: spatial accessibility to grocery stores selling fresh fruit
and vegetables in urban and rural settings. International Journal of
Epidemiology. February 2010;39(1):277-284.
8. Glanz K. Measuring food environments: a historical perspective. American
Journal of Preventive Medicine. April 2009;36(4S):S93-8.
9. Gittelsohn J, Sharma S. Physical, consumer, and social aspects of
measuring the food environment among diverse low-income populations.
American Journal of Preventive Medicine. April 2009;36(4S):S161-5.
10. Lee RE, Heinrich KM, Medina AV, et al. A picture of the healthful food
environment in two diverse urban cities. Environmental Health Insights. July 21,
2010;4:49-60.