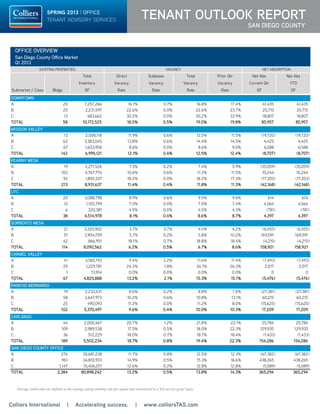
SlideShare a Scribd company logo
Colliers International | Accelerating success. | www.colliersTAS.com
TENANT OUTLOOK Report
SAN DIEGO COUNTY
SPRING 2013 | OFFICE
TENANT ADVISORY SERVICES
VACANCY BY SPACE TYPE
Q1 2013 Q4 2012 CHANGE
Direct 13.25% 13.60% 
SUBLEASE 0.54% 0.66% 
TOTAL 13.79% 14.26% 
VACANCY BY CLASS
Q1 2013 Q4 2012 CHANGE
CLASS A 12.53% 12.31% 
CLASS B 15.33% 16.63% 
CLASS C 12.84% 12.79% 
OFFICE VACANCY RATES
Q1 2013
0%
2%
4%
6%
8%
10%
12%
14%
16%
18%
20%
-1.0
-0.5
0.0
0.5
1.0
1.5
2.0
2.5
3.0
2002 2003 2004 2005 2006 2007 2008 2009 2010 2011 2012 2013
Q1
VacancyRate
SF(Millions)
Net Absorption New Supply Vacancy
NEW SUPPLY, ABSORPTION AND VACANCY RATES
16.0%
11.2%
12.5%
19.0%
13.1%
13.8%
0% 5% 10% 15% 20%
Downtown
Suburban
S.D. County
All Classes Class A
OFFICE VACANCY RATES
Q1 2013
62.4%
25.2% 9.0%
2.6%
0.9% <= 2,000 SF [367]
2,001 - 5,000 SF [148]
5,001 - 10,000 SF [53]
10,001 - 20,000 SF [15]
>= 20,001 SF [5]
OFFICE LEASING ACTIVITY BY TENANT SIZE
Percentage of Total Leases Completed in Q1 2013
$2.00
$2.10
$2.20
$2.30
$2.40
$2.50
$2.60
$2.70
$2.80
$2.90
$3.00
$3.10
$3.20
$3.30
Q1
08
Q2
08
Q3
08
Q4
08
Q1
09
Q2
09
Q3
09
Q4
09
Q1
10
Q2
10
Q3
10
Q4
10
Q1
11
Q2
11
Q3
11
Q4
11
Q1
12
Q2
12
Q3
12
Q4
12
Q1
13
$/SF/Month(FS)
Class A All Classes
HISTORICAL RENTAL RATE TRENDS
Class A & Overall Office Rates
Quarterly Average Asking Rate Per SF Per Month (Full Service)
Office Market Starts Off 2013 With Strong Demand
MARKET OVERVIEW
Office demand continues its strong momentum resulting in fewer leasing incentives and
rising rents in the high-demand office markets. Prime office space options are diminishing as
companies “fast track” their search and lease negotiations to lock up the choice locations before
their competitors are able to. San Diego County’s office market posted a strong start as over
365,000 SF of positive net absorption (demand) was achieved in Q1 2013.
The March 2013 San Diego County unemployment rate measured 7.7%, dropping below 8% for
the first time in more than four years. Statewide, California’s unemployment rate dropped in
March to 9.4% as job growth continued to outpace the nation. San Diego County employers
added 8,300 people in March and a solid 32,600 people over the past 12 months. The industry
sectors of “Leisure and Hospitality”, “Education and Health” and “Professional and Business”
were the big employment drivers.
The steady recovery in San Diego’s office market is catching the attention of local and
national investors who have recently acquired Advanced Equities Plaza in Downtown San
Diego, the former SAIC headquarters in UTC and Foley Center in Carmel Valley. A recent
PricewaterhouseCoopers report noted that U.S. commercial property investors are looking
favorably at San Diego’s continued rent growth in high-demand submarkets such as Mission
Valley, UTC, Sorrento Mesa and Carmel Valley.
Large lease transactions during Q1 included XIFIN leasing 45,000 SF at ServiceNow’s former
Carmel Valley space, Union Bank leasing 84,000 SF at Illumina’s former UTC space and Konica/
Minolta’s renewal of 27,000 SF in Sorrento Mesa.
NET ABSORPTION and VACANCY
Continuing a trend that began in Q3 2012, Class B demand ratcheted up significantly in Q1 and
dominated all classes with 413,000 SF of net absorption. For the first time since Q4 2009,
Class A posted negative absorption of 67,000 SF for Q1 as many companies followed the “Flight
to Value” leasing opportunities in Class B office buildings.
Downtown San Diego (CBD) posted positive net absorption of 86,000 SF in Q1 which doubles
the level of demand during all of 2012. Overall net absorption for the suburban markets totaled
a positive 279,000 SF.
With net absorption trending positive for 12 of the last 13 quarters, the countywide total vacancy
rate declined to 13.8%. A sub-14% countywide rate hasn’t been seen in over five years. The
countywide total vacancy is comprised of 13.2% direct vacancy and 0.5% sublease vacancy.
Downtown (CBD) posted a 19% overall vacancy while the suburban office markets achieved
a 13% vacancy. Q1 vacancy for the key suburban office markets are: Mission Valley (12.5%),
Kearny Mesa (11.8%), UTC (8.5%), Sorrento Mesa (6.7%), Carmel Valley (15.3%), Carlsbad
(19.5%) and Rancho Bernardo (10%).
OPPORTUNITIES
There seems to be a renaissance for creative non-traditional uses in Downtown as the
“Generation Y” workforce prefers to live and work in more vibrant urban settings. Emerging
industries such as technology, design, internet-service related companies, and schools are
creating a more diversified tenant base for Downtown. With a 19% office vacancy, companies
can achieve strong leasing concessions in the majority of high-rise towers along with
commanding views.
Elsewhere in Mission Valley and North City West (Carmel Valley, Sorrento Mesa, and UTC) large
blocks of available office space are becoming more scarce causing rents to rise and leasing
concessions to shrink. Both The Irvine Company and Kilroy Realty are contemplating breaking
ground on new Class A office buildings in UTC and Sorrento Mesa subject to market timing.
NEW SUPPLY
New development is picking up in 2013 and into 2014. Construction on the 250,000 SF FBI
building and a 250,000 SF expansion of Qualcomm – both in Sorrento Mesa – will be completed
in 2013. Del Mar Corporate Plaza is undergoing a major redevelopment of its two building
125,000 SF Class A office project in Carmel Valley with Latham Watkins committing to 70,000
SF in early 2014 leaving 55,000 SF available for lease in mid-2014. Additionally, 40,000 SF
of new construction is underway at the Torrey Reserve project in Carmel Valley and 33,000 SF
at Quail Gardens Corporate Center in Encinitas. Finally, the 415,000 SF build-to-suit for LPL
Financial in UTC will be completed in 2014.
CLICK
HERE
TENANT ADVISORY SERVICES
WEBSITE
Average rental rates are defined as the average asking monthly rate per square foot normalized to a “full service gross” basis.
SPRING 2013 | OFFICE
TENANT ADVISORY SERVICES TENANT OUTLOOK Report
SAN DIEGO COUNTY
Submarket / Class Bldgs
Total
Inventory
SF
Direct
Vacancy
Rate
Sublease
Vacancy
Rate
Total
Vacancy
Rate
Prior Qtr
Vacancy
Rate
Net Abs
Current Qtr
SF
Net Abs
YTD
SF
DOWNTOWN
A 20 7,257,266 16.1% 0.7% 16.8% 17.4% 41,435 41,435
B 25 2,231,597 22.6% 0.0% 22.6% 23.7% 25,715 25,715
C 13 683,662 30.2% 0.0% 30.2% 33.9% 18,807 18,807
TOTAL 58 10,172,525 18.5% 0.5% 19.0% 19.8% 85,957 85,957
MISSION VALLEY
A 13 2,008,118 11.9% 0.6% 12.5% 11.5% (19,720) (19,720)
B 62 3,383,045 13.8% 0.6% 14.4% 14.5% 4,425 4,425
C 67 1,603,958 8.6% 0.0% 8.6% 9.0% 6,588 6,588
TOTAL 142 6,995,121 12.1% 0.4% 12.5% 12.4% (8,707) (8,707)
KEARNY MESA
A 19 2,271,526 7.3% 0.2% 7.4% 5.9% (35,059) (35,059)
B 102 4,767,774 10.6% 0.6% 11.3% 11.5% 10,244 10,244
C 92 1,892,337 18.2% 0.0% 18.2% 17.3% (17,353) (17,353)
TOTAL 213 8,931,637 11.4% 0.4% 11.8% 11.3% (42,168) (42,168)
UTC
A 20 3,088,798 8.9% 0.6% 9.5% 9.6% 614 614
B 12 1,105,799 7.0% 0.0% 7.0% 7.4% 4,564 4,564
C 6 320,381 4.5% 0.0% 4.5% 4.3% (781) (781)
TOTAL 38 4,514,978 8.1% 0.4% 8.6% 8.7% 4,397 4,397
SORRENTO MESA
A 21 3,320,902 3.7% 0.7% 4.4% 4.2% (6,455) (6,455)
B 51 3,904,709 5.7% 0.2% 5.8% 10.2% 169,591 169,591
C 42 866,951 18.1% 0.7% 18.8% 18.4% (4,215) (4,215)
TOTAL 114 8,092,562 6.2% 0.5% 6.7% 8.6% 158,921 158,921
CARMEL VALLEY
A 41 3,582,193 9.4% 2.2% 11.6% 11.4% (7,493) (7,493)
B 25 1,229,781 24.3% 1.8% 26.1% 26.3% 2,017 2,017
C 1 13,914 0.0% 0.0% 0.0% 0.0% 0 0
TOTAL 67 4,825,888 13.2% 2.1% 15.3% 15.1% (5,476) (5,476)
RANCHO BERNARDO
A 19 2,232,431 8.6% 0.2% 8.8% 7.6% (27,381) (27,381)
B 58 2,647,973 10.2% 0.6% 10.8% 13.1% 60,215 60,215
C 25 490,093 11.2% 0.0% 11.2% 8.0% (15,625) (15,625)
TOTAL 102 5,370,497 9.6% 0.4% 10.0% 10.3% 17,209 17,209
CARLSBAD
A 44 2,000,467 20.7% 1.2% 21.8% 23.1% 25,784 25,784
B 109 2,989,538 17.5% 0.5% 18.0% 22.3% 129,935 129,935
C 36 512,229 18.0% 0.7% 18.7% 18.4% (1,433) (1,433)
TOTAL 189 5,502,234 18.7% 0.8% 19.4% 22.3% 154,286 154,286
SAN DIEGO COUNTY OFFICE
A 276 30,681,238 11.7% 0.8% 12.5% 12.3% (67,382) (67,382)
B 961 34,810,933 14.9% 0.5% 15.3% 16.6% 438,265 438,265
C 1,147 15,406,071 12.6% 0.2% 12.8% 12.8% (5,589) (5,589)
TOTAL 2,384 80,898,242 13.2% 0.5% 13.8% 14.3% 365,294 365,294
San Diego County Office Market�
VACANCY NET ABSORPTIONEXISTING PROPERTIES
OFFICE OVERVIEW
Q1 2013
Colliers International | Accelerating success. | www.colliersTAS.com
Colliers International
4660 La Jolla Village Drive, Suite 100 San Diego, CA 92122 | USA
tel +1 858.677.5363
522 offices in
62 countries on
6 continents
United States: 125
Canada: 38
Latin America: 18
Asia Pacific: 214
EMEA: 117
•	$68 billion in annual revenue
•	1.25 billion square feet under
management
•	Over 12,300 professionals
This report has been prepared by Colliers International for general information only. Information contained herein has been obtained from sources deemed reliable and no representation is made
as to the accuracy thereof. Colliers International does not guarantee, warrant or represent that the information contained in this document is correct. Any interested party should undertake their
own inquiries as to the accuracy of the information. Colliers International excludes unequivocally all inferred or implied terms, conditions and warranties arising out of this document and excludes
all liability for loss and damages arising there from.
Accelerating success.
TENANT OUTLOOK REPORT | SPRING 2013 | OFFICE | SAN DIEGO COUNTY
Tenant Advisory Services
www.ColliersTAS.com
> Only represent tenants in their
office lease and purchase
negotiations
> Provide objective conflict-free
advice with full service
resources
> Increase profitability &
mitigate risk
RON MILLER
Senior Director
Tenant Advisory
Services
858.677.5363
LIC # 00874868
	 Ron Miller is a tenant advisory
specialist. His expertise encompasses
relocation / expansion / contraction
strategies, lease renewal and
restructuring, market analysis, and
user purchase opportunities. With
his extensive career experience
in representing both tenants
and landlords, Ron offers a
unique perspective and valuable
insight to his tenant clients.
33.2
23.0
14.2
16.5
13.3
25.4
17.6
31.1
25.2
29.8
18.1
19.5
14.6
19.2
19.8
32.8
24.8
23.7
32.8
19.1
18.0
15.3
16.8
23.4
28.3
26.3
24.3
0
6
12
18
24
30
36
Downtown Mission
Valley
Kearny
Mesa
UTC Sorrento
Mesa
Carmel
Valley
Rancho
Bernardo
Carlsbad San Diego
County
Months
Class A Class B All Classes
OFFICE SPACE TIME-ON-THE-MARKET
Average Months by Submarket and Class
TIME ON MARKET
Time-on-the-market for Class A office space is averaging 25.2 months countywide.
62.4%
25.2% 9.0%
2.6%
0.9% <= 2,000 SF [367]
2,001 - 5,000 SF [148]
5,001 - 10,000 SF [53]
10,001 - 20,000 SF [15]
>= 20,001 SF [5]
OFFICE LEASING ACTIVITY BY TENANT SIZE
Percentage of Total Leases Completed in Q1 2013
$2.00
$2.10
$2.20
$2.30
$2.40
$2.50
$2.60
$2.70
$2.80
$2.90
$3.00
$3.10
$3.20
$3.30
Q1
08
Q2
08
Q3
08
Q4
08
Q1
09
Q2
09
Q3
09
Q4
09
Q1
10
Q2
10
Q3
10
Q4
10
Q1
11
Q2
11
Q3
11
Q4
11
Q1
12
Q2
12
Q3
12
Q4
12
Q1
13
$/SF/Month(FS)
Class A All Classes
HISTORICAL RENTAL RATE TRENDS
Class A & Overall Office Rates
Quarterly Average Asking Rate Per SF Per Month (Full Service)
RENTAL RATES
For four years, the average
asking rental rate in all office
classes had been steadily
decreasing and bottomed out
at $2.10/SF/month “full
service gross” at the end of
2011. In 2012, the average
rate for all classes increased
and remained level at $2.11/
SF. However, as of Q1 2013,
this rate increased to $2.12/
SF (+$0.01) while the Class
A rate increased by $0.05 to
stand at $2.70/SF.
0%
2%
4%
6%
8%
10%
12%
14%
16%
18%
20%
10 2011 2012 2013
Q1
VacancyRate
Vacancy
Y RATES
62.4%
25.2% 9.0%
2.6%
0.9% <= 2,000 SF [367]
2,001 - 5,000 SF [148]
5,001 - 10,000 SF [53]
10,001 - 20,000 SF [15]
>= 20,001 SF [5]
OFFICE LEASING ACTIVITY BY TENANT SIZE
Percentage of Total Leases Completed in Q1 2013
$2.00
$2.10
$2.20
$2.30
$2.40
$2.50
$2.60
$2.70
$2.80
$2.90
$3.00
$3.10
$3.20
$3.30
Q1
08
Q2
08
Q3
08
Q4
08
Q1
09
Q2
09
Q3
09
Q4
09
Q1
10
Q2
10
Q3
10
Q4
10
Q1
11
Q2
11
Q3
11
Q4
11
Q1
12
Q2
12
Q3
12
Q4
12
Q1
13
$/SF/Month(FS)
Class A All Classes
HISTORICAL RENTAL RATE TRENDS
Class A & Overall Office Rates
Quarterly Average Asking Rate Per SF Per Month (Full Service)
LEASING ACTIVITY
A total of 588 leases were
completed in Q1 2013
totaling 1.5 million square
feet. This equated to a 5%
decrease in lease
transactions compared to
the previous quarter. The
drop in leasing activity will
likely be reflected in
diminished – yet positive –
net absorption in Q2 2013.
www.ronmillersd.com
Colliers International | Accelerating success. | www.colliersTAS.com

More Related Content

Similar to Tor q1 2013_draft02

JLL Columbus Office Outlook: Q2 2016
JLL Columbus Office Outlook: Q2 2016JLL Columbus Office Outlook: Q2 2016
JLL Columbus Office Outlook: Q2 2016
Peter McStravick
 
JLL Cleveland Office Outlook: Q2 2018
JLL Cleveland Office Outlook: Q2 2018JLL Cleveland Office Outlook: Q2 2018
JLL Cleveland Office Outlook: Q2 2018
Andrew Batson
 
JLL Cleveland Office Outlook: Q4 2018
JLL Cleveland Office Outlook: Q4 2018JLL Cleveland Office Outlook: Q4 2018
JLL Cleveland Office Outlook: Q4 2018
Andrew Batson
 
JLL Grand Rapids Office Insight & Statistics - Q3 2018
JLL Grand Rapids Office Insight & Statistics - Q3 2018JLL Grand Rapids Office Insight & Statistics - Q3 2018
JLL Grand Rapids Office Insight & Statistics - Q3 2018
Harrison West
 
JLL Grand Rapids Office Insight - Fall 2016
JLL Grand Rapids Office Insight - Fall 2016JLL Grand Rapids Office Insight - Fall 2016
JLL Grand Rapids Office Insight - Fall 2016
Aaron Moore
 
2015 Mid-Year Viewpoint_Orange County_Office
2015 Mid-Year Viewpoint_Orange County_Office2015 Mid-Year Viewpoint_Orange County_Office
2015 Mid-Year Viewpoint_Orange County_OfficeCourtney Bergk
 
JLL Grand Rapids Office Insight & Statistics - Q4 2019
JLL Grand Rapids Office Insight & Statistics - Q4 2019JLL Grand Rapids Office Insight & Statistics - Q4 2019
JLL Grand Rapids Office Insight & Statistics - Q4 2019
Harrison West
 
Q2 2014 Austin Office Market Research Report
Q2 2014 Austin Office Market Research ReportQ2 2014 Austin Office Market Research Report
Q2 2014 Austin Office Market Research Report
Colliers International | Houston
 
JLL Cleveland Office Outlook: Q1 2018
JLL Cleveland Office Outlook: Q1 2018JLL Cleveland Office Outlook: Q1 2018
JLL Cleveland Office Outlook: Q1 2018
Andrew Batson
 
Q42012 Cincinnati Market Tr
Q42012 Cincinnati Market TrQ42012 Cincinnati Market Tr
Q42012 Cincinnati Market Trcolliersohio
 
Broward County Office Outlook - Q4 2018
Broward County Office Outlook - Q4 2018Broward County Office Outlook - Q4 2018
Broward County Office Outlook - Q4 2018
JLL Florida
 
JLL Cleveland Industrial Outlook: Q2 2019
JLL Cleveland Industrial Outlook: Q2 2019JLL Cleveland Industrial Outlook: Q2 2019
JLL Cleveland Industrial Outlook: Q2 2019
Andrew Batson
 
JLL Cleveland Office Outlook: Q1 2018
JLL Cleveland Office Outlook: Q1 2018JLL Cleveland Office Outlook: Q1 2018
JLL Cleveland Office Outlook: Q1 2018
Andrew Batson
 
JLL Cleveland Office Outlook: Q1 2018
JLL Cleveland Office Outlook: Q1 2018JLL Cleveland Office Outlook: Q1 2018
JLL Cleveland Office Outlook: Q1 2018
Andrew Batson
 
JLL Detroit Office Insight & Statistics - Q1 2019
JLL Detroit Office Insight & Statistics - Q1 2019JLL Detroit Office Insight & Statistics - Q1 2019
JLL Detroit Office Insight & Statistics - Q1 2019
Harrison West
 
Management Investor Presentation - Q3 2014
Management Investor Presentation - Q3 2014Management Investor Presentation - Q3 2014
Management Investor Presentation - Q3 2014
RioCan
 
JLL Grand Rapids Office Insight & Statistics - Q2 2019
JLL Grand Rapids Office Insight & Statistics - Q2 2019JLL Grand Rapids Office Insight & Statistics - Q2 2019
JLL Grand Rapids Office Insight & Statistics - Q2 2019
Harrison West
 
C&amp;W 2012 Market Survey Presentation
C&amp;W 2012 Market Survey PresentationC&amp;W 2012 Market Survey Presentation
C&amp;W 2012 Market Survey Presentation
Paul_Morse
 
JLL Detroit Office Insight & Statistics - Q1 2018
JLL Detroit Office Insight & Statistics - Q1 2018JLL Detroit Office Insight & Statistics - Q1 2018
JLL Detroit Office Insight & Statistics - Q1 2018
Harrison West
 
JLL Detroit Office Insight & Statistics - Q2 2019
JLL Detroit Office Insight & Statistics - Q2 2019JLL Detroit Office Insight & Statistics - Q2 2019
JLL Detroit Office Insight & Statistics - Q2 2019
Harrison West
 

Similar to Tor q1 2013_draft02 (20)

JLL Columbus Office Outlook: Q2 2016
JLL Columbus Office Outlook: Q2 2016JLL Columbus Office Outlook: Q2 2016
JLL Columbus Office Outlook: Q2 2016
 
JLL Cleveland Office Outlook: Q2 2018
JLL Cleveland Office Outlook: Q2 2018JLL Cleveland Office Outlook: Q2 2018
JLL Cleveland Office Outlook: Q2 2018
 
JLL Cleveland Office Outlook: Q4 2018
JLL Cleveland Office Outlook: Q4 2018JLL Cleveland Office Outlook: Q4 2018
JLL Cleveland Office Outlook: Q4 2018
 
JLL Grand Rapids Office Insight & Statistics - Q3 2018
JLL Grand Rapids Office Insight & Statistics - Q3 2018JLL Grand Rapids Office Insight & Statistics - Q3 2018
JLL Grand Rapids Office Insight & Statistics - Q3 2018
 
JLL Grand Rapids Office Insight - Fall 2016
JLL Grand Rapids Office Insight - Fall 2016JLL Grand Rapids Office Insight - Fall 2016
JLL Grand Rapids Office Insight - Fall 2016
 
2015 Mid-Year Viewpoint_Orange County_Office
2015 Mid-Year Viewpoint_Orange County_Office2015 Mid-Year Viewpoint_Orange County_Office
2015 Mid-Year Viewpoint_Orange County_Office
 
JLL Grand Rapids Office Insight & Statistics - Q4 2019
JLL Grand Rapids Office Insight & Statistics - Q4 2019JLL Grand Rapids Office Insight & Statistics - Q4 2019
JLL Grand Rapids Office Insight & Statistics - Q4 2019
 
Q2 2014 Austin Office Market Research Report
Q2 2014 Austin Office Market Research ReportQ2 2014 Austin Office Market Research Report
Q2 2014 Austin Office Market Research Report
 
JLL Cleveland Office Outlook: Q1 2018
JLL Cleveland Office Outlook: Q1 2018JLL Cleveland Office Outlook: Q1 2018
JLL Cleveland Office Outlook: Q1 2018
 
Q42012 Cincinnati Market Tr
Q42012 Cincinnati Market TrQ42012 Cincinnati Market Tr
Q42012 Cincinnati Market Tr
 
Broward County Office Outlook - Q4 2018
Broward County Office Outlook - Q4 2018Broward County Office Outlook - Q4 2018
Broward County Office Outlook - Q4 2018
 
JLL Cleveland Industrial Outlook: Q2 2019
JLL Cleveland Industrial Outlook: Q2 2019JLL Cleveland Industrial Outlook: Q2 2019
JLL Cleveland Industrial Outlook: Q2 2019
 
JLL Cleveland Office Outlook: Q1 2018
JLL Cleveland Office Outlook: Q1 2018JLL Cleveland Office Outlook: Q1 2018
JLL Cleveland Office Outlook: Q1 2018
 
JLL Cleveland Office Outlook: Q1 2018
JLL Cleveland Office Outlook: Q1 2018JLL Cleveland Office Outlook: Q1 2018
JLL Cleveland Office Outlook: Q1 2018
 
JLL Detroit Office Insight & Statistics - Q1 2019
JLL Detroit Office Insight & Statistics - Q1 2019JLL Detroit Office Insight & Statistics - Q1 2019
JLL Detroit Office Insight & Statistics - Q1 2019
 
Management Investor Presentation - Q3 2014
Management Investor Presentation - Q3 2014Management Investor Presentation - Q3 2014
Management Investor Presentation - Q3 2014
 
JLL Grand Rapids Office Insight & Statistics - Q2 2019
JLL Grand Rapids Office Insight & Statistics - Q2 2019JLL Grand Rapids Office Insight & Statistics - Q2 2019
JLL Grand Rapids Office Insight & Statistics - Q2 2019
 
C&amp;W 2012 Market Survey Presentation
C&amp;W 2012 Market Survey PresentationC&amp;W 2012 Market Survey Presentation
C&amp;W 2012 Market Survey Presentation
 
JLL Detroit Office Insight & Statistics - Q1 2018
JLL Detroit Office Insight & Statistics - Q1 2018JLL Detroit Office Insight & Statistics - Q1 2018
JLL Detroit Office Insight & Statistics - Q1 2018
 
JLL Detroit Office Insight & Statistics - Q2 2019
JLL Detroit Office Insight & Statistics - Q2 2019JLL Detroit Office Insight & Statistics - Q2 2019
JLL Detroit Office Insight & Statistics - Q2 2019
 

Recently uploaded

FINAL PRESENTATION.pptx12143241324134134
FINAL PRESENTATION.pptx12143241324134134FINAL PRESENTATION.pptx12143241324134134
FINAL PRESENTATION.pptx12143241324134134
LR1709MUSIC
 
Meas_Dylan_DMBS_PB1_2024-05XX_Revised.pdf
Meas_Dylan_DMBS_PB1_2024-05XX_Revised.pdfMeas_Dylan_DMBS_PB1_2024-05XX_Revised.pdf
Meas_Dylan_DMBS_PB1_2024-05XX_Revised.pdf
dylandmeas
 
Digital Transformation and IT Strategy Toolkit and Templates
Digital Transformation and IT Strategy Toolkit and TemplatesDigital Transformation and IT Strategy Toolkit and Templates
Digital Transformation and IT Strategy Toolkit and Templates
Aurelien Domont, MBA
 
Putting the SPARK into Virtual Training.pptx
Putting the SPARK into Virtual Training.pptxPutting the SPARK into Virtual Training.pptx
Putting the SPARK into Virtual Training.pptx
Cynthia Clay
 
The Influence of Marketing Strategy and Market Competition on Business Perfor...
The Influence of Marketing Strategy and Market Competition on Business Perfor...The Influence of Marketing Strategy and Market Competition on Business Perfor...
The Influence of Marketing Strategy and Market Competition on Business Perfor...
Adam Smith
 
Exploring Patterns of Connection with Social Dreaming
Exploring Patterns of Connection with Social DreamingExploring Patterns of Connection with Social Dreaming
Exploring Patterns of Connection with Social Dreaming
Nicola Wreford-Howard
 
Affordable Stationery Printing Services in Jaipur | Navpack n Print
Affordable Stationery Printing Services in Jaipur | Navpack n PrintAffordable Stationery Printing Services in Jaipur | Navpack n Print
Affordable Stationery Printing Services in Jaipur | Navpack n Print
Navpack & Print
 
Improving profitability for small business
Improving profitability for small businessImproving profitability for small business
Improving profitability for small business
Ben Wann
 
Memorandum Of Association Constitution of Company.ppt
Memorandum Of Association Constitution of Company.pptMemorandum Of Association Constitution of Company.ppt
Memorandum Of Association Constitution of Company.ppt
seri bangash
 
3.0 Project 2_ Developing My Brand Identity Kit.pptx
3.0 Project 2_ Developing My Brand Identity Kit.pptx3.0 Project 2_ Developing My Brand Identity Kit.pptx
3.0 Project 2_ Developing My Brand Identity Kit.pptx
tanyjahb
 
Skye Residences | Extended Stay Residences Near Toronto Airport
Skye Residences | Extended Stay Residences Near Toronto AirportSkye Residences | Extended Stay Residences Near Toronto Airport
Skye Residences | Extended Stay Residences Near Toronto Airport
marketingjdass
 
BeMetals Presentation_May_22_2024 .pdf
BeMetals Presentation_May_22_2024   .pdfBeMetals Presentation_May_22_2024   .pdf
BeMetals Presentation_May_22_2024 .pdf
DerekIwanaka1
 
RMD24 | Debunking the non-endemic revenue myth Marvin Vacquier Droop | First ...
RMD24 | Debunking the non-endemic revenue myth Marvin Vacquier Droop | First ...RMD24 | Debunking the non-endemic revenue myth Marvin Vacquier Droop | First ...
RMD24 | Debunking the non-endemic revenue myth Marvin Vacquier Droop | First ...
BBPMedia1
 
Attending a job Interview for B1 and B2 Englsih learners
Attending a job Interview for B1 and B2 Englsih learnersAttending a job Interview for B1 and B2 Englsih learners
Attending a job Interview for B1 and B2 Englsih learners
Erika906060
 
Discover the innovative and creative projects that highlight my journey throu...
Discover the innovative and creative projects that highlight my journey throu...Discover the innovative and creative projects that highlight my journey throu...
Discover the innovative and creative projects that highlight my journey throu...
dylandmeas
 
Enterprise Excellence is Inclusive Excellence.pdf
Enterprise Excellence is Inclusive Excellence.pdfEnterprise Excellence is Inclusive Excellence.pdf
Enterprise Excellence is Inclusive Excellence.pdf
KaiNexus
 
Unveiling the Secrets How Does Generative AI Work.pdf
Unveiling the Secrets How Does Generative AI Work.pdfUnveiling the Secrets How Does Generative AI Work.pdf
Unveiling the Secrets How Does Generative AI Work.pdf
Sam H
 
ikea_woodgreen_petscharity_dog-alogue_digital.pdf
ikea_woodgreen_petscharity_dog-alogue_digital.pdfikea_woodgreen_petscharity_dog-alogue_digital.pdf
ikea_woodgreen_petscharity_dog-alogue_digital.pdf
agatadrynko
 
5 Things You Need To Know Before Hiring a Videographer
5 Things You Need To Know Before Hiring a Videographer5 Things You Need To Know Before Hiring a Videographer
5 Things You Need To Know Before Hiring a Videographer
ofm712785
 
Cree_Rey_BrandIdentityKit.PDF_PersonalBd
Cree_Rey_BrandIdentityKit.PDF_PersonalBdCree_Rey_BrandIdentityKit.PDF_PersonalBd
Cree_Rey_BrandIdentityKit.PDF_PersonalBd
creerey
 

Recently uploaded (20)

FINAL PRESENTATION.pptx12143241324134134
FINAL PRESENTATION.pptx12143241324134134FINAL PRESENTATION.pptx12143241324134134
FINAL PRESENTATION.pptx12143241324134134
 
Meas_Dylan_DMBS_PB1_2024-05XX_Revised.pdf
Meas_Dylan_DMBS_PB1_2024-05XX_Revised.pdfMeas_Dylan_DMBS_PB1_2024-05XX_Revised.pdf
Meas_Dylan_DMBS_PB1_2024-05XX_Revised.pdf
 
Digital Transformation and IT Strategy Toolkit and Templates
Digital Transformation and IT Strategy Toolkit and TemplatesDigital Transformation and IT Strategy Toolkit and Templates
Digital Transformation and IT Strategy Toolkit and Templates
 
Putting the SPARK into Virtual Training.pptx
Putting the SPARK into Virtual Training.pptxPutting the SPARK into Virtual Training.pptx
Putting the SPARK into Virtual Training.pptx
 
The Influence of Marketing Strategy and Market Competition on Business Perfor...
The Influence of Marketing Strategy and Market Competition on Business Perfor...The Influence of Marketing Strategy and Market Competition on Business Perfor...
The Influence of Marketing Strategy and Market Competition on Business Perfor...
 
Exploring Patterns of Connection with Social Dreaming
Exploring Patterns of Connection with Social DreamingExploring Patterns of Connection with Social Dreaming
Exploring Patterns of Connection with Social Dreaming
 
Affordable Stationery Printing Services in Jaipur | Navpack n Print
Affordable Stationery Printing Services in Jaipur | Navpack n PrintAffordable Stationery Printing Services in Jaipur | Navpack n Print
Affordable Stationery Printing Services in Jaipur | Navpack n Print
 
Improving profitability for small business
Improving profitability for small businessImproving profitability for small business
Improving profitability for small business
 
Memorandum Of Association Constitution of Company.ppt
Memorandum Of Association Constitution of Company.pptMemorandum Of Association Constitution of Company.ppt
Memorandum Of Association Constitution of Company.ppt
 
3.0 Project 2_ Developing My Brand Identity Kit.pptx
3.0 Project 2_ Developing My Brand Identity Kit.pptx3.0 Project 2_ Developing My Brand Identity Kit.pptx
3.0 Project 2_ Developing My Brand Identity Kit.pptx
 
Skye Residences | Extended Stay Residences Near Toronto Airport
Skye Residences | Extended Stay Residences Near Toronto AirportSkye Residences | Extended Stay Residences Near Toronto Airport
Skye Residences | Extended Stay Residences Near Toronto Airport
 
BeMetals Presentation_May_22_2024 .pdf
BeMetals Presentation_May_22_2024   .pdfBeMetals Presentation_May_22_2024   .pdf
BeMetals Presentation_May_22_2024 .pdf
 
RMD24 | Debunking the non-endemic revenue myth Marvin Vacquier Droop | First ...
RMD24 | Debunking the non-endemic revenue myth Marvin Vacquier Droop | First ...RMD24 | Debunking the non-endemic revenue myth Marvin Vacquier Droop | First ...
RMD24 | Debunking the non-endemic revenue myth Marvin Vacquier Droop | First ...
 
Attending a job Interview for B1 and B2 Englsih learners
Attending a job Interview for B1 and B2 Englsih learnersAttending a job Interview for B1 and B2 Englsih learners
Attending a job Interview for B1 and B2 Englsih learners
 
Discover the innovative and creative projects that highlight my journey throu...
Discover the innovative and creative projects that highlight my journey throu...Discover the innovative and creative projects that highlight my journey throu...
Discover the innovative and creative projects that highlight my journey throu...
 
Enterprise Excellence is Inclusive Excellence.pdf
Enterprise Excellence is Inclusive Excellence.pdfEnterprise Excellence is Inclusive Excellence.pdf
Enterprise Excellence is Inclusive Excellence.pdf
 
Unveiling the Secrets How Does Generative AI Work.pdf
Unveiling the Secrets How Does Generative AI Work.pdfUnveiling the Secrets How Does Generative AI Work.pdf
Unveiling the Secrets How Does Generative AI Work.pdf
 
ikea_woodgreen_petscharity_dog-alogue_digital.pdf
ikea_woodgreen_petscharity_dog-alogue_digital.pdfikea_woodgreen_petscharity_dog-alogue_digital.pdf
ikea_woodgreen_petscharity_dog-alogue_digital.pdf
 
5 Things You Need To Know Before Hiring a Videographer
5 Things You Need To Know Before Hiring a Videographer5 Things You Need To Know Before Hiring a Videographer
5 Things You Need To Know Before Hiring a Videographer
 
Cree_Rey_BrandIdentityKit.PDF_PersonalBd
Cree_Rey_BrandIdentityKit.PDF_PersonalBdCree_Rey_BrandIdentityKit.PDF_PersonalBd
Cree_Rey_BrandIdentityKit.PDF_PersonalBd
 

Tor q1 2013_draft02

  • 1. Colliers International | Accelerating success. | www.colliersTAS.com TENANT OUTLOOK Report SAN DIEGO COUNTY SPRING 2013 | OFFICE TENANT ADVISORY SERVICES VACANCY BY SPACE TYPE Q1 2013 Q4 2012 CHANGE Direct 13.25% 13.60%  SUBLEASE 0.54% 0.66%  TOTAL 13.79% 14.26%  VACANCY BY CLASS Q1 2013 Q4 2012 CHANGE CLASS A 12.53% 12.31%  CLASS B 15.33% 16.63%  CLASS C 12.84% 12.79%  OFFICE VACANCY RATES Q1 2013 0% 2% 4% 6% 8% 10% 12% 14% 16% 18% 20% -1.0 -0.5 0.0 0.5 1.0 1.5 2.0 2.5 3.0 2002 2003 2004 2005 2006 2007 2008 2009 2010 2011 2012 2013 Q1 VacancyRate SF(Millions) Net Absorption New Supply Vacancy NEW SUPPLY, ABSORPTION AND VACANCY RATES 16.0% 11.2% 12.5% 19.0% 13.1% 13.8% 0% 5% 10% 15% 20% Downtown Suburban S.D. County All Classes Class A OFFICE VACANCY RATES Q1 2013 62.4% 25.2% 9.0% 2.6% 0.9% <= 2,000 SF [367] 2,001 - 5,000 SF [148] 5,001 - 10,000 SF [53] 10,001 - 20,000 SF [15] >= 20,001 SF [5] OFFICE LEASING ACTIVITY BY TENANT SIZE Percentage of Total Leases Completed in Q1 2013 $2.00 $2.10 $2.20 $2.30 $2.40 $2.50 $2.60 $2.70 $2.80 $2.90 $3.00 $3.10 $3.20 $3.30 Q1 08 Q2 08 Q3 08 Q4 08 Q1 09 Q2 09 Q3 09 Q4 09 Q1 10 Q2 10 Q3 10 Q4 10 Q1 11 Q2 11 Q3 11 Q4 11 Q1 12 Q2 12 Q3 12 Q4 12 Q1 13 $/SF/Month(FS) Class A All Classes HISTORICAL RENTAL RATE TRENDS Class A & Overall Office Rates Quarterly Average Asking Rate Per SF Per Month (Full Service) Office Market Starts Off 2013 With Strong Demand MARKET OVERVIEW Office demand continues its strong momentum resulting in fewer leasing incentives and rising rents in the high-demand office markets. Prime office space options are diminishing as companies “fast track” their search and lease negotiations to lock up the choice locations before their competitors are able to. San Diego County’s office market posted a strong start as over 365,000 SF of positive net absorption (demand) was achieved in Q1 2013. The March 2013 San Diego County unemployment rate measured 7.7%, dropping below 8% for the first time in more than four years. Statewide, California’s unemployment rate dropped in March to 9.4% as job growth continued to outpace the nation. San Diego County employers added 8,300 people in March and a solid 32,600 people over the past 12 months. The industry sectors of “Leisure and Hospitality”, “Education and Health” and “Professional and Business” were the big employment drivers. The steady recovery in San Diego’s office market is catching the attention of local and national investors who have recently acquired Advanced Equities Plaza in Downtown San Diego, the former SAIC headquarters in UTC and Foley Center in Carmel Valley. A recent PricewaterhouseCoopers report noted that U.S. commercial property investors are looking favorably at San Diego’s continued rent growth in high-demand submarkets such as Mission Valley, UTC, Sorrento Mesa and Carmel Valley. Large lease transactions during Q1 included XIFIN leasing 45,000 SF at ServiceNow’s former Carmel Valley space, Union Bank leasing 84,000 SF at Illumina’s former UTC space and Konica/ Minolta’s renewal of 27,000 SF in Sorrento Mesa. NET ABSORPTION and VACANCY Continuing a trend that began in Q3 2012, Class B demand ratcheted up significantly in Q1 and dominated all classes with 413,000 SF of net absorption. For the first time since Q4 2009, Class A posted negative absorption of 67,000 SF for Q1 as many companies followed the “Flight to Value” leasing opportunities in Class B office buildings. Downtown San Diego (CBD) posted positive net absorption of 86,000 SF in Q1 which doubles the level of demand during all of 2012. Overall net absorption for the suburban markets totaled a positive 279,000 SF. With net absorption trending positive for 12 of the last 13 quarters, the countywide total vacancy rate declined to 13.8%. A sub-14% countywide rate hasn’t been seen in over five years. The countywide total vacancy is comprised of 13.2% direct vacancy and 0.5% sublease vacancy. Downtown (CBD) posted a 19% overall vacancy while the suburban office markets achieved a 13% vacancy. Q1 vacancy for the key suburban office markets are: Mission Valley (12.5%), Kearny Mesa (11.8%), UTC (8.5%), Sorrento Mesa (6.7%), Carmel Valley (15.3%), Carlsbad (19.5%) and Rancho Bernardo (10%). OPPORTUNITIES There seems to be a renaissance for creative non-traditional uses in Downtown as the “Generation Y” workforce prefers to live and work in more vibrant urban settings. Emerging industries such as technology, design, internet-service related companies, and schools are creating a more diversified tenant base for Downtown. With a 19% office vacancy, companies can achieve strong leasing concessions in the majority of high-rise towers along with commanding views. Elsewhere in Mission Valley and North City West (Carmel Valley, Sorrento Mesa, and UTC) large blocks of available office space are becoming more scarce causing rents to rise and leasing concessions to shrink. Both The Irvine Company and Kilroy Realty are contemplating breaking ground on new Class A office buildings in UTC and Sorrento Mesa subject to market timing. NEW SUPPLY New development is picking up in 2013 and into 2014. Construction on the 250,000 SF FBI building and a 250,000 SF expansion of Qualcomm – both in Sorrento Mesa – will be completed in 2013. Del Mar Corporate Plaza is undergoing a major redevelopment of its two building 125,000 SF Class A office project in Carmel Valley with Latham Watkins committing to 70,000 SF in early 2014 leaving 55,000 SF available for lease in mid-2014. Additionally, 40,000 SF of new construction is underway at the Torrey Reserve project in Carmel Valley and 33,000 SF at Quail Gardens Corporate Center in Encinitas. Finally, the 415,000 SF build-to-suit for LPL Financial in UTC will be completed in 2014. CLICK HERE TENANT ADVISORY SERVICES WEBSITE
  • 2. Average rental rates are defined as the average asking monthly rate per square foot normalized to a “full service gross” basis. SPRING 2013 | OFFICE TENANT ADVISORY SERVICES TENANT OUTLOOK Report SAN DIEGO COUNTY Submarket / Class Bldgs Total Inventory SF Direct Vacancy Rate Sublease Vacancy Rate Total Vacancy Rate Prior Qtr Vacancy Rate Net Abs Current Qtr SF Net Abs YTD SF DOWNTOWN A 20 7,257,266 16.1% 0.7% 16.8% 17.4% 41,435 41,435 B 25 2,231,597 22.6% 0.0% 22.6% 23.7% 25,715 25,715 C 13 683,662 30.2% 0.0% 30.2% 33.9% 18,807 18,807 TOTAL 58 10,172,525 18.5% 0.5% 19.0% 19.8% 85,957 85,957 MISSION VALLEY A 13 2,008,118 11.9% 0.6% 12.5% 11.5% (19,720) (19,720) B 62 3,383,045 13.8% 0.6% 14.4% 14.5% 4,425 4,425 C 67 1,603,958 8.6% 0.0% 8.6% 9.0% 6,588 6,588 TOTAL 142 6,995,121 12.1% 0.4% 12.5% 12.4% (8,707) (8,707) KEARNY MESA A 19 2,271,526 7.3% 0.2% 7.4% 5.9% (35,059) (35,059) B 102 4,767,774 10.6% 0.6% 11.3% 11.5% 10,244 10,244 C 92 1,892,337 18.2% 0.0% 18.2% 17.3% (17,353) (17,353) TOTAL 213 8,931,637 11.4% 0.4% 11.8% 11.3% (42,168) (42,168) UTC A 20 3,088,798 8.9% 0.6% 9.5% 9.6% 614 614 B 12 1,105,799 7.0% 0.0% 7.0% 7.4% 4,564 4,564 C 6 320,381 4.5% 0.0% 4.5% 4.3% (781) (781) TOTAL 38 4,514,978 8.1% 0.4% 8.6% 8.7% 4,397 4,397 SORRENTO MESA A 21 3,320,902 3.7% 0.7% 4.4% 4.2% (6,455) (6,455) B 51 3,904,709 5.7% 0.2% 5.8% 10.2% 169,591 169,591 C 42 866,951 18.1% 0.7% 18.8% 18.4% (4,215) (4,215) TOTAL 114 8,092,562 6.2% 0.5% 6.7% 8.6% 158,921 158,921 CARMEL VALLEY A 41 3,582,193 9.4% 2.2% 11.6% 11.4% (7,493) (7,493) B 25 1,229,781 24.3% 1.8% 26.1% 26.3% 2,017 2,017 C 1 13,914 0.0% 0.0% 0.0% 0.0% 0 0 TOTAL 67 4,825,888 13.2% 2.1% 15.3% 15.1% (5,476) (5,476) RANCHO BERNARDO A 19 2,232,431 8.6% 0.2% 8.8% 7.6% (27,381) (27,381) B 58 2,647,973 10.2% 0.6% 10.8% 13.1% 60,215 60,215 C 25 490,093 11.2% 0.0% 11.2% 8.0% (15,625) (15,625) TOTAL 102 5,370,497 9.6% 0.4% 10.0% 10.3% 17,209 17,209 CARLSBAD A 44 2,000,467 20.7% 1.2% 21.8% 23.1% 25,784 25,784 B 109 2,989,538 17.5% 0.5% 18.0% 22.3% 129,935 129,935 C 36 512,229 18.0% 0.7% 18.7% 18.4% (1,433) (1,433) TOTAL 189 5,502,234 18.7% 0.8% 19.4% 22.3% 154,286 154,286 SAN DIEGO COUNTY OFFICE A 276 30,681,238 11.7% 0.8% 12.5% 12.3% (67,382) (67,382) B 961 34,810,933 14.9% 0.5% 15.3% 16.6% 438,265 438,265 C 1,147 15,406,071 12.6% 0.2% 12.8% 12.8% (5,589) (5,589) TOTAL 2,384 80,898,242 13.2% 0.5% 13.8% 14.3% 365,294 365,294 San Diego County Office Market� VACANCY NET ABSORPTIONEXISTING PROPERTIES OFFICE OVERVIEW Q1 2013 Colliers International | Accelerating success. | www.colliersTAS.com
  • 3. Colliers International 4660 La Jolla Village Drive, Suite 100 San Diego, CA 92122 | USA tel +1 858.677.5363 522 offices in 62 countries on 6 continents United States: 125 Canada: 38 Latin America: 18 Asia Pacific: 214 EMEA: 117 • $68 billion in annual revenue • 1.25 billion square feet under management • Over 12,300 professionals This report has been prepared by Colliers International for general information only. Information contained herein has been obtained from sources deemed reliable and no representation is made as to the accuracy thereof. Colliers International does not guarantee, warrant or represent that the information contained in this document is correct. Any interested party should undertake their own inquiries as to the accuracy of the information. Colliers International excludes unequivocally all inferred or implied terms, conditions and warranties arising out of this document and excludes all liability for loss and damages arising there from. Accelerating success. TENANT OUTLOOK REPORT | SPRING 2013 | OFFICE | SAN DIEGO COUNTY Tenant Advisory Services www.ColliersTAS.com > Only represent tenants in their office lease and purchase negotiations > Provide objective conflict-free advice with full service resources > Increase profitability & mitigate risk RON MILLER Senior Director Tenant Advisory Services 858.677.5363 LIC # 00874868 Ron Miller is a tenant advisory specialist. His expertise encompasses relocation / expansion / contraction strategies, lease renewal and restructuring, market analysis, and user purchase opportunities. With his extensive career experience in representing both tenants and landlords, Ron offers a unique perspective and valuable insight to his tenant clients. 33.2 23.0 14.2 16.5 13.3 25.4 17.6 31.1 25.2 29.8 18.1 19.5 14.6 19.2 19.8 32.8 24.8 23.7 32.8 19.1 18.0 15.3 16.8 23.4 28.3 26.3 24.3 0 6 12 18 24 30 36 Downtown Mission Valley Kearny Mesa UTC Sorrento Mesa Carmel Valley Rancho Bernardo Carlsbad San Diego County Months Class A Class B All Classes OFFICE SPACE TIME-ON-THE-MARKET Average Months by Submarket and Class TIME ON MARKET Time-on-the-market for Class A office space is averaging 25.2 months countywide. 62.4% 25.2% 9.0% 2.6% 0.9% <= 2,000 SF [367] 2,001 - 5,000 SF [148] 5,001 - 10,000 SF [53] 10,001 - 20,000 SF [15] >= 20,001 SF [5] OFFICE LEASING ACTIVITY BY TENANT SIZE Percentage of Total Leases Completed in Q1 2013 $2.00 $2.10 $2.20 $2.30 $2.40 $2.50 $2.60 $2.70 $2.80 $2.90 $3.00 $3.10 $3.20 $3.30 Q1 08 Q2 08 Q3 08 Q4 08 Q1 09 Q2 09 Q3 09 Q4 09 Q1 10 Q2 10 Q3 10 Q4 10 Q1 11 Q2 11 Q3 11 Q4 11 Q1 12 Q2 12 Q3 12 Q4 12 Q1 13 $/SF/Month(FS) Class A All Classes HISTORICAL RENTAL RATE TRENDS Class A & Overall Office Rates Quarterly Average Asking Rate Per SF Per Month (Full Service) RENTAL RATES For four years, the average asking rental rate in all office classes had been steadily decreasing and bottomed out at $2.10/SF/month “full service gross” at the end of 2011. In 2012, the average rate for all classes increased and remained level at $2.11/ SF. However, as of Q1 2013, this rate increased to $2.12/ SF (+$0.01) while the Class A rate increased by $0.05 to stand at $2.70/SF. 0% 2% 4% 6% 8% 10% 12% 14% 16% 18% 20% 10 2011 2012 2013 Q1 VacancyRate Vacancy Y RATES 62.4% 25.2% 9.0% 2.6% 0.9% <= 2,000 SF [367] 2,001 - 5,000 SF [148] 5,001 - 10,000 SF [53] 10,001 - 20,000 SF [15] >= 20,001 SF [5] OFFICE LEASING ACTIVITY BY TENANT SIZE Percentage of Total Leases Completed in Q1 2013 $2.00 $2.10 $2.20 $2.30 $2.40 $2.50 $2.60 $2.70 $2.80 $2.90 $3.00 $3.10 $3.20 $3.30 Q1 08 Q2 08 Q3 08 Q4 08 Q1 09 Q2 09 Q3 09 Q4 09 Q1 10 Q2 10 Q3 10 Q4 10 Q1 11 Q2 11 Q3 11 Q4 11 Q1 12 Q2 12 Q3 12 Q4 12 Q1 13 $/SF/Month(FS) Class A All Classes HISTORICAL RENTAL RATE TRENDS Class A & Overall Office Rates Quarterly Average Asking Rate Per SF Per Month (Full Service) LEASING ACTIVITY A total of 588 leases were completed in Q1 2013 totaling 1.5 million square feet. This equated to a 5% decrease in lease transactions compared to the previous quarter. The drop in leasing activity will likely be reflected in diminished – yet positive – net absorption in Q2 2013. www.ronmillersd.com Colliers International | Accelerating success. | www.colliersTAS.com