
More Related Content
What's hot
What's hot (16)
Viewers also liked
Similar to Ticket Trends thru June 2016
Similar to Ticket Trends thru June 2016 (19)
Recently uploaded
Recently uploaded (20)
Ticket Trends thru June 2016
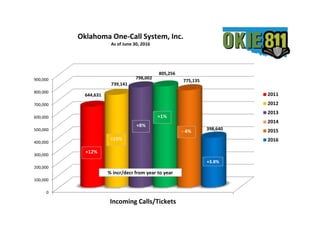
- 1. +6% +12% +15% % Increase from year to year 0 100,000 200,000 300,000 400,000 500,000 600,000 700,000 800,000 900,000 Incoming Calls/Tickets 644,631 739,141 798,002 805,256 775,135 398,640 2011 2012 2013 2014 2015 2016 Oklahoma One-Call System, Inc. As of June 30, 2016 +8% +15% +12% % incr/decr from year to year +3.8% +1% - 4%
- 2. +3% +9% +11% % Increase from year to year Jan Feb Mar Apr May Jun Jul Aug Sep Oct Nov Dec 2011 40,518 36,380 58,002 54,992 55,168 61,306 56,123 64,101 61,969 57,597 51,320 47,155 2012 55,179 52,971 61,898 65,211 68,070 64,179 66,025 70,000 58,363 68,712 58,767 49,766 2013 64,413 53,186 64,884 68,568 70,258 68,256 73,336 73,420 68,747 74,779 60,431 57,724 2014 70,357 61,827 70,473 74,912 71,683 70,272 70,787 68,814 67,550 69,954 51,509 57,118 2015 60,678 54,874 66,114 67,823 60,269 74,427 71,440 67,537 68,414 68,395 58,064 57,100 2016 59,093 64,502 72,594 64,621 66,243 71,587 30,000 35,000 40,000 45,000 50,000 55,000 60,000 65,000 70,000 75,000 80,000 85,000 Oklahoma One-Call System, Inc. Incoming Tickets - Trend by Month
- 3. +3% +10% +21% % Increase from year to year 0 1,000,000 2,000,000 3,000,000 4,000,000 5,000,000 6,000,000 7,000,000 Outgoing Locates/Ticket Transmissions 4,369,803 5,290,954 5,980,963 6,141,957 5,757,571 2,960,069 2011 2012 2013 2014 2015 2016 +10% +21% % incr/decr from year to year Oklahoma One-Call System, Inc. As of June 30, 2016 +13% +3.7% +3% - 6%
- 4. +3% +9% +11% % Increase from year to year Jan Feb Mar Apr May Jun Jul Aug Sep Oct Nov Dec 2011 269,139 244,692 385,003 366,951 371,770 418,288 381,052 437,568 421,303 396,734 352,115 325,188 2012 377,911 348,996 427,797 453,940 479,845 459,767 473,379 513,761 426,592 500,131 446,085 382,750 2013 486,885 401,485 491,412 513,818 524,187 505,871 548,502 545,447 509,699 558,850 450,665 444,142 2014 522,143 464,832 532,306 568,304 536,016 522,006 529,865 543,172 539,787 555,811 392,575 435,140 2015 457,509 407,684 492,287 497,258 449,965 550,538 528,720 490,637 503,723 510,416 436,207 432,627 2016 444,010 479,315 536,320 476,884 492,833 530,707 200,000 250,000 300,000 350,000 400,000 450,000 500,000 550,000 600,000 650,000 Oklahoma One-Call System, Inc. Outgoing Tickets/Transmissions - Trend by Month
- 5. 0 100,000 200,000 300,000 400,000 500,000 600,000 2011 2012 2013 2014 2015 2016 Oklahoma One-Call System, Inc. Incoming Locate Requests by Company Type As-of June 30, 2016 Contractor Government Occupants Utility Other 4% 5% 16% 5% 70%
- 6. 0 5,000 10,000 15,000 20,000 25,000 30,000 35,000 40,000 45,000 50,000 2016 Incoming Tickets by Work Type As-of June 30, 2016
- 7. -6% -7% 9% 17% -1% 18% -1% 8% 4% 30% 11% 6% -5% 13% 7% 14% -11% -15% 15% 32% -5% 15% 19% -17% -20% -10% 0% 10% 20% 30% 40% Incoming Tickets by Work Type Difference from YTD 2015 to YTD 2016 thru JUNE
- 8. 0.0% 10.0% 20.0% 30.0% 40.0% 50.0% 60.0% 70.0% 2011 2012 2013 2014 2015 2016 3.2% 2.1% 1.4% 0.8% 1.0% 0.7% 47.7% 43.5% 41.3% 39.6% 37.6% 38.3% 49.1% 54.4% 57.3% 59.5% 61.4% 61.0% % Fax Tickets % Call Tickets % Web Tickets Oklahoma One-Call System, Inc. Trends by Ticket Source As of June 30, 2016
- 9. 6.78 7.16 7.49 7.63 7.43 7.43 6.20 6.40 6.60 6.80 7.00 7.20 7.40 7.60 7.80 2011 2012 2013 2014 2015 2016 Avg Outgoing Tickets
- 10. -5.50% 3.01% 24.64% 2.70% -4.87% 9.41% -10% -5% 0% 5% 10% 15% 20% 25% 30% SW-Great Plains S-Chickasaw SE-Kiamichi Central-Frontier NW-Red Carpet NE-Green Cntry Incoming Tickets by PEDPC Council Area % of Change In Ticket Volumes Comparing June 2015 to June 2016
- 11. 52.81% 135.69% 57.63% 83.89% 52.76% 76.79% 82.49% 78.29% 0% 20% 40% 60% 80% 100% 120% 140% 160% OKMULGEE DEWEY GRANT COAL LE FLORE HARMON JEFFERSON TILLMAN NE-Green Cntry NW-Red Carpet NW-Red Carpet SE- Kiamichi SE- Kiamichi SW-Great Plains SW-Great Plains SW-Great Plains Incoming Tickets by PEDPC Council Area Counties/Areas with Largest Increase Comparing June 2015 to June 2016
- 12. 4% 4% 29% -20% 31% 17% 10% 13% -3% 7% 3% -2% -30% -20% -10% 0% 10% 20% 30% 40% 50% Central Oklahoma - Frontier % of Change In Ticket Volumes Comparing June 2015 to June 2016
- 13. 43% 3% 0% 23% -21% 1% 39% -2% 20% 53% -19% 30% 11% 20% 0% 7% 17% 44% -30% -20% -10% 0% 10% 20% 30% 40% 50% 60% 70% NE Oklahoma - Green Country % of Change In Ticket Volumes Comparing June 2015 to June 2016
- 14. -58% -44% 45% -2% 136% 4% -18% 58% -16% -13% 35% -16% 21% -13% -55% 25% -100% -50% 0% 50% 100% 150% NW Oklahoma - Red Carpet % of Change In Ticket Volumes Comparing June 2015 to June 2016
- 15. -7% 6% -8% 6% 13% -14% 77% 3% 82% -19% -23% -22% 78% -25% -40% -20% 0% 20% 40% 60% 80% 100% SW Oklahoma - Great Plains % of Change In Ticket Volumes Comparing June 2015 to June 2016
- 16. -3% 10% -12% -19% 10% 6% 15% -30% -20% -10% 0% 10% 20% 30% 40% CARTER GARVIN JOHNSTON LOVE MARSHALL MURRAY PONTOTOC South Oklahoma - Chickasaw % of Change In Ticket Volumes Comparing June 2015 to June 2016
- 17. 31% 0% 47% 84% 20% 29% 53% 22% 9% 19% 0% 10% 20% 30% 40% 50% 60% 70% 80% 90% ATOKA BRYAN CHOCTAW COAL HASKELL LATIMER LE FLORE MCCURTAIN PITTSBURG PUSHMATAHA SE Oklahoma - Kiamicha % of Change In Ticket Volumes Comparing June 2015 to June 2016