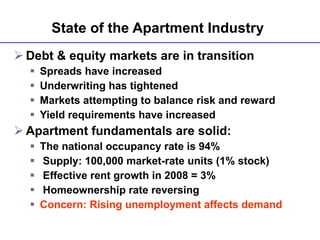
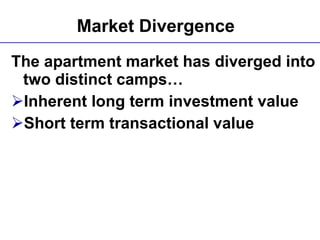
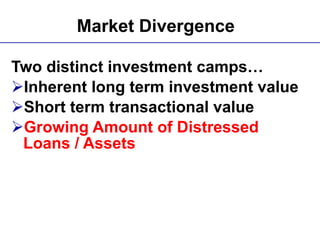
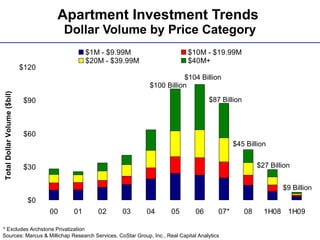
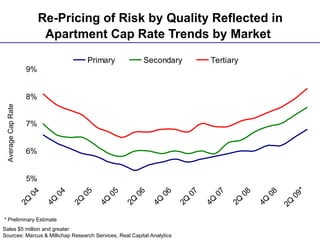
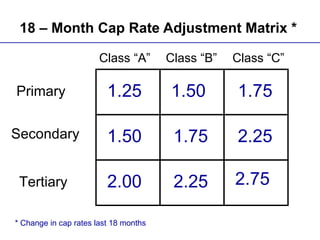
2009 APARTMENT TRENDS A National Multifamily Market Overview Linwood C. Thompson Managing Director NMHG
APARTMENT INVESTMENT  TRENDS and STRATEGIES
Market Divergence   Inherent investment value Fundamentals are relatively solid Future supply / demand favors appreciation Apartments remain a preferred investment vehicle  Short-term transactional value Capital markets in upheaval Debt and equity more expensive Investors are fearful and conservative Expectation of “discounted” to distressed pricing
State of the Apartment Industry   Debt & equity markets are in transition Spreads have increased Underwriting has tightened Markets attempting to balance risk and reward Yield requirements have increased Apartment fundamentals are solid: The national occupancy rate is 94% Supply: 100,000 market-rate units (1% stock) Effective rent growth in 2008 = 3% Homeownership rate reversing Concern: Rising unemployment affects demand
Key Observations for 2009 Multi-family capital markets remain fractured and expensive Investor demand tempered, motivated by anticipated discounts Revenue growth moderates but avoids historic cyclical decline magnitude in most markets Sales velocity remains low through at least the first half of 2009 Transactional cap rates continue to differentiate for quality and trend up 50 – 100 bps
Market Divergence   The apartment market has diverged into two distinct camps… Inherent long term investment value Short term transactional value
Market Divergence   Inherent long term investment value Construction starts are decreasing Future supply / demand favors appreciation Apartments remain a preferred investment Lack of suitable investment alternatives
Market Divergence   Short-term transactional value  Debt and equity more expensive Investors fearful and conservative Unemployment is damaging fundamentals Expectation of discounted / distressed pricing
Market Divergence   Two distinct investment camps… Inherent long term investment value Short term transactional value Growing Amount of Distressed Loans / Assets
Commercial Mortgage  Delinquency Rates by Group Delinquency Rates Delinquency rates at the end of each period Sources: Marcus & Millichap Research Services, Mortgage Bankers Association
Total CMBS Outstanding: $779.6 billion By Property Types ($Bil.): Office   $237.8 Retail   $230.0 Multi-Family   $120.1 Hotel   $73.3 Industrial   $39.8  Self-Storage   $14.0  Healthcare   $4.7 Other   $60.0  * As of 1Q09 Sources: Marcus & Millichap Research Services, MBA
Total Multi-Family Mortgage Debt Outstanding: $914.3 billion By Lender Types ($Bil): GSEs and Ginnie Mae  $351.9 Commercial Banks  $216.8 CMBS, CDO, and Other ABS  $111.7 State & Local Governments  $71.4 Savings Institutions  $66.3  Life Insurance Companies  $50.8 Other  $45.5  * As of 2Q09 Sources: Marcus & Millichap Research Services, MBA
Estimated Multi-Family Debt Maturities  by Lender Type Billions $ Sources: Marcus & Millichap Research Services, Foresight Analytics
Estimated Multi-Family Debt  Maturities by Vintage  Maturing Balance (Billions $) Sources: Marcus & Millichap Research Services, Foresight Analytics
Distressed Loan / Asset Issues   Loan sales vs. REO Asset Sales Portfolio vs. Individual Asset Sales Timing Complicated equity / debt “stacks” Liability issues Preservation of equity NPV vs. liquidity analysis
Distressed Loan / Asset Issues   Regulation / Documentation Issues Strategic differentiation for quality Improve management of asset Physically rehab the asset Could Special Asset Services provide seller-carried financing? Distressed assets controlled by private enterprises
Anatomy of Current Market Divergence   Inherent vs. Short term value? Three issues… In what time frame do you have to act? What is your opinion of long term apartment investment fundamentals? Pricing / timing of distressed assets?
Apartment Investment Trends  Dollar Volume by Price Category Sources: Marcus & Millichap Research Services, CoStar Group, Inc., Real Capital Analytics $104 Billion $100 Billion $45 Billion * Excludes Archstone Privatization $87 Billion $27 Billion $9 Billion
National Apartment Price and Cap Rates * Through 2Q Includes sales $1Million and Greater Sources: Marcus & Millichap Research Services,  Costar Group, Inc. Average  Price per Unit (000s) Average Cap Rate
Re-Pricing of Risk by Quality Reflected in  Apartment Cap Rate Trends by Market   Average Cap Rate Sales $5 million and greater Sources: Marcus & Millichap Research Services, Real Capital Analytics * Preliminary Estimate
18 – Month Cap Rate Adjustment Matrix *   Primary Secondary Tertiary Class “A” Class “B” Class “C” 1.25  1.50 1.75 1.50 1.75 2.25 2.25 2.75 2.00 * Change in cap rates last 18 months
18 – Month Pricing Adjustment Matrix   Primary Secondary Tertiary Class “A” Class “B” Class “C” -25%   Base =  5.00 / 5.50 5.50 / 6.25 6.00 / 6.75 -29%   -32%   -27%   -30%   -36%   -33%   -35%   -41%
U.S. Apartment Buyer Composition Sales $5 Million and greater Sources: Marcus & Millichap Research Services, Real Capital Analytics * YTD through July Percent of Sales Volume
U.S. Public REIT Valuation Indices  vs. S&P 500 Index: December 1993 = 100 Sources: Marcus & Millichap Research Services, NAREIT, Standard and Poor’s  Index (Dec. 1993 = 100) * Through September
Key Observations for 2010 Multi-family capital markets remain fractured and expensive Investor demand increases as economy begins recovery Revenue stabilizes  Sales velocity increases 20% to 30% Transactional cap rates stabilize in core markets and trend up 50 bps elsewhere
Marcus & Millichap’s NMHG Remains Bullish on U.S. Apartments Long-Term U.S. will experience a fundamental change in housing dynamics favoring the density, efficiency, flexibility and affordability of apartment living Population growth Changing demographics Environmental concerns Budget / expense factors Affordability Rent vs. own
Population Dynamics U.S. population is expected to increase 33% by 2030 to 376 million. To accommodate this growth, the nation needs 60 million new housing units. Millions 94 Million
Demographic Dynamics Married couples with children are projected to decline to under 1 in 5 households by 2025 Singles and un-related individuals living together will comprise 1 in 3 households by 2020 78 million echo boomers are getting ready to enter their prime renting years 10 million legal immigrants will enter the country in next ten years
7.4 Million Net New Households 3.2 Million New Renter Households 4.1 Million New Owner Households * Forecast Sources: Marcus & Millichap Research Services, Economy.com, Harvard University U.S. Household Growth Projection 2010 - 2015*
Environmental Dynamics Growing environmental awareness / concern favors compact development such as apartments Preserves green space Reduces amount of paved surfaces Reduces air pollution / need to drive ULI estimates we would save 85 million metric tons of carbon dioxide annually by 2030 if 60% of future growth is diverted to compact, walkable neighborhoods (apartments)
Budget / Fiscal Dynamics Urban / suburban sprawl is expensive Compact development reduces infrastructure costs and saves money The U.S. can save over $100 billion in infrastructure costs over 25 years by growing compactly
Affordability Dynamics 35 million households spend 30 percent or more of their annual income on housing 114 million people live in households that did not earn enough to reasonably afford a two-bedroom apartment ($37,105 / $925) Fastest growing industries are those with lower-paying jobs
Rent vs. Own Dynamics It costs $311 less a month on average to rent vs. own A $100 investment in housing in 1985 would be worth $270 today A $100 investment in stocks would be worth $722 today (+267%) Housing is shelter… not an investment
Marcus & Millichap’s NMHG Remains Bullish on U.S. Apartments Long-Term Starts down Demand increasing Supply difficult and expensive to deliver Current rents do not justify development  Housing “preference” beginning to shift Unlikely the industry will meet demand Significant future pressure on rents U.S. apartments will be dramatically more valuable in 2020 than 2010
U.S Economic, Capital Markets and  Apartment Market Overview and Outlook –  Multi-Family Executive Conference
Estimated Commercial Debt Maturities  by Lender Type Billions $ Sources: Marcus & Millichap Research Services, Foresight Analytics
Indicative Fannie Mae Rates Sources: Marcus & Millichap Research Services, Federal Reserve Board
Echo Boomer Demand Supports Appreciation * Forecast Sources: Marcus & Millichap Research Services, U.S. Census Bureau Change in Population Net Change:  -2.1 Million  -1.2 Million  1.8 Million  3.4 Million  3.2 Million  1.1 Million
U.S. Apartment Construction as a Percent of Beginning Inventory Construction as a Percent of Beg. Inventory * Forecast Sources: Marcus & Millichap Research Services, Reis
U.S. Apartment Investment Trends   Transactions by Price Total Transactions Excludes Archstone Privatization Sources: Marcus & Millichap Research Services, CoStar Group, Inc., Real Capital Analytics
U.S. Apartment Investment Trends   Dollar Volume by Price Total Dollar Volume (billions) Excludes Archstone Privatization Sources: Marcus & Millichap Research Services, CoStar Group, Inc., Real Capital Analytics
Year-over-Year Change * Through August Sources: Marcus & Millichap Research Services, BOC, Federal Reserve Value of U.S. Dollar vs. Value of Exports

Thompson Mfe2009

  • 1.
    2009 APARTMENT TRENDSA National Multifamily Market Overview Linwood C. Thompson Managing Director NMHG
  • 2.
    APARTMENT INVESTMENT TRENDS and STRATEGIES
  • 3.
    Market Divergence Inherent investment value Fundamentals are relatively solid Future supply / demand favors appreciation Apartments remain a preferred investment vehicle Short-term transactional value Capital markets in upheaval Debt and equity more expensive Investors are fearful and conservative Expectation of “discounted” to distressed pricing
  • 4.
    State of theApartment Industry Debt & equity markets are in transition Spreads have increased Underwriting has tightened Markets attempting to balance risk and reward Yield requirements have increased Apartment fundamentals are solid: The national occupancy rate is 94% Supply: 100,000 market-rate units (1% stock) Effective rent growth in 2008 = 3% Homeownership rate reversing Concern: Rising unemployment affects demand
  • 5.
    Key Observations for2009 Multi-family capital markets remain fractured and expensive Investor demand tempered, motivated by anticipated discounts Revenue growth moderates but avoids historic cyclical decline magnitude in most markets Sales velocity remains low through at least the first half of 2009 Transactional cap rates continue to differentiate for quality and trend up 50 – 100 bps
  • 6.
    Market Divergence The apartment market has diverged into two distinct camps… Inherent long term investment value Short term transactional value
  • 7.
    Market Divergence Inherent long term investment value Construction starts are decreasing Future supply / demand favors appreciation Apartments remain a preferred investment Lack of suitable investment alternatives
  • 8.
    Market Divergence Short-term transactional value Debt and equity more expensive Investors fearful and conservative Unemployment is damaging fundamentals Expectation of discounted / distressed pricing
  • 9.
    Market Divergence Two distinct investment camps… Inherent long term investment value Short term transactional value Growing Amount of Distressed Loans / Assets
  • 10.
    Commercial Mortgage Delinquency Rates by Group Delinquency Rates Delinquency rates at the end of each period Sources: Marcus & Millichap Research Services, Mortgage Bankers Association
  • 11.
    Total CMBS Outstanding:$779.6 billion By Property Types ($Bil.): Office $237.8 Retail $230.0 Multi-Family $120.1 Hotel $73.3 Industrial $39.8 Self-Storage $14.0 Healthcare $4.7 Other $60.0 * As of 1Q09 Sources: Marcus & Millichap Research Services, MBA
  • 12.
    Total Multi-Family MortgageDebt Outstanding: $914.3 billion By Lender Types ($Bil): GSEs and Ginnie Mae $351.9 Commercial Banks $216.8 CMBS, CDO, and Other ABS $111.7 State & Local Governments $71.4 Savings Institutions $66.3 Life Insurance Companies $50.8 Other $45.5 * As of 2Q09 Sources: Marcus & Millichap Research Services, MBA
  • 13.
    Estimated Multi-Family DebtMaturities by Lender Type Billions $ Sources: Marcus & Millichap Research Services, Foresight Analytics
  • 14.
    Estimated Multi-Family Debt Maturities by Vintage Maturing Balance (Billions $) Sources: Marcus & Millichap Research Services, Foresight Analytics
  • 15.
    Distressed Loan /Asset Issues Loan sales vs. REO Asset Sales Portfolio vs. Individual Asset Sales Timing Complicated equity / debt “stacks” Liability issues Preservation of equity NPV vs. liquidity analysis
  • 16.
    Distressed Loan /Asset Issues Regulation / Documentation Issues Strategic differentiation for quality Improve management of asset Physically rehab the asset Could Special Asset Services provide seller-carried financing? Distressed assets controlled by private enterprises
  • 17.
    Anatomy of CurrentMarket Divergence Inherent vs. Short term value? Three issues… In what time frame do you have to act? What is your opinion of long term apartment investment fundamentals? Pricing / timing of distressed assets?
  • 18.
    Apartment Investment Trends Dollar Volume by Price Category Sources: Marcus & Millichap Research Services, CoStar Group, Inc., Real Capital Analytics $104 Billion $100 Billion $45 Billion * Excludes Archstone Privatization $87 Billion $27 Billion $9 Billion
  • 19.
    National Apartment Priceand Cap Rates * Through 2Q Includes sales $1Million and Greater Sources: Marcus & Millichap Research Services, Costar Group, Inc. Average Price per Unit (000s) Average Cap Rate
  • 20.
    Re-Pricing of Riskby Quality Reflected in Apartment Cap Rate Trends by Market Average Cap Rate Sales $5 million and greater Sources: Marcus & Millichap Research Services, Real Capital Analytics * Preliminary Estimate
  • 21.
    18 – MonthCap Rate Adjustment Matrix * Primary Secondary Tertiary Class “A” Class “B” Class “C” 1.25 1.50 1.75 1.50 1.75 2.25 2.25 2.75 2.00 * Change in cap rates last 18 months
  • 22.
    18 – MonthPricing Adjustment Matrix Primary Secondary Tertiary Class “A” Class “B” Class “C” -25% Base = 5.00 / 5.50 5.50 / 6.25 6.00 / 6.75 -29% -32% -27% -30% -36% -33% -35% -41%
  • 23.
    U.S. Apartment BuyerComposition Sales $5 Million and greater Sources: Marcus & Millichap Research Services, Real Capital Analytics * YTD through July Percent of Sales Volume
  • 24.
    U.S. Public REITValuation Indices vs. S&P 500 Index: December 1993 = 100 Sources: Marcus & Millichap Research Services, NAREIT, Standard and Poor’s Index (Dec. 1993 = 100) * Through September
  • 25.
    Key Observations for2010 Multi-family capital markets remain fractured and expensive Investor demand increases as economy begins recovery Revenue stabilizes Sales velocity increases 20% to 30% Transactional cap rates stabilize in core markets and trend up 50 bps elsewhere
  • 26.
    Marcus & Millichap’sNMHG Remains Bullish on U.S. Apartments Long-Term U.S. will experience a fundamental change in housing dynamics favoring the density, efficiency, flexibility and affordability of apartment living Population growth Changing demographics Environmental concerns Budget / expense factors Affordability Rent vs. own
  • 27.
    Population Dynamics U.S.population is expected to increase 33% by 2030 to 376 million. To accommodate this growth, the nation needs 60 million new housing units. Millions 94 Million
  • 28.
    Demographic Dynamics Marriedcouples with children are projected to decline to under 1 in 5 households by 2025 Singles and un-related individuals living together will comprise 1 in 3 households by 2020 78 million echo boomers are getting ready to enter their prime renting years 10 million legal immigrants will enter the country in next ten years
  • 29.
    7.4 Million NetNew Households 3.2 Million New Renter Households 4.1 Million New Owner Households * Forecast Sources: Marcus & Millichap Research Services, Economy.com, Harvard University U.S. Household Growth Projection 2010 - 2015*
  • 30.
    Environmental Dynamics Growingenvironmental awareness / concern favors compact development such as apartments Preserves green space Reduces amount of paved surfaces Reduces air pollution / need to drive ULI estimates we would save 85 million metric tons of carbon dioxide annually by 2030 if 60% of future growth is diverted to compact, walkable neighborhoods (apartments)
  • 31.
    Budget / FiscalDynamics Urban / suburban sprawl is expensive Compact development reduces infrastructure costs and saves money The U.S. can save over $100 billion in infrastructure costs over 25 years by growing compactly
  • 32.
    Affordability Dynamics 35million households spend 30 percent or more of their annual income on housing 114 million people live in households that did not earn enough to reasonably afford a two-bedroom apartment ($37,105 / $925) Fastest growing industries are those with lower-paying jobs
  • 33.
    Rent vs. OwnDynamics It costs $311 less a month on average to rent vs. own A $100 investment in housing in 1985 would be worth $270 today A $100 investment in stocks would be worth $722 today (+267%) Housing is shelter… not an investment
  • 34.
    Marcus & Millichap’sNMHG Remains Bullish on U.S. Apartments Long-Term Starts down Demand increasing Supply difficult and expensive to deliver Current rents do not justify development Housing “preference” beginning to shift Unlikely the industry will meet demand Significant future pressure on rents U.S. apartments will be dramatically more valuable in 2020 than 2010
  • 35.
    U.S Economic, CapitalMarkets and Apartment Market Overview and Outlook – Multi-Family Executive Conference
  • 36.
    Estimated Commercial DebtMaturities by Lender Type Billions $ Sources: Marcus & Millichap Research Services, Foresight Analytics
  • 37.
    Indicative Fannie MaeRates Sources: Marcus & Millichap Research Services, Federal Reserve Board
  • 38.
    Echo Boomer DemandSupports Appreciation * Forecast Sources: Marcus & Millichap Research Services, U.S. Census Bureau Change in Population Net Change: -2.1 Million -1.2 Million 1.8 Million 3.4 Million 3.2 Million 1.1 Million
  • 39.
    U.S. Apartment Constructionas a Percent of Beginning Inventory Construction as a Percent of Beg. Inventory * Forecast Sources: Marcus & Millichap Research Services, Reis
  • 40.
    U.S. Apartment InvestmentTrends Transactions by Price Total Transactions Excludes Archstone Privatization Sources: Marcus & Millichap Research Services, CoStar Group, Inc., Real Capital Analytics
  • 41.
    U.S. Apartment InvestmentTrends Dollar Volume by Price Total Dollar Volume (billions) Excludes Archstone Privatization Sources: Marcus & Millichap Research Services, CoStar Group, Inc., Real Capital Analytics
  • 42.
    Year-over-Year Change *Through August Sources: Marcus & Millichap Research Services, BOC, Federal Reserve Value of U.S. Dollar vs. Value of Exports

Editor's Notes

  • #24 Investment composition: Institutional : pension funds, insurance companies & banks User/Other : corporations, governmental and non-profit Syndicator : Tenancy-in-Common and Private REITs Fund : privately sponsored comingled opportunity/equity funds
  • #40 U.S. office construction as a percent of beginning inventory
  • #43 The price per barrel for crude oil continues to rise eroding consumers disposable income. As prices continue to rise, retail sales will be further reduced.