This document outlines three parts of a thesis show plan by Wendy at Penn State University:
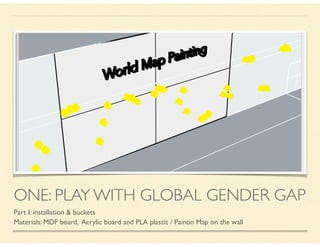
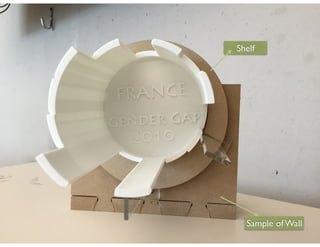
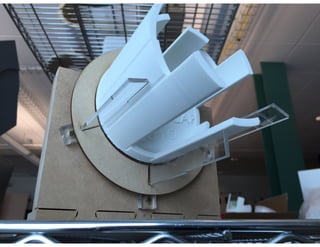
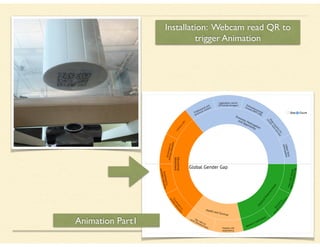
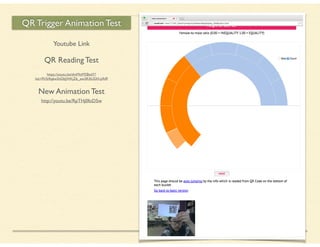
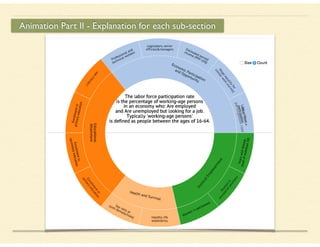
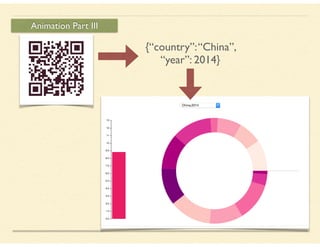
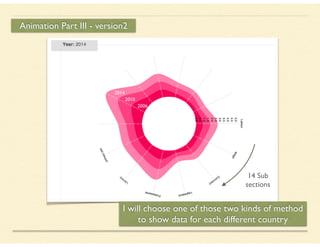
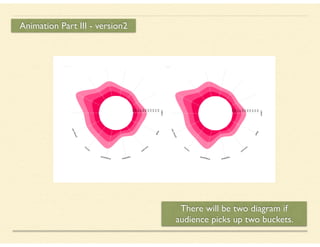
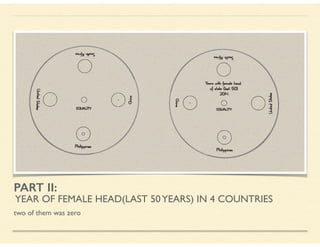
1. An animation installation using buckets, maps, and webcams to illustrate the global gender gap over time in 3 parts.
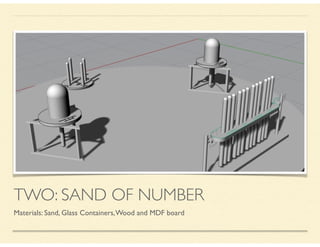
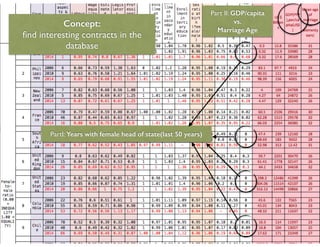
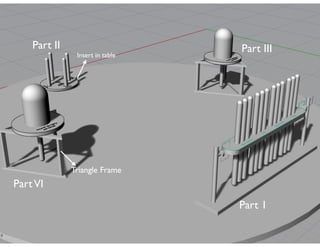
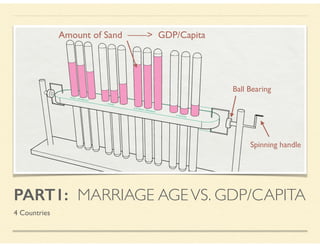
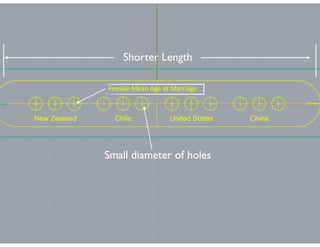
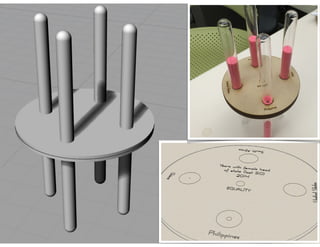
2. An interactive sand display using glass containers to show relationships between variables like marriage age and GDP for different countries.
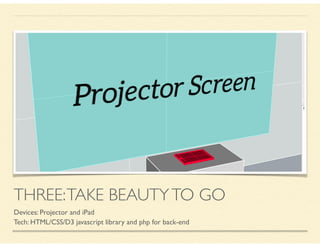
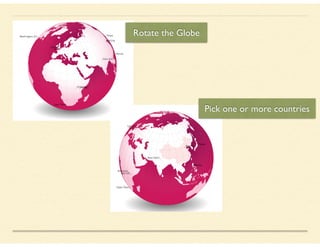
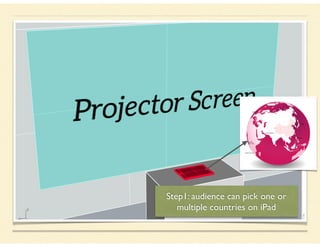
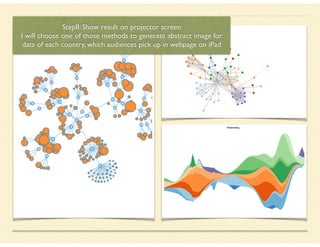
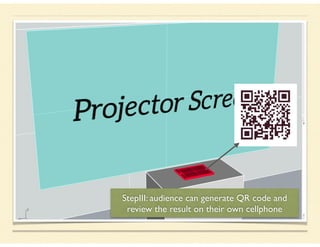
3. A mobile/projected data visualization allowing audiences to select countries on an iPad, view statistics on a projector, and generate QR codes to view abstract images of each country's data on their phone.