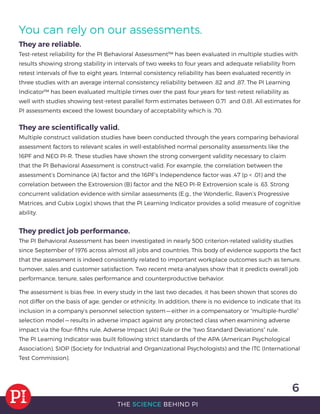
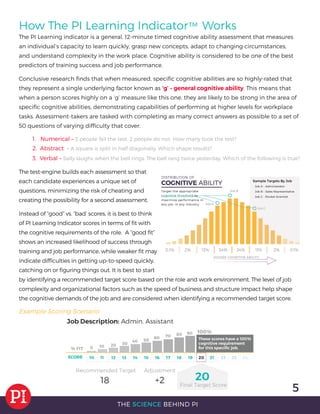
SlideShare a Scribd company logo
SCIENCEBEHIND THE PREDICTIVE INDEX®
THE
© 2015 The Predictive Index
How Our Revolutionary
Methodology Works Wonders
2
THE SCIENCE BEHIND PI
Built for Business
The Predictive Index®
, or PI®
, is a proven methodology that allows businesses to understand the
factors driving their workforce. Scientific validation and a 60-year proven track record shows that
business challenges large and small are no match for our unique approach to client education and
knowledge transfer, which ensures swift adoption, direct ROI, and high impact on performance
metrics.
We adhere to professional guidelines and government compliance.
Our assessments and recommended practices have been developed in a manner consistent with
all critical standards and guidelines. They were designed to provide a framework for determining
the proper use of assessments and other selection procedures, as well as preventing discriminatory
employment practices.
The Predictive Index assessments and recommended practices comply with:
•	 Equal Employment Opportunity Commission (EEOC)
•	 Uniform Guidelines for the Development and Use of Personnel Selection Procedures (1978)
•	 American Psychological Association (APA)
•	 Society for Industrial and Organizational Psychology (SIOP)
•	 International Test Commission (ITC)
It all started with our founder, the late Arnold S. Daniels.
Arnold S. Daniels, creator of the PI Behavioral Assessment and founder of The Predictive Index, was
introduced to assessments in the 1940’s while serving in the United States Army Air Corps. He was
a bombardier, navigator and gunnery officer. After flying over 30 missions before and after D-day,
Daniels was assigned to partner with a psychologist who had been tasked with understanding
the make-up of successful bombing teams. Daniels was introduced to the subject of tests and
measurements and this is where his obsession with psychometric testing began.
After his discharge, Daniels educated himself in the area of workplace psychology, while briefly
attending Harvard Business School and multiple management consulting firms. Solving business
challenges through the lens of people became Daniels’ sole mission in life. This led to the creation
and initial release of the first PI Behavioral Assessment in 1955.
During this time, The Predictive Index was used with thousands of clients and nearly 500 validation
studies in practically every job and industry in the known work universe. As the assessment gained
more use in business, it received continual updates and today represents a well-established,
business-relevant, and scientifically sound measure of behavioral tendencies in the workplace.
3
THE SCIENCE BEHIND PI
How The PI Behavioral Assessment™ Works
We focus on the person, not the population.
The Predictive Index Behavioral Assessment™ was created through a normative sample of thousands of
people. Data collected from this sample is used to identify a normal range of behavioral factor levels for
the adult working population (e.g., what is high, average, and low). Typically, benchmarked samples only
allow you to see how someone falls on a spectrum relative to others in the working population. While
the PI Behavioral Assessment leverages this benchmarking methodology, it also reaches beyond typical
people-to-people differences to provide a lens into people’s distinct drives and needs by a comparison of
behavioral factors.
For example, even though two people may have equal levels of dominance as compared to each
other, one person may have a high level of extraversion relative to their level of dominance while the
other is low in comparison. The relational difference between each person’s dominance level and
extraversion level represents a very different set of drives and needs, and these differences impact how
each individual will function at their best in the workplace. Unlike many assessments, The PI Behavioral
Assessment provides an especially advanced layer of insight and analysis.
The insight provided allows for a true understanding of what people need to function at their best
— what uniquely motivates, drives or even excites them — in comparison to the needs of others. This
allows the identification of what makes a candidate or employee “tick” before you manage them
and recognize the things that will keep them motivated and working toward your overall business
objectives.
All of our assessments are scientifically validated against
populations large enough to be used for any job, in any industry,
in any location worldwide.
4
THE SCIENCE BEHIND PI
Self Concept
How they believe they need to
adapt to their work environment.
Self
Native Drives — “What comes
naturally” in a person’s behavior.
Synthesis
How the person usually behaves in
the work environment.
Behavioral Drives
The PI Behavioral Assessment predicts four primary personality constructs (see below) and two
secondary constructs (Factors E — Decision Making, and M — Response Level). These are “normal”
(non-clinical) characteristics that describe, explain and predict day-to-day workplace behaviors.
Dominance
HIGH: Independent, assertive and self-confident
LOW: Agreeable, cooperative and accommodating
Extraversion
HIGH: Outgoing, persuasive and socially-poised
LOW: Serious, introspective and task-oriented
Patience
HIGH: Patient, consistent and deliberate
LOW: Fast-paced, urgent and intense
Formality
HIGH: Organized, precise and self-disciplined
LOW: informal, casual and uninhibited
The PI Behavioral Assessment provides two patterns of an individual’s workplace
behavior:
1. SELF
The Self pattern is a reflection of an individual’s natural drives and needs and how they will naturally
react in an environment or in situations.
2. SELF-CONCEPT
The Self-Concept pattern reflects how an individual may be adapting their natural behaviors to the
expectations of their current work environment.
Comparing the Self to the Self-Concept pattern can reveal tension or synergy between an individual
and their current workplace. This can be used to identify the root of observed behaviors and aid in
managing individuals through the hire-to-retire lifecycle.
5
THE SCIENCE BEHIND PI
How The PI Learning Indicator™ Works
The PI Learning indicator is a general, 12-minute timed cognitive ability assessment that measures
an individual’s capacity to learn quickly, grasp new concepts, adapt to changing circumstances,
and understand complexity in the work place. Cognitive ability is considered to be one of the best
predictors of training success and job performance.
Conclusive research finds that when measured, specific cognitive abilities are so highly-rated that
they represent a single underlying factor known as ‘g’ – general cognitive ability. This means that
when a person scores highly on a ‘g’ measure like this one, they are likely to be strong in the area of
specific cognitive abilities, demonstrating capabilities of performing at higher levels for workplace
tasks. Assessment-takers are tasked with completing as many correct answers as possible to a set of
50 questions of varying difficulty that cover:
1. Numerical – 3 people fail the test. 2 people do not. How many took the test?
2. Abstract - A square is split in half diagonally. Which shape results?
3. Verbal – Sally laughs when the bell rings. The bell rang twice yesterday. Which of the following is true?
The test-engine builds each assessment so that
each candidate experiences a unique set of
questions, minimizing the risk of cheating and
creating the possibility for a second assessment.
Instead of “good” vs. “bad’ scores, it is best to think
of PI Learning Indicator scores in terms of fit with
the cognitive requirements of the role. A “good fit”
shows an increased likelihood of success through
training and job performance, while weaker fit may
indicate difficulties in getting up-to-speed quickly,
catching on or figuring things out. It is best to start
by identifying a recommended target score based on the role and work environment. The level of job
complexity and organizational factors such as the speed of business and structure impact help shape
the cognitive demands of the job and are considered when identifying a recommended target score.
Example Scoring Scenario
6
THE SCIENCE BEHIND PI
You can rely on our assessments.
They are reliable.
Test-retest reliability for the PI Behavioral Assessment™ has been evaluated in multiple studies with
results showing strong stability in intervals of two weeks to four years and adequate reliability from
retest intervals of five to eight years. Internal consistency reliability has been evaluated recently in
three studies with an average internal consistency reliability between .82 and .87. The PI Learning
Indicator™ has been evaluated multiple times over the past four years for test-retest reliability as
well with studies showing test-retest parallel form estimates between 0.71 and 0.81. All estimates for
PI assessments exceed the lowest boundary of acceptability which is .70.
They are scientifically valid.
Multiple construct validation studies have been conducted through the years comparing behavioral
assessment factors to relevant scales in well-established normal personality assessments like the
16PF and NEO PI-R. These studies have shown the strong convergent validity necessary to claim
that the PI Behavioral Assessment is construct-valid. For example, the correlation between the
assessment’s Dominance (A) factor and the 16PF’s Independence factor was .47 (p < .01) and the
correlation between the Extroversion (B) factor and the NEO PI-R Extroversion scale is .63. Strong
concurrent validation evidence with similar assessments (E.g., the Wonderlic, Raven’s Progressive
Matrices, and Cubix Logix) shows that the PI Learning Indicator provides a solid measure of cognitive
ability.
They predict job performance.
The PI Behavioral Assessment has been investigated in nearly 500 criterion-related validity studies
since September of 1976 across almost all jobs and countries. This body of evidence supports the fact
that the assessment is indeed consistently related to important workplace outcomes such as tenure,
turnover, sales and customer satisfaction. Two recent meta-analyses show that it predicts overall job
performance, tenure, sales performance and counterproductive behavior.
The assessment is bias free. In every study in the last two decades, it has been shown that scores do
not differ on the basis of age, gender or ethnicity. In addition, there is no evidence to indicate that its
inclusion in a company’s personnel selection system — either in a compensatory or “multiple-hurdle”
selection model — results in adverse impact against any protected class when examining adverse
impact via the four-fifths rule, Adverse Impact (AI) Rule or the “two Standard Deviations” rule.
The PI Learning Indicator was built following strict standards of the APA (American Psychological
Association), SIOP (Society for Industrial and Organizational Psychologists) and the ITC (International
Test Commission).
When paired together, the PI Behavioral Assessment and Learning Indicator can increase your
chances of predicting on-the-job performance by eight times!
The experience is simple.
The PI Behavioral Assessment is a brief (6.5 minutes on average), untimed, free-choice (as opposed
to forced-choice) assessment that presents respondents with a list of adjectives and asks them to
identify which ones fit them and their current role. The assessment is available in multiple formats
(paper, online, mobile) in more than 70 languages, including English Braille.
The PI Learning Indicator determines a general measure of cognitive ability through the delivery of
a 12-minute timed assessment format that presents respondents the opportunity to respond to up
to 50 multiple choice questions. The score of the PI Learning Indicator is calculated simply by the
number of correct answers provided in the time allotted. The assessment is available online and can
be taken in more than 70 languages.
Our science gets better with age.
The Predictive Index Science team and its solutions have continuously evolved since 1955. PI
maintains a Science Advisory Board staffed with university professors, I/O psychologists, and other
subject matter experts in psychometrics. The board regularly reviews and evaluates our science and
methodology so we can continue to build on the well-established foundation and history that we
have, as well as our future.
Learn more about the science behind The Predictive Index here:
www.predictiveindex.com/science
© 2015 The Predictive Index

More Related Content

Similar to The Science Behind PI

Analyzing The Organizational Behavior Chart Elements
Analyzing The Organizational Behavior Chart ElementsAnalyzing The Organizational Behavior Chart Elements
Analyzing The Organizational Behavior Chart Elements
Allison Koehn
 
1st franklin financial assessment center
1st franklin financial assessment center 1st franklin financial assessment center
1st franklin financial assessment center
klovern
 
1st franklin financial assessment center
1st franklin financial assessment center1st franklin financial assessment center
1st franklin financial assessment center
klovern
 
Presentation CEBMa EBM Case example: Novartis
Presentation CEBMa EBM Case example: NovartisPresentation CEBMa EBM Case example: Novartis
Presentation CEBMa EBM Case example: Novartis
Center for Evidence-Based Management
 
Use of psychometric assessments in hrm
Use of psychometric assessments in hrmUse of psychometric assessments in hrm
Use of psychometric assessments in hrm
CerveauSys Strategic Consulting Pvt. Ltd.
 
Attitude and job satisfactio (Report)
Attitude and job satisfactio (Report)Attitude and job satisfactio (Report)
Attitude and job satisfactio (Report)
Indus University
 
Recruitment selection process,methods and steps
Recruitment selection process,methods and stepsRecruitment selection process,methods and steps
Recruitment selection process,methods and steps
Mayur Khatri
 
Assessment History Ii
Assessment History IiAssessment History Ii
Assessment History Ii
BSpitler
 
Behavioral competencies-at-work
Behavioral competencies-at-workBehavioral competencies-at-work
Behavioral competencies-at-work
Karthika Srinivasan
 
PI Behavioral Assessment Free from M.E.G. Roy
PI Behavioral Assessment Free from M.E.G. RoyPI Behavioral Assessment Free from M.E.G. Roy
PI Behavioral Assessment Free from M.E.G. Roy
ANNE PRYOR, MA
 
ORganisational Relation note chapter two
ORganisational Relation note chapter twoORganisational Relation note chapter two
ORganisational Relation note chapter two
Classic Tech
 
Recruitment Selection Process Methods And Steps
Recruitment Selection Process Methods And StepsRecruitment Selection Process Methods And Steps
Recruitment Selection Process Methods And Steps
Balakrisna
 
OVERALL JOB SATISFACTION
OVERALL JOB SATISFACTIONOVERALL JOB SATISFACTION
OVERALL JOB SATISFACTION
saikrishnabachuwar
 
Improved Selection, Reduced Turnover: Identify and Retain Top Talent
Improved Selection, Reduced Turnover: Identify and Retain Top TalentImproved Selection, Reduced Turnover: Identify and Retain Top Talent
Improved Selection, Reduced Turnover: Identify and Retain Top Talent
Zsuzsanna Vida
 
On Attitudes and Job Satisfaction
On Attitudes and Job SatisfactionOn Attitudes and Job Satisfaction
On Attitudes and Job Satisfaction
Gregar Donaven Valdehueza
 
Employer Work & Life Balance Policies and its impacty on Employee Performance
Employer Work & Life Balance Policies and its impacty on Employee PerformanceEmployer Work & Life Balance Policies and its impacty on Employee Performance
Employer Work & Life Balance Policies and its impacty on Employee Performance
Hussain Mumtaz
 
Physcology test - pratik negi
Physcology test  - pratik negiPhyscology test  - pratik negi
Physcology test - pratik negi
pratik negi
 
Lecture 2 motivation for friday 28 aug 2010
Lecture 2 motivation   for friday 28 aug 2010Lecture 2 motivation   for friday 28 aug 2010
Lecture 2 motivation for friday 28 aug 2010
khurram wasim khan
 
Lecture 2 motivation for friday 28 aug 2010
Lecture 2 motivation   for friday 28 aug 2010Lecture 2 motivation   for friday 28 aug 2010
Lecture 2 motivation for friday 28 aug 2010
khurram wasim khan
 
Recruitment selection-process-methods-and-steps-1207897252784197-9
Recruitment selection-process-methods-and-steps-1207897252784197-9Recruitment selection-process-methods-and-steps-1207897252784197-9
Recruitment selection-process-methods-and-steps-1207897252784197-9
Saleema Jasani
 

Similar to The Science Behind PI (20)

Analyzing The Organizational Behavior Chart Elements
Analyzing The Organizational Behavior Chart ElementsAnalyzing The Organizational Behavior Chart Elements
Analyzing The Organizational Behavior Chart Elements
 
1st franklin financial assessment center
1st franklin financial assessment center 1st franklin financial assessment center
1st franklin financial assessment center
 
1st franklin financial assessment center
1st franklin financial assessment center1st franklin financial assessment center
1st franklin financial assessment center
 
Presentation CEBMa EBM Case example: Novartis
Presentation CEBMa EBM Case example: NovartisPresentation CEBMa EBM Case example: Novartis
Presentation CEBMa EBM Case example: Novartis
 
Use of psychometric assessments in hrm
Use of psychometric assessments in hrmUse of psychometric assessments in hrm
Use of psychometric assessments in hrm
 
Attitude and job satisfactio (Report)
Attitude and job satisfactio (Report)Attitude and job satisfactio (Report)
Attitude and job satisfactio (Report)
 
Recruitment selection process,methods and steps
Recruitment selection process,methods and stepsRecruitment selection process,methods and steps
Recruitment selection process,methods and steps
 
Assessment History Ii
Assessment History IiAssessment History Ii
Assessment History Ii
 
Behavioral competencies-at-work
Behavioral competencies-at-workBehavioral competencies-at-work
Behavioral competencies-at-work
 
PI Behavioral Assessment Free from M.E.G. Roy
PI Behavioral Assessment Free from M.E.G. RoyPI Behavioral Assessment Free from M.E.G. Roy
PI Behavioral Assessment Free from M.E.G. Roy
 
ORganisational Relation note chapter two
ORganisational Relation note chapter twoORganisational Relation note chapter two
ORganisational Relation note chapter two
 
Recruitment Selection Process Methods And Steps
Recruitment Selection Process Methods And StepsRecruitment Selection Process Methods And Steps
Recruitment Selection Process Methods And Steps
 
OVERALL JOB SATISFACTION
OVERALL JOB SATISFACTIONOVERALL JOB SATISFACTION
OVERALL JOB SATISFACTION
 
Improved Selection, Reduced Turnover: Identify and Retain Top Talent
Improved Selection, Reduced Turnover: Identify and Retain Top TalentImproved Selection, Reduced Turnover: Identify and Retain Top Talent
Improved Selection, Reduced Turnover: Identify and Retain Top Talent
 
On Attitudes and Job Satisfaction
On Attitudes and Job SatisfactionOn Attitudes and Job Satisfaction
On Attitudes and Job Satisfaction
 
Employer Work & Life Balance Policies and its impacty on Employee Performance
Employer Work & Life Balance Policies and its impacty on Employee PerformanceEmployer Work & Life Balance Policies and its impacty on Employee Performance
Employer Work & Life Balance Policies and its impacty on Employee Performance
 
Physcology test - pratik negi
Physcology test  - pratik negiPhyscology test  - pratik negi
Physcology test - pratik negi
 
Lecture 2 motivation for friday 28 aug 2010
Lecture 2 motivation   for friday 28 aug 2010Lecture 2 motivation   for friday 28 aug 2010
Lecture 2 motivation for friday 28 aug 2010
 
Lecture 2 motivation for friday 28 aug 2010
Lecture 2 motivation   for friday 28 aug 2010Lecture 2 motivation   for friday 28 aug 2010
Lecture 2 motivation for friday 28 aug 2010
 
Recruitment selection-process-methods-and-steps-1207897252784197-9
Recruitment selection-process-methods-and-steps-1207897252784197-9Recruitment selection-process-methods-and-steps-1207897252784197-9
Recruitment selection-process-methods-and-steps-1207897252784197-9
 

Recently uploaded

一比一原版(Dalhousie毕业证书)达尔豪斯大学毕业证如何办理
一比一原版(Dalhousie毕业证书)达尔豪斯大学毕业证如何办理一比一原版(Dalhousie毕业证书)达尔豪斯大学毕业证如何办理
一比一原版(Dalhousie毕业证书)达尔豪斯大学毕业证如何办理
mzpolocfi
 
一比一原版(Chester毕业证书)切斯特大学毕业证如何办理
一比一原版(Chester毕业证书)切斯特大学毕业证如何办理一比一原版(Chester毕业证书)切斯特大学毕业证如何办理
一比一原版(Chester毕业证书)切斯特大学毕业证如何办理
74nqk8xf
 
一比一原版(UO毕业证)渥太华大学毕业证如何办理
一比一原版(UO毕业证)渥太华大学毕业证如何办理一比一原版(UO毕业证)渥太华大学毕业证如何办理
一比一原版(UO毕业证)渥太华大学毕业证如何办理
aqzctr7x
 
原版制作(Deakin毕业证书)迪肯大学毕业证学位证一模一样
原版制作(Deakin毕业证书)迪肯大学毕业证学位证一模一样原版制作(Deakin毕业证书)迪肯大学毕业证学位证一模一样
原版制作(Deakin毕业证书)迪肯大学毕业证学位证一模一样
u86oixdj
 
一比一原版(BCU毕业证书)伯明翰城市大学毕业证如何办理
一比一原版(BCU毕业证书)伯明翰城市大学毕业证如何办理一比一原版(BCU毕业证书)伯明翰城市大学毕业证如何办理
一比一原版(BCU毕业证书)伯明翰城市大学毕业证如何办理
dwreak4tg
 
一比一原版(UMN文凭证书)明尼苏达大学毕业证如何办理
一比一原版(UMN文凭证书)明尼苏达大学毕业证如何办理一比一原版(UMN文凭证书)明尼苏达大学毕业证如何办理
一比一原版(UMN文凭证书)明尼苏达大学毕业证如何办理
nyfuhyz
 
The Building Blocks of QuestDB, a Time Series Database
The Building Blocks of QuestDB, a Time Series DatabaseThe Building Blocks of QuestDB, a Time Series Database
The Building Blocks of QuestDB, a Time Series Database
javier ramirez
 
一比一原版(Adelaide毕业证书)阿德莱德大学毕业证如何办理
一比一原版(Adelaide毕业证书)阿德莱德大学毕业证如何办理一比一原版(Adelaide毕业证书)阿德莱德大学毕业证如何办理
一比一原版(Adelaide毕业证书)阿德莱德大学毕业证如何办理
slg6lamcq
 
一比一原版(Harvard毕业证书)哈佛大学毕业证如何办理
一比一原版(Harvard毕业证书)哈佛大学毕业证如何办理一比一原版(Harvard毕业证书)哈佛大学毕业证如何办理
一比一原版(Harvard毕业证书)哈佛大学毕业证如何办理
zsjl4mimo
 
STATATHON: Unleashing the Power of Statistics in a 48-Hour Knowledge Extravag...
STATATHON: Unleashing the Power of Statistics in a 48-Hour Knowledge Extravag...STATATHON: Unleashing the Power of Statistics in a 48-Hour Knowledge Extravag...
STATATHON: Unleashing the Power of Statistics in a 48-Hour Knowledge Extravag...
sameer shah
 
Global Situational Awareness of A.I. and where its headed
Global Situational Awareness of A.I. and where its headedGlobal Situational Awareness of A.I. and where its headed
Global Situational Awareness of A.I. and where its headed
vikram sood
 
原版制作(swinburne毕业证书)斯威本科技大学毕业证毕业完成信一模一样
原版制作(swinburne毕业证书)斯威本科技大学毕业证毕业完成信一模一样原版制作(swinburne毕业证书)斯威本科技大学毕业证毕业完成信一模一样
原版制作(swinburne毕业证书)斯威本科技大学毕业证毕业完成信一模一样
u86oixdj
 
University of New South Wales degree offer diploma Transcript
University of New South Wales degree offer diploma TranscriptUniversity of New South Wales degree offer diploma Transcript
University of New South Wales degree offer diploma Transcript
soxrziqu
 
一比一原版(UCSB文凭证书)圣芭芭拉分校毕业证如何办理
一比一原版(UCSB文凭证书)圣芭芭拉分校毕业证如何办理一比一原版(UCSB文凭证书)圣芭芭拉分校毕业证如何办理
一比一原版(UCSB文凭证书)圣芭芭拉分校毕业证如何办理
nuttdpt
 
Population Growth in Bataan: The effects of population growth around rural pl...
Population Growth in Bataan: The effects of population growth around rural pl...Population Growth in Bataan: The effects of population growth around rural pl...
Population Growth in Bataan: The effects of population growth around rural pl...
Bill641377
 
Learn SQL from basic queries to Advance queries
Learn SQL from basic queries to Advance queriesLearn SQL from basic queries to Advance queries
Learn SQL from basic queries to Advance queries
manishkhaire30
 
一比一原版(Coventry毕业证书)考文垂大学毕业证如何办理
一比一原版(Coventry毕业证书)考文垂大学毕业证如何办理一比一原版(Coventry毕业证书)考文垂大学毕业证如何办理
一比一原版(Coventry毕业证书)考文垂大学毕业证如何办理
74nqk8xf
 
一比一原版(UIUC毕业证)伊利诺伊大学|厄巴纳-香槟分校毕业证如何办理
一比一原版(UIUC毕业证)伊利诺伊大学|厄巴纳-香槟分校毕业证如何办理一比一原版(UIUC毕业证)伊利诺伊大学|厄巴纳-香槟分校毕业证如何办理
一比一原版(UIUC毕业证)伊利诺伊大学|厄巴纳-香槟分校毕业证如何办理
ahzuo
 
Predictably Improve Your B2B Tech Company's Performance by Leveraging Data
Predictably Improve Your B2B Tech Company's Performance by Leveraging DataPredictably Improve Your B2B Tech Company's Performance by Leveraging Data
Predictably Improve Your B2B Tech Company's Performance by Leveraging Data
Kiwi Creative
 
一比一原版(牛布毕业证书)牛津布鲁克斯大学毕业证如何办理
一比一原版(牛布毕业证书)牛津布鲁克斯大学毕业证如何办理一比一原版(牛布毕业证书)牛津布鲁克斯大学毕业证如何办理
一比一原版(牛布毕业证书)牛津布鲁克斯大学毕业证如何办理
74nqk8xf
 

Recently uploaded (20)

一比一原版(Dalhousie毕业证书)达尔豪斯大学毕业证如何办理
一比一原版(Dalhousie毕业证书)达尔豪斯大学毕业证如何办理一比一原版(Dalhousie毕业证书)达尔豪斯大学毕业证如何办理
一比一原版(Dalhousie毕业证书)达尔豪斯大学毕业证如何办理
 
一比一原版(Chester毕业证书)切斯特大学毕业证如何办理
一比一原版(Chester毕业证书)切斯特大学毕业证如何办理一比一原版(Chester毕业证书)切斯特大学毕业证如何办理
一比一原版(Chester毕业证书)切斯特大学毕业证如何办理
 
一比一原版(UO毕业证)渥太华大学毕业证如何办理
一比一原版(UO毕业证)渥太华大学毕业证如何办理一比一原版(UO毕业证)渥太华大学毕业证如何办理
一比一原版(UO毕业证)渥太华大学毕业证如何办理
 
原版制作(Deakin毕业证书)迪肯大学毕业证学位证一模一样
原版制作(Deakin毕业证书)迪肯大学毕业证学位证一模一样原版制作(Deakin毕业证书)迪肯大学毕业证学位证一模一样
原版制作(Deakin毕业证书)迪肯大学毕业证学位证一模一样
 
一比一原版(BCU毕业证书)伯明翰城市大学毕业证如何办理
一比一原版(BCU毕业证书)伯明翰城市大学毕业证如何办理一比一原版(BCU毕业证书)伯明翰城市大学毕业证如何办理
一比一原版(BCU毕业证书)伯明翰城市大学毕业证如何办理
 
一比一原版(UMN文凭证书)明尼苏达大学毕业证如何办理
一比一原版(UMN文凭证书)明尼苏达大学毕业证如何办理一比一原版(UMN文凭证书)明尼苏达大学毕业证如何办理
一比一原版(UMN文凭证书)明尼苏达大学毕业证如何办理
 
The Building Blocks of QuestDB, a Time Series Database
The Building Blocks of QuestDB, a Time Series DatabaseThe Building Blocks of QuestDB, a Time Series Database
The Building Blocks of QuestDB, a Time Series Database
 
一比一原版(Adelaide毕业证书)阿德莱德大学毕业证如何办理
一比一原版(Adelaide毕业证书)阿德莱德大学毕业证如何办理一比一原版(Adelaide毕业证书)阿德莱德大学毕业证如何办理
一比一原版(Adelaide毕业证书)阿德莱德大学毕业证如何办理
 
一比一原版(Harvard毕业证书)哈佛大学毕业证如何办理
一比一原版(Harvard毕业证书)哈佛大学毕业证如何办理一比一原版(Harvard毕业证书)哈佛大学毕业证如何办理
一比一原版(Harvard毕业证书)哈佛大学毕业证如何办理
 
STATATHON: Unleashing the Power of Statistics in a 48-Hour Knowledge Extravag...
STATATHON: Unleashing the Power of Statistics in a 48-Hour Knowledge Extravag...STATATHON: Unleashing the Power of Statistics in a 48-Hour Knowledge Extravag...
STATATHON: Unleashing the Power of Statistics in a 48-Hour Knowledge Extravag...
 
Global Situational Awareness of A.I. and where its headed
Global Situational Awareness of A.I. and where its headedGlobal Situational Awareness of A.I. and where its headed
Global Situational Awareness of A.I. and where its headed
 
原版制作(swinburne毕业证书)斯威本科技大学毕业证毕业完成信一模一样
原版制作(swinburne毕业证书)斯威本科技大学毕业证毕业完成信一模一样原版制作(swinburne毕业证书)斯威本科技大学毕业证毕业完成信一模一样
原版制作(swinburne毕业证书)斯威本科技大学毕业证毕业完成信一模一样
 
University of New South Wales degree offer diploma Transcript
University of New South Wales degree offer diploma TranscriptUniversity of New South Wales degree offer diploma Transcript
University of New South Wales degree offer diploma Transcript
 
一比一原版(UCSB文凭证书)圣芭芭拉分校毕业证如何办理
一比一原版(UCSB文凭证书)圣芭芭拉分校毕业证如何办理一比一原版(UCSB文凭证书)圣芭芭拉分校毕业证如何办理
一比一原版(UCSB文凭证书)圣芭芭拉分校毕业证如何办理
 
Population Growth in Bataan: The effects of population growth around rural pl...
Population Growth in Bataan: The effects of population growth around rural pl...Population Growth in Bataan: The effects of population growth around rural pl...
Population Growth in Bataan: The effects of population growth around rural pl...
 
Learn SQL from basic queries to Advance queries
Learn SQL from basic queries to Advance queriesLearn SQL from basic queries to Advance queries
Learn SQL from basic queries to Advance queries
 
一比一原版(Coventry毕业证书)考文垂大学毕业证如何办理
一比一原版(Coventry毕业证书)考文垂大学毕业证如何办理一比一原版(Coventry毕业证书)考文垂大学毕业证如何办理
一比一原版(Coventry毕业证书)考文垂大学毕业证如何办理
 
一比一原版(UIUC毕业证)伊利诺伊大学|厄巴纳-香槟分校毕业证如何办理
一比一原版(UIUC毕业证)伊利诺伊大学|厄巴纳-香槟分校毕业证如何办理一比一原版(UIUC毕业证)伊利诺伊大学|厄巴纳-香槟分校毕业证如何办理
一比一原版(UIUC毕业证)伊利诺伊大学|厄巴纳-香槟分校毕业证如何办理
 
Predictably Improve Your B2B Tech Company's Performance by Leveraging Data
Predictably Improve Your B2B Tech Company's Performance by Leveraging DataPredictably Improve Your B2B Tech Company's Performance by Leveraging Data
Predictably Improve Your B2B Tech Company's Performance by Leveraging Data
 
一比一原版(牛布毕业证书)牛津布鲁克斯大学毕业证如何办理
一比一原版(牛布毕业证书)牛津布鲁克斯大学毕业证如何办理一比一原版(牛布毕业证书)牛津布鲁克斯大学毕业证如何办理
一比一原版(牛布毕业证书)牛津布鲁克斯大学毕业证如何办理
 

The Science Behind PI

  • 1. SCIENCEBEHIND THE PREDICTIVE INDEX® THE © 2015 The Predictive Index How Our Revolutionary Methodology Works Wonders
  • 2. 2 THE SCIENCE BEHIND PI Built for Business The Predictive Index® , or PI® , is a proven methodology that allows businesses to understand the factors driving their workforce. Scientific validation and a 60-year proven track record shows that business challenges large and small are no match for our unique approach to client education and knowledge transfer, which ensures swift adoption, direct ROI, and high impact on performance metrics. We adhere to professional guidelines and government compliance. Our assessments and recommended practices have been developed in a manner consistent with all critical standards and guidelines. They were designed to provide a framework for determining the proper use of assessments and other selection procedures, as well as preventing discriminatory employment practices. The Predictive Index assessments and recommended practices comply with: • Equal Employment Opportunity Commission (EEOC) • Uniform Guidelines for the Development and Use of Personnel Selection Procedures (1978) • American Psychological Association (APA) • Society for Industrial and Organizational Psychology (SIOP) • International Test Commission (ITC) It all started with our founder, the late Arnold S. Daniels. Arnold S. Daniels, creator of the PI Behavioral Assessment and founder of The Predictive Index, was introduced to assessments in the 1940’s while serving in the United States Army Air Corps. He was a bombardier, navigator and gunnery officer. After flying over 30 missions before and after D-day, Daniels was assigned to partner with a psychologist who had been tasked with understanding the make-up of successful bombing teams. Daniels was introduced to the subject of tests and measurements and this is where his obsession with psychometric testing began. After his discharge, Daniels educated himself in the area of workplace psychology, while briefly attending Harvard Business School and multiple management consulting firms. Solving business challenges through the lens of people became Daniels’ sole mission in life. This led to the creation and initial release of the first PI Behavioral Assessment in 1955. During this time, The Predictive Index was used with thousands of clients and nearly 500 validation studies in practically every job and industry in the known work universe. As the assessment gained more use in business, it received continual updates and today represents a well-established, business-relevant, and scientifically sound measure of behavioral tendencies in the workplace.
  • 3. 3 THE SCIENCE BEHIND PI How The PI Behavioral Assessment™ Works We focus on the person, not the population. The Predictive Index Behavioral Assessment™ was created through a normative sample of thousands of people. Data collected from this sample is used to identify a normal range of behavioral factor levels for the adult working population (e.g., what is high, average, and low). Typically, benchmarked samples only allow you to see how someone falls on a spectrum relative to others in the working population. While the PI Behavioral Assessment leverages this benchmarking methodology, it also reaches beyond typical people-to-people differences to provide a lens into people’s distinct drives and needs by a comparison of behavioral factors. For example, even though two people may have equal levels of dominance as compared to each other, one person may have a high level of extraversion relative to their level of dominance while the other is low in comparison. The relational difference between each person’s dominance level and extraversion level represents a very different set of drives and needs, and these differences impact how each individual will function at their best in the workplace. Unlike many assessments, The PI Behavioral Assessment provides an especially advanced layer of insight and analysis. The insight provided allows for a true understanding of what people need to function at their best — what uniquely motivates, drives or even excites them — in comparison to the needs of others. This allows the identification of what makes a candidate or employee “tick” before you manage them and recognize the things that will keep them motivated and working toward your overall business objectives. All of our assessments are scientifically validated against populations large enough to be used for any job, in any industry, in any location worldwide.
  • 4. 4 THE SCIENCE BEHIND PI Self Concept How they believe they need to adapt to their work environment. Self Native Drives — “What comes naturally” in a person’s behavior. Synthesis How the person usually behaves in the work environment. Behavioral Drives The PI Behavioral Assessment predicts four primary personality constructs (see below) and two secondary constructs (Factors E — Decision Making, and M — Response Level). These are “normal” (non-clinical) characteristics that describe, explain and predict day-to-day workplace behaviors. Dominance HIGH: Independent, assertive and self-confident LOW: Agreeable, cooperative and accommodating Extraversion HIGH: Outgoing, persuasive and socially-poised LOW: Serious, introspective and task-oriented Patience HIGH: Patient, consistent and deliberate LOW: Fast-paced, urgent and intense Formality HIGH: Organized, precise and self-disciplined LOW: informal, casual and uninhibited The PI Behavioral Assessment provides two patterns of an individual’s workplace behavior: 1. SELF The Self pattern is a reflection of an individual’s natural drives and needs and how they will naturally react in an environment or in situations. 2. SELF-CONCEPT The Self-Concept pattern reflects how an individual may be adapting their natural behaviors to the expectations of their current work environment. Comparing the Self to the Self-Concept pattern can reveal tension or synergy between an individual and their current workplace. This can be used to identify the root of observed behaviors and aid in managing individuals through the hire-to-retire lifecycle.
  • 5. 5 THE SCIENCE BEHIND PI How The PI Learning Indicator™ Works The PI Learning indicator is a general, 12-minute timed cognitive ability assessment that measures an individual’s capacity to learn quickly, grasp new concepts, adapt to changing circumstances, and understand complexity in the work place. Cognitive ability is considered to be one of the best predictors of training success and job performance. Conclusive research finds that when measured, specific cognitive abilities are so highly-rated that they represent a single underlying factor known as ‘g’ – general cognitive ability. This means that when a person scores highly on a ‘g’ measure like this one, they are likely to be strong in the area of specific cognitive abilities, demonstrating capabilities of performing at higher levels for workplace tasks. Assessment-takers are tasked with completing as many correct answers as possible to a set of 50 questions of varying difficulty that cover: 1. Numerical – 3 people fail the test. 2 people do not. How many took the test? 2. Abstract - A square is split in half diagonally. Which shape results? 3. Verbal – Sally laughs when the bell rings. The bell rang twice yesterday. Which of the following is true? The test-engine builds each assessment so that each candidate experiences a unique set of questions, minimizing the risk of cheating and creating the possibility for a second assessment. Instead of “good” vs. “bad’ scores, it is best to think of PI Learning Indicator scores in terms of fit with the cognitive requirements of the role. A “good fit” shows an increased likelihood of success through training and job performance, while weaker fit may indicate difficulties in getting up-to-speed quickly, catching on or figuring things out. It is best to start by identifying a recommended target score based on the role and work environment. The level of job complexity and organizational factors such as the speed of business and structure impact help shape the cognitive demands of the job and are considered when identifying a recommended target score. Example Scoring Scenario
  • 6. 6 THE SCIENCE BEHIND PI You can rely on our assessments. They are reliable. Test-retest reliability for the PI Behavioral Assessment™ has been evaluated in multiple studies with results showing strong stability in intervals of two weeks to four years and adequate reliability from retest intervals of five to eight years. Internal consistency reliability has been evaluated recently in three studies with an average internal consistency reliability between .82 and .87. The PI Learning Indicator™ has been evaluated multiple times over the past four years for test-retest reliability as well with studies showing test-retest parallel form estimates between 0.71 and 0.81. All estimates for PI assessments exceed the lowest boundary of acceptability which is .70. They are scientifically valid. Multiple construct validation studies have been conducted through the years comparing behavioral assessment factors to relevant scales in well-established normal personality assessments like the 16PF and NEO PI-R. These studies have shown the strong convergent validity necessary to claim that the PI Behavioral Assessment is construct-valid. For example, the correlation between the assessment’s Dominance (A) factor and the 16PF’s Independence factor was .47 (p < .01) and the correlation between the Extroversion (B) factor and the NEO PI-R Extroversion scale is .63. Strong concurrent validation evidence with similar assessments (E.g., the Wonderlic, Raven’s Progressive Matrices, and Cubix Logix) shows that the PI Learning Indicator provides a solid measure of cognitive ability. They predict job performance. The PI Behavioral Assessment has been investigated in nearly 500 criterion-related validity studies since September of 1976 across almost all jobs and countries. This body of evidence supports the fact that the assessment is indeed consistently related to important workplace outcomes such as tenure, turnover, sales and customer satisfaction. Two recent meta-analyses show that it predicts overall job performance, tenure, sales performance and counterproductive behavior. The assessment is bias free. In every study in the last two decades, it has been shown that scores do not differ on the basis of age, gender or ethnicity. In addition, there is no evidence to indicate that its inclusion in a company’s personnel selection system — either in a compensatory or “multiple-hurdle” selection model — results in adverse impact against any protected class when examining adverse impact via the four-fifths rule, Adverse Impact (AI) Rule or the “two Standard Deviations” rule. The PI Learning Indicator was built following strict standards of the APA (American Psychological Association), SIOP (Society for Industrial and Organizational Psychologists) and the ITC (International Test Commission).
  • 7. When paired together, the PI Behavioral Assessment and Learning Indicator can increase your chances of predicting on-the-job performance by eight times! The experience is simple. The PI Behavioral Assessment is a brief (6.5 minutes on average), untimed, free-choice (as opposed to forced-choice) assessment that presents respondents with a list of adjectives and asks them to identify which ones fit them and their current role. The assessment is available in multiple formats (paper, online, mobile) in more than 70 languages, including English Braille. The PI Learning Indicator determines a general measure of cognitive ability through the delivery of a 12-minute timed assessment format that presents respondents the opportunity to respond to up to 50 multiple choice questions. The score of the PI Learning Indicator is calculated simply by the number of correct answers provided in the time allotted. The assessment is available online and can be taken in more than 70 languages. Our science gets better with age. The Predictive Index Science team and its solutions have continuously evolved since 1955. PI maintains a Science Advisory Board staffed with university professors, I/O psychologists, and other subject matter experts in psychometrics. The board regularly reviews and evaluates our science and methodology so we can continue to build on the well-established foundation and history that we have, as well as our future. Learn more about the science behind The Predictive Index here: www.predictiveindex.com/science © 2015 The Predictive Index