The Strategic Package
•
0 likes•268 views

The document provides an overview of waste plant development projects reported in May 2015. It includes statistics on the number and estimated value of new projects by facility type (e.g. incineration, anaerobic digestion) and feedstock type (e.g. municipal solid waste, wood). The largest number of new projects was for incineration plants, while municipal solid waste was the leading feedstock type by both number of projects and estimated value. Reported waste capacity and power generation from new projects is also summarized.

Recommended
More Related Content
What's hot
What's hot (20)
Similar to The Strategic Package
Similar to The Strategic Package (11)
More from Eric Wigart
More from Eric Wigart (8)
Recently uploaded
Recently uploaded (20)
The Strategic Package
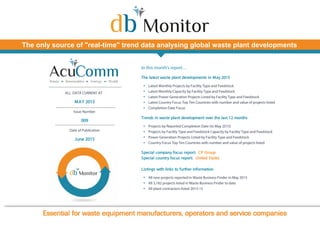
- 1. In this month's report… The latest waste plant developments in May 2015 • Latest Monthly Projects by Facility Type and Feedstock • Latest Monthly Capacity by Facility Type and Feedstock • Latest Power Generation Projects Listed by Facility Type and Feedstock • Latest Country Focus Top Ten Countries with number and value of projects listed • Completion Date Focus Trends in waste plant development over the last 12 months • Projects by Reported Completion Date (to May 2015) • Projects by Facility Type and Feedstock Capacity by Facility Type and Feedstock • Power Generation Projects Listed by Facility Type and Feedstock • Country Focus Top Ten Countries with number and value of projects listed Special company focus report: CP Group Special country focus report: United States Listings with links to further information • All new projects reported in Waste Business Finder in May 2015 • All 3,182 projects listed in Waste Business Finder to date • All plant contractors listed 2013-15 ALL DATA CURRENT AT MAY 2015 Issue Number 009 Date of Publication June 2015 The only source of "real-time" trend data analysing global waste plant developments
- 2. Contents Projects this month (May 2015) 1 Latest Monthly Capacity 5 Latest Power Generation 8 Latest Country Focus 11 Completion Date Focus 13 Latest Monthly Project Listings 14 Projects To Date 19 Waste Capacity 23 Power Generation 27 Country Focus 31 Company Focus: CP Group 33 National Market Focus: United States 37 Projects by feedstock type 38 Projects by waste capacity 39 Projects by MW generation 41 What are the likely timescales? 42 Full data by US state 43-44 Issue Number 009 Date of Publication June 2015 www.acucomm.net Explanatory Notes Welcome to db Monitor This publication provides an ongoing and comprehensive analysis of current projects in the global waste industry, enabling you to establish the level of activity in the different sectors of the waste industry around the world. The data is taken from AcuComm’s Waste Business Finder database. This is a database of projects compiled and maintained by us on a daily basis. The information in it – and therefore in db Monitor– is not readily available from any other source. db Monitor is organised in the following sections: The first section examines new projects reported in the latest month. It looks at the overall number and value of these, and then divides them in two ways. Firstly, each project is allocated a principal facility type, such as anaerobic digestion, gasification plant or WtE incineration plant. Secondly, each project is allocated a principal feedstock type, such as municipal solid waste, plant biomass or food for example. Then, the waste capacity and power generation capacity of each project is examined. Finally, we look at which countries are most active, and when projects are reported as being likely to complete. The second section presents data in a similar manner to the first, but looks at the entire database held by AcuComm, dating back to January 2013. The third section presents a snapshot of a single company active in the waste area, and looks at what projects it is involved with. The third section lists all the new projects for the reported month. The table gives summary data, but to gain the full information on an individual entry, just click the Business Finder web link on the right hand side of the page. The final section focuses on a particular technical or national area of the market, providing more detailed information on the projects and technologies involved. This section will look at a different area each issue. I hope db Monitor is useful to you. If you have any questions or queries, or if you have a project which you would like to see included in our Waste Business Finder database – free of charge – then please do get in touch Andy Crofts Editor & Chief Analyst andy.crofts@ acucomm.net
- 3. Projects This Month: May 2015 Overview Issue Number 009 Date of Publication June 2015 Each new waste project represents on- going investment of an average of around US$100 million. 99 118 131 136 85 102 99 117 114 141 133 118 120 110 117 123 105 103 102 112 103 108 109 92 78 82 102 84 91 0 20 40 60 80 100 120 140 160 Number of Projects by Month The total estimated value of these projects is US$10,664 million. This takes the total estimated value of projects reported since June 2014 to US$122,100 million. The average estimated value of a waste project over this period is US$105 million. 16,785 16,243 21,489 25,803 9,515 11,638 10,039 13,627 28,605 24,717 13,225 8,829 11,667 11,026 14,299 13,549 13,011 9,209 10,973 10,231 7,898 13,124 13,702 10,278 7,707 7,645 11,805 8,865 10,664 0 5,000 10,000 15,000 20,000 25,000 30,000 Jan-13 Feb-13 Mar-13 Apr-13 May-13 Jun-13 Jul-13 Aug-13 Sep-13 Oct-13 Nov-13 Dec-13 Jan-14 Feb-14 Mar-14 Apr-14 May-14 Jun-14 Jul-14 Aug-14 Sep-14 Oct-14 Nov-14 Dec-14 Jan-15 Feb-15 Mar-15 Apr-15 May-15 Estimated Total Value of Projects (US$m) AcuComm reported on 91 new waste projects in May 2015. This takes the annual number (since June 2014) to 1,166, and the total overall since January 2013 to 3,134. Incineration with energy recovery projects form the largest number in May 2015, accounting for 32, or 35.2% of the total. This was followed by AD projects (15 projects, or 16.5%) and recycling/waste processing (9 projects each, or 9.9%.) Incineration with energy recovery is also the leading facility type by estimated value, at US$3,096 million, or 29.0% of the total. This was followed by waste processing with US$1,216 million, or 11.4% of the total, and integrated facilities with US$864 million, or 8.1%.
- 4. Quarterly Project Data Comparison Key Indicators for March 2015 to May 2015 Mar-15 Apr-15 May-15 Quarterly Total Number of projects 102 84 91 277 Total estimated value (US$ millions) 11,805 8,865 10,664 31,334 Average value (US$ millions) 116 106 117 113 Reported waste capacity (tonnes) 4,597,238 6,875,714 3,338,916 14,811,868 Average annual capacity per project (tonnes) 112,128 202,227 90,241 132,249 Reported power generation (MW) 1,418 937 392 2,747 Average MW per project 37 47 15 32 Issue Number 009 Date of Publication June 2015 Mar-15 Apr-15 May-15 0 20 40 60 80 100 120 Projects by Number and Estimated US$ Value This page compares data on projects reported in the current month, compared with the previous two months. This provides a comparison of the most recent data, and also a quarterly total. This size of the circles in the bottom left graph represent the total estimated project values, as reported in the table on this page. 112,128 202,227 90,241 0 100,000 200,000 300,000 Mar-15 Apr-15 May-15 Average annual capacity per project (tonnes) 37 47 15 0 10 20 30 40 50 Mar-15 Apr-15 May-15 Average MW per project
- 5. Latest Monthly Projects by Facility Type (May 2015) Latest Monthly Projects by Facility Type % of Total (May 2015) Projects With Value (US$m) Reported Value Total Estimated Value Average value % of Total Projects % of Total Estimated Value Anaerobic Digestion 15 5 44 676 45 Anaerobic Digestion 16.5 6.3 Biofuel 4 1 12 443 111 Biofuel 4.4 4.2 Biogas 1 1 3 3 3 Biogas 1.1 0.0 Gasification 4 2 3 353 88 Gasification 4.4 3.3 Incineration (energy recovery) 32 15 791 3,096 97 Incineration (energy recovery) 35.2 29.0 Incineration (no energy recovery) 0 0 0 0 - Incineration (no energy recovery) 0.0 0.0 Integrated Facilities (IWMF) 4 0 0 864 216 Integrated Facilities (IWMF) 4.4 8.1 Landfill 8 4 41 835 104 Landfill 8.8 7.8 MBT 0 0 0 0 - MBT 0.0 0.0 Recycling 9 4 94 576 64 Recycling 9.9 5.4 Waste Processing 9 5 77 1,216 135 Waste Processing 9.9 11.4 Others 5 0 0 2,601 520 Others 5.5 24.4 Total 91 37 1,066 10,664 117 Total 100.0 100.0 Issue Number 009 Date of Publication June 2015 216 135 111 104 97 88 64 45 3 0 50 100 150 200 250 Average Value of Projects, May 2015 (US$m) 0% 20% 40% 60% 80% 100% % of Total Projects % of Total Estimated Value Projects By Facility Type, May 2015 Others Landfill Recycling Recycling Anaerobic Digestion Incineration (energy recovery)
- 6. Latest Monthly Projects by Feedstock Type (May 2015) Latest Monthly Projects by Feedstock Type (% of Total) Projects With Value (US$m) Reported Value (US$m) Total Estimated Value Average value (US$m) % of Total Projects % of Total Estimated Value Animal 7 3 4 158 23 Animal 7.7 1.5 Clinical 0 0 0 0 - Clinical 0.0 0.0 Construction/Demolition 1 1 5 5 5 Construction/Demolition 1.1 0.0 e-Waste 1 1 71 71 71 e-Waste 1.1 0.7 Food 2 0 0 43 21 Food 2.2 0.4 Gas 7 2 24 2,378 340 Gas 7.7 22.3 Glass 0 0 0 0 - Glass 0.0 0.0 Hazardous 1 0 0 216 216 Hazardous 1.1 2.0 Heat 0 0 0 0 - Heat 0.0 0.0 Industrial 3 1 12 298 99 Industrial 3.3 2.8 Metals 0 0 0 0 - Metals 0.0 0.0 MSW 32 12 707 3,448 108 MSW 35.2 32.3 Oil 1 1 37 37 37 Oil 1.1 0.4 Organic (general/unspecified) 5 2 14 428 86 Organic (general/unspecified) 5.5 4.0 Paper 0 0 0 0 - Paper 0.0 0.0 Plant Biomass (non-waste) 1 0 0 144 144 Plant Biomass (non-waste) 1.1 1.3 Plant Biomass (waste) 6 1 1 1,347 225 Plant Biomass (waste) 6.6 12.6 Plastics 4 2 17 115 29 Plastics 4.4 1.1 Radioactive 1 0 0 901 901 Radioactive 1.1 8.4 Rubber 0 0 0 0 - Rubber 0.0 0.0 Sewage/wastewater 4 3 43 84 21 Sewage/wastewater 4.4 0.8 Wood 15 8 129 989 66 Wood 16.5 9.3 Other 0 0 0 0 - Other 0.0 0.0 Total 91 37 1,066 10,664 117 Total 100.0 100.0 Issue Number 009 Date of Publication June 2015 In terms of waste feedstock type, municipal solid waste (MSW) was the leading category in May 2015. MSW accounted for 32 projects (35.2% of the total) with an estimated value of US$3,448 million (32.3% of the total). Wood and other biomass were the other principal feedstocks in May 2015. Wood accounted for 15 projects, with an estimated value of US$989 million, while other plant biomass accounted for 6 projects, equal to US$1,347 million.
- 7. Issue Number 009 Date of Publication June 2015 0% 10% 20% 30% 40% 50% 60% 70% 80% 90% 100% % of Total Projects % of Total Estimated Value Projects By Feedstock Type, May 2015 Others Plant Biomass (waste) Animal Animal Wood MSW Wood and other biomass-based feedstocks account for around one third of all new investment in waste technologies, reflecting a move away from traditional power generation in many countries.
- 8. Latest Monthly Capacity Reported Waste Capacity of Projects Listed by Facility Type Reported Capacity by Facility Type, % of Total (May 2015) (May 2015) Projects With Reported Capacity Reported Annual Capacity (tonnes) Average Annual Capacity (tonnes) Average Tonnes Per Day % of Total Reported Capacity Anaerobic Digestion 15 7 652,791 93,256 291 Anaerobic Digestion 19.6 Biofuel 4 1 35,000 35,000 109 Biofuel 1.0 Biogas 1 0 0 - - Biogas 0.0 Gasification 4 1 4,000 4,000 13 Gasification 0.1 Incineration (energy recovery) 32 12 1,793,555 149,463 467 Incineration (energy recovery) 53.7 Incineration (no energy recovery) 0 0 0 - - Incineration (no energy recovery) 0.0 Integrated Facilities (IWMF) 4 3 346,000 115,333 360 Integrated Facilities (IWMF) 10.4 Landfill 8 0 0 - - Landfill 0.0 MBT 0 0 0 - - MBT 0.0 Recycling 9 6 235,845 39,308 123 Recycling 7.1 Waste Processing 9 4 221,725 55,431 173 Waste Processing 6.6 Others 5 1 50,000 50,000 156 Others 1.5 Total 91 35 3,338,916 95,398 298 Total 100.0 Issue Number 009 Date of Publication June 2015 Of the 91 projects listed in May 2015, 35 also reported an annual waste capacity. This amounted to 3.3 million tonnes, equal to an average of 95,398 tonnes per project, and an average of 298 tonnes per day per project. WtE incineration was the largest facility type in terms of capacity, amounting to 1.8 million tonnes, or 53.7% of the total. This was followed by anaerobic digestion with 0.6 million tonnes (19.6%) and integrated facilities with just under 0.4 million tonnes (10.4%). WtE incineration projects represented over 53% of reported new or planned waste project capacity in May 2015.
- 9. Latest Monthly Projects by Feedstock Type (May 2015) Projects With Reported Capacity Annual Capacity (tonnes) Average Annual Capacity (tonnes) Average Tonnes Per Day Animal 7 2 39,347 19,674 61 Clinical 0 0 0 - - Construction/Demolition 1 0 0 - - e-Waste 1 1 30,000 30,000 94 Food 2 2 42,444 21,222 66 Gas 7 0 0 - - Glass 0 0 0 - - Hazardous 1 1 151,000 151,000 472 Heat 0 0 0 - - Industrial 3 0 0 - - Metals 0 0 0 - - MSW 32 18 2,337,900 129,883 406 Oil 1 0 0 - - Organic (general/unspecified) 5 1 35,000 35,000 109 Paper 0 0 0 - - Plant Biomass (non-waste) 1 0 0 - - Plant Biomass (waste) 6 4 598,000 149,500 467 Plastics 4 3 63,725 21,242 66 Radioactive 1 0 0 - - Rubber 0 0 0 - - Sewage/wastewater 4 1 27,000 27,000 84 Wood 15 2 14,500 7,250 23 Other 0 0 0 - - Total 91 35 3,338,916 95,398 298 Issue Number 009 Date of Publication June 2015 Incineration (energy recovery) 53.7% Anaerobic Digestion 19.6% Integrated Facilities (IWMF) 10.4% Recycling 7.1% Waste Processing 6.6% Others 2.7% % Capacity by Facility Type, May 2015 Municipal solid waste accounted for 2.3 million tonnes of capacity in May 2015, equal to 70.0% of the total, and an average of 406 tonnes per project per day. The other major feedstock category was plant biomass, which accounted for just under 0.6 million tonnes or 17.9% of the total. China remains a leading investor in waste, with a major new WtE plant becoming operational in Shanghai, as reported in May 2015.
- 10. Reported Capacity by Feedstock, % of Total (May 2015) Capacity as % of Total Animal 1.2 Clinical - Construction/Demolition - e-Waste 0.9 Food 1.3 Gas - Glass - Hazardous 4.5 Heat - Industrial - Metals - MSW 70.0 Oil - Organic (general/unspecified) 1.0 Paper - Plant Biomass (non-waste) - Plant Biomass (waste) 17.9 Plastics 1.9 Radioactive - Rubber - Sewage/wastewater 0.8 Wood 0.4 Other - Total 100.0 Issue Number 009 Date of Publication June 2015 MSW 70.0% Plant Biomass (waste) 17.9% Hazardous 4.5% Others 7.5% % Capacity by Feedstock, May 2015 Municipal Solid Waste accounted for 70.0% of waste capacity in projects covered in the Business Finder database in May 2015.
- 11. Latest Power Generation Reported Power Generation of Projects Listed by Facility Type Latest Reported Power Generation by Facility (May 2015) Type, % of Total (May 2015) Projects With Reported MW Generation Reported Annual MW Generation Average MW Generation % of Total Projects Anaerobic Digestion 15 4 15 4 Anaerobic Digestion 3.7 Biofuel 4 0 0 - Biofuel - Biogas 1 0 0 - Biogas - Gasification 4 3 15 5 Gasification 3.7 Incineration (energy recovery) 32 17 297 17 Incineration (energy recovery) 75.9 Incineration (no energy recovery) 0 0 0 - Incineration (no energy recovery) - Integrated Facilities (IWMF) 4 0 0 - Integrated Facilities (IWMF) - Landfill 8 1 1 1 Landfill 0.1 MBT 0 0 0 - MBT - Recycling 9 0 0 - Recycling - Waste Processing 9 0 0 - Waste Processing - Others 5 2 65 32 Others 16.5 Total 91 27 392 15 Total 100.0 Issue Number 009 Date of Publication June 2015 In May 2015, an estimate of annual power generation was available for 27 projects. This amounted to 392 MW in total. Three quarters of this was from WtE incineration with most of the remainder coming from gasification or anaerobic digestion. Incineration amounted to 17 projects with total reported generation of 297 MW, equal to 17 MW per plant. The most significant projects were a 90 MW biomass plant in Lithuania, a planned 50 MW biomass plant in Brazil, and a recently -operational 40 MW WtE plant in Shanghai, China. WtE incineration continued to dominate the reported power generation of projects in May 2015.
- 12. Latest Reported Power Generation of Projects Listed by Feedstock Type (May 2015) Projects With Reported MW Generation Reported Annual MW Generation Average MW Generation Animal 7 2 2 1 Clinical 0 0 0 - Construction/Demolition 1 0 0 - e-Waste 1 0 0 - Food 2 0 0 - Gas 7 4 85 21 Glass 0 0 0 - Hazardous 1 0 0 - Heat 0 0 0 - Industrial 3 1 11 11 Metals 0 0 0 - MSW 32 6 64 11 Oil 1 0 0 - Organic (general/unspecified) 5 1 2 2 Paper 0 0 0 - Plant Biomass (non-waste) 1 0 0 - Plant Biomass (waste) 6 3 25 8 Plastics 4 0 0 - Radioactive 1 0 0 - Rubber 0 0 0 - Sewage/wastewater 4 0 0 - Wood 15 10 203 20 Other 0 0 0 - Total 91 27 392 15 Issue Number 009 Date of Publication June 2015 In May 2015, just over half of power generation was through wood - fuelled facilities, amounting to 203 MW in total and 20 per reporting project. This was followed by gas with 85 MW, equal to 21.8% of the total and an average of 21 MW per reporting project. MSW accounted for 64 MW, equal to 16.3% of the total and 11 MW per reporting project. Incineration (energy recovery) 75.9% Others 16.5% Gasification 3.7% Others 3.8% % MW Generation by Facility Type, May 2015
- 13. Latest Reported Power Generation by Feedstock Type, % of Total (May 2015) MW Generation as % of Total Animal 0.5 Clinical - Construction/Demolition - e-Waste - Food - Gas 21.8 Glass - Hazardous - Heat - Industrial 2.8 Metals - MSW 16.3 Oil - Organic (general/unspecified) 0.5 Paper - Plant Biomass (non-waste) - Plant Biomass (waste) 6.3 Plastics - Radioactive - Rubber - Sewage/wastewater - Wood 51.8 Other - Total 100.0 Issue Number 009 Date of Publication June 2015 Wood-based materials - whether waste products or grown specially - are increasingly being used as a fuel for providing domestic power for heat and light. Wood 51.8% Gas 21.8% MSW 16.3% Plant Biomass (waste) 6.3% Others 3.8% % MW Generation by Feedstock Type, May 2015
- 14. Latest Country Focus Top Ten Countries (number of projects listed), Top Ten Countries (value of projects listed), May 2015 May 2015 Projects % of Total US$ millions % of Total USA 23 25.3 Japan 310 29.1 UK 7 7.7 Poland 279 26.2 Japan 5 5.5 Hong Kong 89 8.3 India 5 5.5 Norway 74 6.9 Switzerland 3 3.3 Switzerland 66 6.2 Poland 3 3.3 Croatia 44 4.1 Bulgaria 3 3.3 USA 39 3.6 France 3 3.3 Spain 37 3.5 Sweden 2 2.2 Serbia 32 3.0 Mexico 2 2.2 Lithuania 22 2.1 Subtotal 56 61.5 Subtotal 993 93.2 Others 35 38.5 Others 73 6.8 Total 91 100.0 Total 1,066 100.0 Issue Number 009 Date of Publication June 2015 The USA was the leading country in terms of projects reported in May 2015, with 23, equal to 25.3% of the total. This was followed by the UK with seven and Japan/India with five apiece. In terms of reported value, Japan was the leader, with US$310 million or 29.1% of the total. This was followed by Poland with US$279 million or 26.2%, and Hong Kong with US$89 million or 8.3%. Significant waste investments occur not only in developed markets, but across the developing world.
- 15. Issue Number 009 Date of Publication June 2015 USA 25.3% UK 7.7% Japan 5.5% India 5.5% Switzerland 3.3% Poland 3.3% Others 49.5% Leading Countries, Number of Projects, May 2015 Japan 29.1% Poland 26.2% Hong Kong 8.3% Norway 6.9% Switzerland 6.2% Croatia 4.1% Others 19.1% Leading Countries, Value of Projects, May 2015
- 16. Completion Date Focus Projects by Reported Completion Date (May 2015) Number of Projects Value (US$ millions) Q1 2014 0 - Q2 2014 0 - Q3 2014 0 - Q4 2014 0 - Q1 2015 5 - Q2 2015 17 264.3 Q3 2015 1 - Q4 2015 8 15.0 Q1 2016 1 2.0 Q2 2016 4 22.8 Q3 2016 1 7.5 Q4 2016 2 - Q1 2017 1 73.9 Q2 2017 2 2.4 Q3 2017 1 1.5 Q4 2017 0 - 2018+ 5 82.8 Issue Number 009 Date of Publication June 2015 Of the 91 projects reported on in May 2015, 48 give an indication of their likely completion date. There are 31 projects due to complete by the end of 2015, with a combined reported value of US$279.3 million. A further eight projects are due to complete during 2016, and a further nine in 2017 or beyond. Once work starts, the average project takes around 18 months to become operational. Most, however have on-going operational requirements for much longer. 0 31 8 4 5 0 5 10 15 20 25 30 35 2014 2015 2016 2017 2018+ Projects By Reported Year of Completion 0.0 279.3 32.3 77.8 82.8 0 50 100 150 200 250 300 2014 2015 2016 2017 2018+ Values By Reported Year of Completion (US$m)
- 17. Latest Monthly Project Listings, May 2015 Country Summary Link Argentina Construction of an AD plant utilising meat industry waste. http://www.acucomm.net/business-finder/3192 Australia Development of new landfill cell. http://www.acucomm.net/business-finder/3241 Bahamas Development of a gasification power plant. http://www.acucomm.net/business-finder/3231 Belarus Construction of a landfill, sorting facility and composting facility. http://www.acucomm.net/business-finder/3177 Brazil Construction of a 50 MW biomass plant. http://www.acucomm.net/business-finder/3220 Bulgaria Construction of a straw-fed AD plant. http://www.acucomm.net/business-finder/3181 Bulgaria Construction of an AD plant at a brewery. http://www.acucomm.net/business-finder/3228 Bulgaria Construction of a 516,000 tonne capacity landfill. http://www.acucomm.net/business-finder/3248 Canada Construction of a 200 tpd pellet plant. http://www.acucomm.net/business-finder/3204 China Auxiliary boiler required for WtE facility. http://www.acucomm.net/business-finder/3172 China Construction of a 40 MW WtE facility. http://www.acucomm.net/business-finder/3180 Croatia Construction of a 2.8 MW cogeneration biomass plant. http://www.acucomm.net/business-finder/3179 Croatia Development of an AD plant and sludge dehydration system. http://www.acucomm.net/business-finder/3184 Czech Republic Proposed enlargement of a landfill. http://www.acucomm.net/business-finder/3171 Denmark Completion of a straw-fired biomass plant. http://www.acucomm.net/business-finder/3187 Denmark Construction of an 11 MW AD plant. http://www.acucomm.net/business-finder/3211 Estonia Construction of 18 MW biomass plant for plywood factory. http://www.acucomm.net/business-finder/3233 Finland Construction of a 5 MW biomass plant. http://www.acucomm.net/business-finder/3200 Finland Installation of a 20 MWth waste gas-fed boiler. http://www.acucomm.net/business-finder/3227 France Construction of a 1.3 MW district heating biomass plant. http://www.acucomm.net/business-finder/3209 France Development of a sugar beet-to-isobutene facility. http://www.acucomm.net/business-finder/3221 France Completion of a 4.2 MW biomass plant. http://www.acucomm.net/business-finder/3251 Germany Inauguration of a €10 million waste-to-energy plant. http://www.acucomm.net/business-finder/3174 Germany Rehabilitatation of a waste digestion plant. http://www.acucomm.net/business-finder/3250 Greece Construction of a 1 MW AD plant at meat processing factory. http://www.acucomm.net/business-finder/3212 Hong Kong Refurbishment and upgrading of a waste transfer station. http://www.acucomm.net/business-finder/3167 Hong Kong Construction of an e-waste recycling facility. http://www.acucomm.net/business-finder/3210 Issue Number 009 Date of Publication June 2015
- 18. Latest Monthly Project Listings, May 2015 (cont.) Country Summary Link India Construction of an AD plant at an abattoir. http://www.acucomm.net/business-finder/3203 India Waste plastics processing unit. http://www.acucomm.net/business-finder/3243 India Poultry waste management plant. http://www.acucomm.net/business-finder/3246 India Construction of a pyrolysis oil plant. http://www.acucomm.net/business-finder/3247 India Development of an 8 MW WtE facility. http://www.acucomm.net/business-finder/3252 Japan Construction of a 1.4 MW WtE facility. http://www.acucomm.net/business-finder/3176 Japan Completion of a WtE facility. http://www.acucomm.net/business-finder/3189 Japan Construction of a 360 tpd WtE facility. http://www.acucomm.net/business-finder/3213 Japan WtE facility improvement works. http://www.acucomm.net/business-finder/3229 Japan WtE facility improvement works. http://www.acucomm.net/business-finder/3230 Lithuania Installation of a biogas microturbine. http://www.acucomm.net/business-finder/3190 Lithuania Opening of a biomass boiler plant. http://www.acucomm.net/business-finder/3207 Mexico Installation of an anaerobic digester. http://www.acucomm.net/business-finder/3194 Mexico Construction of a pilot biomass/fuel cell cogeneration project. http://www.acucomm.net/business-finder/3245 Norway Construction of a waste-fuelled energy plant. http://www.acucomm.net/business-finder/3191 Oman Proposed development of Oman’s first WtE facility. http://www.acucomm.net/business-finder/3186 Oman Construction of an industrial hazardous waste treatment facility. http://www.acucomm.net/business-finder/3199 Philippines Improvements to materials recovery facility. http://www.acucomm.net/business-finder/3234 Poland Construction of an MBT facility. http://www.acucomm.net/business-finder/3183 Poland Construction of a 100,000 tpa WtE facility. http://www.acucomm.net/business-finder/3237 Poland Expansion of a waste management facility. http://www.acucomm.net/business-finder/3238 Serbia Construction of a 20 MW biomass plant. http://www.acucomm.net/business-finder/3198 South Africa Plastic bottle recycling plant opens. http://www.acucomm.net/business-finder/3215 South Korea Contract awarded for sewage treatment plant co-digestion system. http://www.acucomm.net/business-finder/3173 Spain Construction of a plant converting waste into fuel. http://www.acucomm.net/business-finder/3164 Sweden Inauguration of a wood-fired district heating plant. http://www.acucomm.net/business-finder/3182 Sweden Installation of a new boiler plant. http://www.acucomm.net/business-finder/3185 Issue Number 009 Date of Publication June 2015
- 19. Latest Monthly Project Listings, May 2015 (cont.) Country Summary Link Switzerland Construction of a wood-fired drying plant. http://www.acucomm.net/business-finder/3201 Switzerland Construction of a plastic bottle recycling facility. http://www.acucomm.net/business-finder/3206 Switzerland Development of a wood-fuelled biomass plant. http://www.acucomm.net/business-finder/3219 Turkey Establishment of an olive waste-to-energy facility. http://www.acucomm.net/business-finder/3195 UK Plastic recycling facility upgrading. http://www.acucomm.net/business-finder/3163 UK Construction of a waste transfer station. http://www.acucomm.net/business-finder/3170 UK Development of 95,000 tpa waste treatment facility. http://www.acucomm.net/business-finder/3188 UK Development of an open windrow composting facility. http://www.acucomm.net/business-finder/3197 UK Implementation of an SRF solution for cement works. http://www.acucomm.net/business-finder/3222 UK Construction of a 1.0 MW AD plant. http://www.acucomm.net/business-finder/3223 UK Construction of a 100,000 tpa waste recycling and treatment facility. http://www.acucomm.net/business-finder/3253 United Arab Emirates Installation of a waste separation system. http://www.acucomm.net/business-finder/3239 Uruguay Construction of a WtE/recovery plant. http://www.acucomm.net/business-finder/3240 Uruguay Bioethanol plant begins operations. http://www.acucomm.net/business-finder/3242 USA Construction of a C&D transfer station. http://www.acucomm.net/business-finder/3165 USA Development of a 5 MW WtE plant. http://www.acucomm.net/business-finder/3166 USA Development of a 9 MW WtE plant. http://www.acucomm.net/business-finder/3168 USA Project to convert landfill gas into energy. http://www.acucomm.net/business-finder/3169 USA Installation and retrofitting of a wood pellet production plant. http://www.acucomm.net/business-finder/3175 USA Opening of a landfill gas-to-energy facility. http://www.acucomm.net/business-finder/3178 USA Proposed development of a 63 MW fuell cell park. http://www.acucomm.net/business-finder/3193 USA Development of an underground interim nuclear storage facility. http://www.acucomm.net/business-finder/3196 USA Construction of an anaerobic digestion facility at a zoo. http://www.acucomm.net/business-finder/3202 USA Proposed construction of an organics recycling facility. http://www.acucomm.net/business-finder/3205 Issue Number 009 Date of Publication June 2015
- 20. Latest Monthly Project Listings, May 2015 (cont.) Country Summary Link USA Development of a landfill gas-to-energy project with anaerobic digester. http://www.acucomm.net/business-finder/3208 USA Upgrading of a resource recovery facility. http://www.acucomm.net/business-finder/3214 USA Grant awarded for biomass boiler system. http://www.acucomm.net/business-finder/3216 USA Opening of a single-stream recycling system. http://www.acucomm.net/business-finder/3217 USA New heating plant at biomass cogeneration facility. http://www.acucomm.net/business-finder/3218 USA Installation of a single-stream recycling facility. http://www.acucomm.net/business-finder/3224 USA Construction of a fully-lined coal ash landfill. http://www.acucomm.net/business-finder/3225 USA Construction of a fully-lined coal ash landfill. http://www.acucomm.net/business-finder/3226 USA Expansion of a facility that recycles CO2 into liquid fuels. http://www.acucomm.net/business-finder/3232 USA Redevelopment of landfill and recycling facilities. http://www.acucomm.net/business-finder/3235 USA Installation of a 1.4 MW fuel cell plant. http://www.acucomm.net/business-finder/3236 USA Building of a farm biogas plant. http://www.acucomm.net/business-finder/3244 USA Installation of an anaerobic digester. http://www.acucomm.net/business-finder/3249 Issue Number 009 Date of Publication June 2015
- 21. acucomm.net 01243 788 686acucomm.netinfo@acucomm.net Click here to take a look at the Renewables and Energy from Waste projects in AcuComm’s Business db database