Effects of plant competition on shoot versus root growth and soil microbial a...
The Paleoecology of Holme Moss Human interference influences on habitat change
1. The Paleoecology of Holme Moss: Human interference influences on habitat change
Introduction
Holme Moss isa highaltitude uplandmoorlocatedwithinthe DarkPeakSSSIsite of the Southern
Penninescomprisedof amixedpatchworkof habitatsincluding blanketbogs,heathlandandmires.
The predominantvegetationare grasses(WavyHair-grass-Deschampsia flexuosa),shrubs(Heather-
Calluna vulgaris, Bilberry -Vacciniummyrtillus,) andsedges(CottonGrass Eriophorumvaginatum),
withsmall areasof SphagnumMoss(JNCC2004). Thisarea once containedwoodlandandremnant
patchesof Oak Woodscan be foundon the moorsslopes(Natural England,1994).The areahas
experiencedsignificanthabitatchangesthroughoutthe years(Holden etal., 2007) withmany
studiesfocusingondegradationof peatlandsandcausesof erosionthroughoutthe moors(Evans,
2005; Shepard et al., 2013).
By utilisingpaleoecology,withafocusonpollenmacrofossil distributioninpeatcores,thisstudy
aimsto investigate the habitat changesovertime withinHolme Moss.The followingkeyquestions
will be addressed,whatare the impactsof humaninterference withinthisarea?Are there any
significantpointsinhistorywhichdetrimentallyimpacteduponHolme Moss?Andare there any
factors influencingcurrenthabitatcompositions?
Objectives
The investigationaimandkeyquestionsshallbe addressedthe following:
Core samplesshall be gatheredacrossthe varyinghabitatof Holme Moss
Metal concentrationat periodicintervalsincore depthwill be analysed.
Pollenandanthropogenicindicatorscountedatperiodicintervalsincore depth.
Resultswill be statisticallyanalysedandillustratedtoidentifychangesinpollen
concentrationsovertime incorrelationwithchangesinmetal concentration.
Method
Coreswere obtainedasbelow(figure 1).
Core
name
Date
taken Size Location Site characteristics
Analysis
performed
CorePlat Nov-15 50cm Plateau Full vegitationcover,Eriophorum dominent Peat Chemistry
CoreT1 Nov-15 50cm Original Surface Full vegitationcover,Deschampsiaflexuosa dominent Peat Chemistry
Core2013 Jul-13 100cm Original Surface Full vegitationcover,Deschampsiaflexuosa dominent Pollen Analysis
Figure 1. Core samples by site and analysis performed
Pollensample preparationforanalysiswere obtainedfollowingprotocolsoutlinedbyLageard(2009)
whichutilisedcentrifugal separationtechniquesdescribedbyChambers(2002),Faegri & Iversen
(1989), Moore (1986) and Moore et al., (1991). Pollenidentification,Total LandPollen(TLP)
calculationsandpollendiagramwere producedfollowingprotocolsoutlinedbyTallis(1999) and
Walker(2005). The above wasappliedtoCore2013.
2. PeatchemistrycompositiondatawasobtainedviaICPanalysis.SamplepreparationwithEDTA for
ICPanalysisfollowedprotocolsoutlinedbyOztan &During2012 for CorePlatandCoreT1.The soil
freshto dryweightratiowasalso calculatedviarecordingthe freshandre-weighingafteraperiodof
drying.
Results
Freshand dry weightµg pergram was calculatedusingthe followingforLead(Pb),Copper(Cu),
Potassium(K) andMagnesium(Mg).ICPconcentrationswere giveninmicrogramsperlitre (mg/litre)
for eachelement.Thiswasconvertedintomicrogramspermillilitre (µg/ml) andtimesbythe 30 mL
of extractingfluid(EDTA).Thiswasthendividedbythe soilsfreshweight(5g) todetermine
microgramsof elementpergramof freshweight(i.eµgPb/gFW).Dry weightmicrogrampergram
(µg/gDW) for eachelementwascalculatedbymultiplyingmicrogramspergramof freshweightper
element,bythe freshtodryweightratioof core soil sample.Anexample of thisprocessseenbelow
for Lead:
7.02 mg Pb/l = 7.02 µg Pb/ml
7.02 µg Pb/ml x 30 = 210.5 µg Pb
210.5 µg Pb ÷ 5 = 42.1 µg Pb/gFW
42.1 µg Pb/g FW = 42.1 x 3.85 = 162.08 µg Pb / g DW
Thisprocesswas repeatedwitheachelementandvaryingdepthsthroughoutbothCorePlatand
CoreT1.
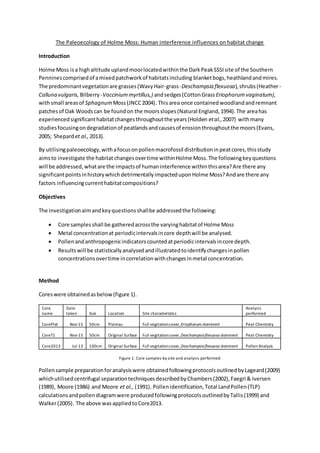
Figure 2. CorePlat fresh and dry weight concentrations ofLead across a range ofdepths withi n 0-50 cm
All elementsdemonstrate variationbetweenfreshanddryweightconcentrations,withfreshweight
levelslowerthandryweightinbothCorePlatandCoreT1.Pb concentrationsinCorePlatindicate an
increase inPbfromapproximately25cminfresh weight,and30cm indry weight(figure2).Followed
by a periodof fluctuationinconcentrationinbothfreshanddryweightfrombetween10-2cm.
Furthermore,proceededbyasteepdeclineinconcentration.A similartrendisobservedinCoreT1
0
5
10
15
20
25
30
35
40
45
50
0 100 200 300 400 500
Depth(cm)
Pb (µg/g)
Pb freshand dry weightconcentration across 0-50cm depth of peatCorePlat
Fresh Weight
Dry Weight
3. (figure 3) yetnotable featuresdistinguishitfromCorePlat.DryweightPbconcentrationsincura
steepincrease between50-40cm whichreducesinseverity(yetcontinuestoincrease) until 20cm.
Proceededbyasteepdecline tobelow concentrationlevelsseeninfresh weight.Furthermore
proceededbyanincrease,fluctuation,thandecline similartothatof CorePlat.Comparatively,
CorePlatdemonstrateshigherconcentrationsof Pb,whilstCoreT1experiencesnotablymore erratic
fluctuations.
Figure 3. CoreT1 fresh and dry weight concentrations ofLead across a range ofdepths within 0-50 cm
Cu inboth CorePlat(figure4) andCoreT1 (figure 5) follow asimilarpatterntothose observedinPb
inCoreT1. Cu increasesat50cm followedbysuddendecline tolevelsbelow or similartofresh
weightconcentrations,precededbyaperiodof fluctuation;resolvingwithasteepdecline.CorePlat
containshigherconcentrationsof Cu.CorePlatalsodemonstratesalowerdegreeof variation
betweenfreshanddryweightconcentrations of Cu.
0
5
10
15
20
25
30
35
40
45
50
0 50 100 150 200 250 300 350
Depth(cm)
Pb (µg/g)
Pb freshand dry weightconcentrations across 0-50cm depth of peat CoreT1
Fresh Weight
Dry Weight
4. Figure 4. CorePlat fresh and dry weight concentrations ofCopper across a range ofdepths within 0 -50 cm
Figure 5. CoreT1 fresh and dry weight concentrations ofCopper across a range ofdepths within 0 -50 cm
0
5
10
15
20
25
30
35
40
45
50
0 10 20 30 40 50
Depth(cm)
Cu (µg/g)
Cu freshand dry weightconcentration across 0-50cm of peat CorePlat
Fresh Weight
Dry Weight
0
5
10
15
20
25
30
35
40
45
50
0 5 10 15 20
Depth(cm)
Cu (µg/g)
Cu freshand dry weightconcentration across 0-50cm of peat CoreT1
Fresh Weight
Dry Weight
5. K concentrationsinCorePlatdemonstrate asubstantial difference betweenfreshanddryweight
(figure 6).Freshweightconcentrationsneverpeakbeyond100µg/g whereasdryweightstartsat
over350 µg/g andpeaksat over600 µg/g. The freshand dryweightshowsadecline inKfrom50 –
30cm followedbyanincrease.The increase issteeperindryweightandconcludesat20cm. Aswith
Pb andCu, a periodof fluctuationinconcentrationfrom10cmis precededbyadecline from3-0cm.
CorePlat,Kconcentrationsexperienceasharpspike inabundance inbothfreshand dryweightat
around6cm indepth.
Figure 6. CorePlat fresh and dry weight concentrations ofPotassium across a range ofdepths within 0 -50 cm
Figure 7. CoreT1 fresh and dry weight concentrations ofPotassium across a range ofdepths within 0- 50 cm
0
5
10
15
20
25
30
35
40
45
50
0 100 200 300 400 500 600 700
Depth(cm)
K (µg/g)
K fresh and dry weightconcentration across 0-50cm of peatCorePlat
Fresh Weight
Dry Weight
0
5
10
15
20
25
30
35
40
45
50
0 100 200 300 400 500 600
Depth(cm)
K (µg/g)
K fresh and dry weightconcentration across 0-50cm of peatCoreT1
fresh Weight
Dry Weight
6. CoreT1 K concentrationsdemonstrate substantial differencesbetweenfreshanddryweight(figure
7). It too followsasimilarpatterntothatseeninCorePlat,withafew distinguishingfeatures.The
decline indryweightKfrom20cm dropsbelow freshweightlevels.The same sharpspike (observed
inCorePlat) occursnowat 4cm. K concentrationscontinue toincrease withoutdecline until0cm.
Figure 8. CorePlat fresh and dry weight concentrations ofMagnesium across a range ofdepths within 0-50 cm
Figure 9. CoreT1 fresh and dry weight concentrations ofMagnesium across a range ofdepths within 0 - 50 cm
0
5
10
15
20
25
30
35
40
45
50
0 200 400 600 800 1000
Depth(cm)
Mg (µg/g)
Mg freshand dry weightconcentration across 0-50cm of peat CorePlat
fresh Weight
Dry Weight
0
5
10
15
20
25
30
35
40
45
50
0 50 100 150 200 250 300 350
Depth(cm)
Mg (µg/g)
Mg freshand dry weightconcentration across 0-50cm of peat coreT1
Fresh Weight
Dry Weight
7. Mg concentrationsinCorePlatappeartofollow similartrendsobservedinKconcentrationsin
CorePlat(figure 8).However,Mg levelsare substantiallyhigherwithasteeperdecline from20cm.
CoreT1 Mg concentrations,are similartopatternsobservedinKconcentrationsinCoreT1(figure 9).
CorePlat Descriptives CoreT1 Descriptives
Element Statistic Std. Error Statistic
Std.
Error
Pb DW
(µg/g)
Mean
199.57 ± 129.43 32.36
143.83 ±
117.79
29.45
Sig. 0.348 0.031
Cu DW
(µg/g)
Mean
9.14 ± 2.83 6.83 ± 5.50 1.38
Sig. 0.002 0.058
K DW
(µg/g)
Mean
288.87 ± 123.43 30.86 236.2 ± 150.67 37.67
Sig. 0.023 0.302
Mg DW
(µg/g)
Mean
303.49 ± 213.16 53.29 174.18 ± 95.87 23.97
Sig. 0.006 0.019
Figure 10. Mean concentration per elementpercore. Sig =normalitysignificance(Shapiro-Wilks). ±Standard deviation produced with N=
16
Statistical analysisperformedon dryweightelementconcentrationsconcludedthatcomparatively
CorePlatcontainedhighlevelsof all elementsthanCoreT1(figure 10).Standarderror and deviation
was highandnormalitytests(Shapiro-Wilks) identifiedthe dataasnon-parametric.Consequently,
Spearman’srankcorrelationswere performedacrossall dryweightelementconcentrationsbetween
bothcores (figure 11) and dry weightconcentrationsinrelationtodepthforbothcores(figure 12).A
numberof strong significantcorrelationscanbe seeninfigure 11 and figure 12.
8. CorePlat & CoreT1 Element Correlation Matrix
PLAT
Pb/ DW
(µg/g)
PLAT
Cu/ DW
(µg/g)
PLAT
K/ DW
(µg/g)
PLAT
Mg/ DW
(µg/g)
T1 Pb/
DW
(µg/g)
T1 Cu/
DW
(µg/g)
T1 K/
DW
(µg/g)
T1 Mg/
DW
(µg/g)
PLAT Pb/
DW (µg/g)
Correlation
Coefficient 1.000 .882**
-.050 -.571*
.774**
.679**
-.076 -.165
PLAT Cu/
DW (µg/g)
Correlation
Coefficient .882**
1.000 -.209 -.756**
.756**
.694**
.135 .044
PLAT K/
DW (µg/g)
Correlation
Coefficient -.050 -.209 1.000 .703**
.056 -.026 -.068 -.162
PLAT Mg/
DW (µg/g)
Correlation
Coefficient -.571*
-.756**
.703**
1.000 -.550*
-.588*
-.103 -.159
T1 Pb/ DW
(µg/g)
Correlation
Coefficient .774**
.756**
.056 -.550*
1.000 .971**
.250 .253
T1 Cu/ DW
(µg/g)
Correlation
Coefficient .679**
.694**
-.026 -.588*
.971**
1.000 .329 .362
T1 K/ DW
(µg/g)
Correlation
Coefficient -.076 .135 -.068 -.103 .250 .329 1.000 .932**
T1 Mg/ DW
(µg/g)
Correlation
Coefficient -.165 .044 -.162 -.159 .253 .362 .932**
1.000
**. Correlation is significant at the 0.01 level.
*. Correlation is significant at the 0.05 level.
Figure 11. Spearman’s rank correlation coefficients between CorePlat (PLAT) elements dry weight concentrations and CoreT1 (T1 )
elements dry weight concentrations
CorePlat Depth vs Element Correlations
CoreT1 Depth vs Element Correlations
Pb DW
(µg/g)
Cu DW
(µg/g)
K DW
(µg/g)
Mg DW
(µg/g)
Pb DW
(µg/g)
Cu DW
(µg/g)
K DW
(µg/g)
Mg DW
(µg/g)
Depth Correlation
Coefficient -.756**
-.903**
.450 .891**
-.644**
-.594*
-.129 -.085
**. Correlation is significant at the 0.01 level.
*. Correlation is significant at the 0.05 level.
Figure 12. Spearman’s rank correlation coefficient between all elements and depth per core.
Total LandPollen(TLP) (the sumof all tree,shrubandherbsspecies counted) wascalculated
throughouta numberof depthwithin0-50cm of Core2013. The percentage TLPper specieswasthen
calculated(%TLP) toproduce a pollendiagramforHolme Moss(figure 13).Two pollenassemblage
zoneshave beenidentified,HM-dandHM-c. ThisincombinationwithSCPconcentrations,arboreal
/non-arboreal abundanceandcharcoal points,have beenusedtodistinguishanykeypoints
throughoutthe core whichcan be attributedtoclimacticchange,disturbance andanthropogenic
influence.
10. Discussion
Pollencompositionat30cm withinHM-c demonstrate anabundance of Pinus andCorylus which
reflectsanarboreal woodlandhabitat.Atthe same point,SCP’sandcharcoal experienceda
significantincreaseindicatingaperiodof deforestationandburning.Thisissupportedbydeclining
abundance of arboreal pollenfollowedbyasteadyincrease (20cm) innon-arboreals. Sphagnum and
heather(Calluna) experience asignificantincrease inabundance withinHm-d.However,Sphagnum
thendeclinesthroughoutthe sootyHM-dlayer(indicationof the industrial age).Shallow pollen
assemblagesreflectedmoderndayvegetationcompositionwithalmostdiminishedspore
abundance,asteadyincrease inarboreal species(withthe absence of Pinus) andheather
dominance. Peatchemistry analysisat30 cm supportsthe findingswithinpollenassemblages.At30
-20cm bothLead andCopperexperience andincrease inconcentration.The heavymetalsincrease
couldbe attributedtoatmosphericdepositsfromindustrialisationandmining(Turner, etal2014).
Both Leadand Copperhave a significantnegative correlationwithdepth,furthersupportingits
abundance as depthreduces.PotassiumandMagnesiumfrom30-20cm bothdemonstrate an
increase whichreflectspollenassemblagesindicatingadecline invegetationuptakefollowing
deforestationandlandclearing(Vane etal., 2013). Bothmetalshave significantlypositive
correlationswithone anotherineachcore indicatingasLeadincreasessotoo doesCopper.Though,
MagnesiumandPotassiumhave significantnegative correlationswithmetalsindicatingasheavy
metalsincrease,mineralssuchasPotassiumandMagnesiumdecline.The fluctuationof bothheavy
metalsandmineralsfrom16-0cm couldindicate a periodof revegetationfrompossiblerestoration
efforts.
ComparativelyCorePlatshowsevidenceof beinganincomplete core asCoreT1 showsvariationin
pointsof change.CoreT1 appearsto show greaterdetail atdepthsbetween10-0cm.Thiscould
indicate lossof depthwithinCorePlatdue topeatcutting(Battarbee etal.,2015). The variationin
elementabundancebetweenwetanddryweightcanbe attributedtoflux withingroundwater.
Heavymetal concentrationsare lessmobileingroundwaterwhereasmineralsare ina constantstate
of flux dependentonvegetationanduptake fromrootcommunities(Alongi etal., 2004).
Overall,thisinvestigationidentifiestwopointsof interestwithinthe coressampledwhich
demonstrate substantial anddetrimental interference fromdeforestation,burningandmining(30 -
20cm), precededbyatmosphericcontaminationfromthe industrial age (20-16cm). These points
have causedsignificantchangesinvegetationcompositionbothhistoricallyandcurrent,converting
the landscape froman arboreal woodlandhabitattopeatbogsand heathland.
Radiocarbondatingcouldimprove thisstudybyprovidingatimeline forcomparison.Other
investigationshave producedsimilarfindingstothisstudy,highlightingsignificantdisruptiontoboth
peatchemistryandpollenassemblagesatdepthsof approximately30-20cmas a resultof the
industrial age,supportedbyradiocarbondating(Battarbee etal, 2015; Lageard et al,1999).
Improvementinthe processingof pollenandSCPidentificationisneeded,asanumberof individuals
performedthistaskresultinginpotentialmisidentificationbetweenresearchers.Furthermore,
significantimprovementscanbe made by simplyincreasingthe sample sizewithinthe coresand
repeatingtestingtoconfirmitsvalidity.
11. Word count 1642
Reference
Alongi,D.,Wattayakorn,G.,Boyle,S.,Tirendi,F.,Payn,C.,Dixon,P. (2004).Influence of rootand
climate onmineral andtrace elementstorage andflux intropical mangrove soils. Biogeochemistry,
Vol 69: 105-123
Battarbee,R.,Turner,S.,Yang, H., Rose,N.,Smyntek,P.,Reimer,P.,Oldffield,F.,Jones,V.,Flower,
R., Roe,K.,Shilland,E.,Blaauw,M.(2015). Airpollutantcontaminationandacidificationof surface
watersinthe NorthYork Moors, UK: Multi-proxyevidence fromthe sedimentsof amoorlandpool.
The Holocene,Vol 25: 266-237
Chambers,F.(2002). The Environmental applicationsof pollenanalysis.In:S,Haslett. Quaternary
environmentalmicropalaeontology. Arnold,London,pp241-258
Evans,R. (2005). Curtailinggrazing-inducederosioninasmall catchmentanditsenvirons,the Peak
District,central England. Applied Geography, Vol 25:81-95
Faegri,Kand Iversen,J.(1989). Textbookof pollen analysis. 4th
ed.Wiley,Chichester
Holden,J.,Shotbolt,L.,Bonn,A.,Burt,T., Chapman,P.,Dougill,A.,Fraser,E.,Hubacek,K.,Irvine,B.,
Kirkby,M.,Reed,M., Prell,C.,Stagl,S.,Stringer,L.,Turner,A.,Worrall,F.(2007). Environmental
change in moorlandlandscapes. Earthsciencereviews,Vol 82: 75-100
JNCC.(2004). UK SACdataform. Peterborough,Natura2000. UK90007021
Lageard,J. (2009). COSHHRISK ASSESSMENT Preparation of samplesforpollen analysis. Manchester
metropolitanuniversity,Manchester.
Lageard,J., Chambers,F.,Thomas,P.(1999). Climaticsignificance of the marginalizationof Scots
pine (Pinussylvestris L.) c. 2500 bc at White Moss,SouthCheshire,UK. TheHolocene, Vol 9: 321-331
Moore,P. (1986). Site history.In:P,Moore & S, Chapman, Methodsin plantecology. 2nd
Ed.
Blackwells,Oxford.
Moore,P., Webb,J.,Collinson,M.(1991). Pollen analysis.2n ed.Blackwell,Oxford
Natural England.(1994) Designatesites view:South Penninemoors. [Online] [Accesson03/12/2015]
<http://www.sssi.naturalengland.org.uk/citation/citation_photo/1007196.pdf>
Oztan,S., During,R.(2012). Microwave assistedEDTA extraction-determinationof pseudototal
contentsof distinctelementsinsolidenvironmental matrices. Talanta,Vol99:594-602
Shepherd,M.,Labadz,J.,Caporn,S., Crowle,A.,Goodison,R.,Rebane,M.,Waters,R. (2013). Natural
Englandreviewof uplandevidence- Restoration of degraded blanketbog.Natural EnglandEvidence
Review,Number003
Tallis,J.(1999). The uplands:humaninfluence onplantcover.In:E,Greenwood(Ed) Ecology &
landscapedevelopment:a history of theMersey Basin, pp109-121, Liverpool universitypress.
12. Turner,T., Swindles,G.,Roucoux,K.(2014). Late Holocene ecohydrological andcarbondynamicsof a
UK raisedbog: impactof human activityandclimate change. Quaternary sciencereviews,Vol 84:65-
85
Vane,C.,Rawlins,B.,Kim,A.,Moss-haye,V.,Kendrick,C.,Leng,M.(2013). Sedimentarytransportand
fate of polycyclicaromatichydrocarbons(PAH) frommanagedburningof moorlandvegetationon
blanketpeat,SotuhYorkshire,UK. Scienceof the total environment, Vol 449: 81-94
Walker,M. (2005). Quaternary dating methods. Wiley,Chichester