Structural characterization of TiO2 films grown on LaAlO3 and SrTiO3 substrat...
poster Final
1. Acknowledgements
Bright Group
University at
Buffalo
Characterization of Patterned Anti-Fouling Xerogel Coatings
Zachary R. Jones, Joel F. Destino, Caitlyn M. Gatley, Michael R. Detty, and Frank V. Bright*
Department of Chemistry, University at Buffalo, The State University of New York, Buffalo, NY 14260-3000
Abstract
Background
Biofouling:
Past work1:
Biofouling refers to the settlement of
organisms on a submerged surface.
Fouling creates problems for the
shipping industry in the form of increased
drag, increased fuel consumption and
costs, as well as increased corrosion of
the submerged surfaces.2
Current Project
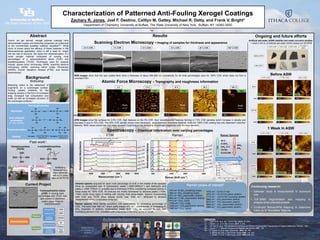
Atomic Force Microscopy - Topography and roughness information
Scanning Electron Microscopy - Imaging of samples for thickness and appearance
Spectroscopy - Chemical information over varying percentages
Hybrid, sol gel derived, xerogel polymer coatings have
demonstrated superb anti-biofouling properties as evidenced
by the commercially available material, AquafastTM.1 While
much is known about the efficacy of these materials in the
aforementioned application, there is still a need for insight
into the role of structure. We report the characterization of a
novel xerogel material composed of varying mole
percentages of a carboxyethyltriol silane (COE) and
tetraethoxysilane (TEOS). Techniques used for analysis
include: atomic force microscopy (AFM), scanning electron
microscopy (SEM), scanning kelvin probe microscopy
(SKPM), Fourier transform infrared (FTIR), and Raman
spectroscopy.
References
(1) Detty, M.R. et al. Acc. Chem. Res. 2014, 47, 678.
(2) Callow, J.A. et al. Nat. Comm. 2011, 2, 244.
(3) Lin-Vien D. et al. The Handbook of Infrared and Raman Characteristic Frequencies of Organic Molecules; Elsevier, 1991.
(4) Launer, P. J. Silicone Compounds Register and Review 1987, 100.
(5) a. Gigant, K. et al. Appl. Spectrosc. 2002, 56, 762.
b. Matos, M. et al. J. Non-Cryst. Solids 1992, 147, 232
c. Gnado, J. et al. J. Non-Cryst. Solids 1996, 208, 247.
AFM images show flat surfaces for 2.5% COE, high features on the 5% COE, then ‘snowflake-like’ features forming in 7.5% COE samples which increase in density and
decrease in size in 10% COE. The 20% COE sample shows more developed, large branched snowflake features, while the 100% COE coating has only dispersed ‘cube-like’
features. RMS values shown are root mean squared roughness in nm, indicating an average roughness over the area sampled.
-1.50 1.20
10 μm
0.556
2.5 %
-115 1110
10 μm
79.3
5 %
-15.0 94.0
10 μm
19.7
7.5 %
-21.0 33.0
10 μm
11.0
10 %
-78.1 52.0
10 μm
16.3
20 %
-30.2 260
10 μm
344
100 %
RMS
(nm)
(nm)
Carboxyethyltriol silane
(COE), in varying mole
percentages with TEOS, was
spin coated on aluminum
coated glass slides for
characterization.
Characterization
Physical
Topography AFM
Appearance SEM
Surface
potential
SKPM
Chemical
Spectroscopy
IR
Raman
Surface
chemistry
TOF-
SIMS
1 Week in ASW
Before ASW
SKPM
AFM
2.5% COE 7.5% COE
1 μm
12.9
-25.0 85.0
20% COE
-19.9 45.1
1 μm
17.0
1075 1145
1126 ± 9
1 μm
355 425
377 ± 11
1 μm
218 312
281 ± 10.6
1 μm
1 μm
-0.50 1.50
0.256
20% COE
1 μm
21.3
-56.8 64.7
7.5% COE
1 μm
9.05
-16.0 32.4
2.5% COE
1 μm
0.44
-0.89 13.3
1009 1137
1042 ± 18
1 μm
67 241
116 ± 28
1 μm
586 659
616 ± 7.8
1 μm
SKPM
AFM
Ongoing and future efforts
Artificial salt water (ASW) stability and metal corrosion studies:
1 week in 20 mL of artificial salt water (ASW) shaken at 100 RPM
2.5 % COE 5 % COE 7.5 % COE 10 % COE 20 % COE 100 % COE
SEM images show that the spin coated films have a thickness of about 200-400 nm consistently for all mole percentages save for 100% COE which does not form a
consistent film.
Infrared spectra acquired for each mole percentage of COE in the middle of the samples
show an unexpected lack of hydrocarbon peaks (~2850-2950cm-1) and carboxylic acid
peaks (~1500-1750cm-1)3, possibly due to thickness of films considering increased activity in
these areas for 100% COE. All mixtures are mostly dominated by siloxane peaks (~1050-
1160)4 which show signs of shifting with varying mole percentages. Spectra incorporating
both COE and TEOS show intense bands near 1250 cm-1, attributed to siloxane
characteristic of the combination of the two.
Raman spectra show trends consistent with expectations for increasing percentage of
COE. The band near 490 cm-1 which shifts toward 460 cm-1, characteristic of increasing R-
SiO3 character. In addition, hydrocarbon peaks favor -CH2- as opposed to -CH3 with
increasing percent COE, consistent with a decrease in the ethyl group of TEOS.
Continuing research:
• Saltwater study & measurement of aluminum
loss
• TOF-SIMS fragmentation and mapping to
analyze small potential pockets
• Continued Raman/AFM mapping to determine
make-up of “snowflake” features
Hydrolysis
Acid catalyzed
protonation
(or base catalysis)
Polycondensation
Heating Supercritical drying
More porous
Ambient drying
Less porous
Aerogels Xerogels
Antifouling
characteristics
were achieved
with a 1:1 mole
ratio of C8:TEOS.
(nm)
Raman
Raman Shift (cm-1
)
500 1500 3000 4000
NormalizedIntensity
Siloxane symmetric stretch -LO mode
Siloxane asymmetric stretch -TO mode
COOH bands
FTIR
Wavenumber (cm-1
)
1000 1500 3000 3500 4000
NormalizedAbsorbance
Results
Raman peaks of interest5
470 cm-1 R-SiO3 (breathing mode)
490 cm-1 SiO4 (breathing mode)
791 cm-1 SiO4 (asymmetric stretch)
805 cm-1 C-SiO3 (asymmetric stretch)
815 cm-1 -CH2- (rock)
1420 cm-1 -CH2- (wag)
1453 cm-1 –CH3 (asymmetric stretch)
1493 cm-1 -CH2- (bend)
1570 cm-1 –C(=O)-O- Na+
1670 cm-1 –C(=O)-OH (dimer stretch)
1710 cm-1 –C(=O)-OH (monomer stretch)
2850 cm-1 –CH2-(symmetric stretch)
2870 cm-1 -CH3 (symmetric stretch)
2920 cm-1 -CH2- (asymmetric stretch)
2960 cm-1 -CH3 (asymmetric stretch)
2.5% COE 7.5% COE 20% COE
Al coated
glass
Before ASW
After ASW
The sol-gel process
Raman SiO4
(mV)
(nm)
(mV)
Tetraethoxysilane
(TEOS)
n-octyltriethoxysilane
(C8)