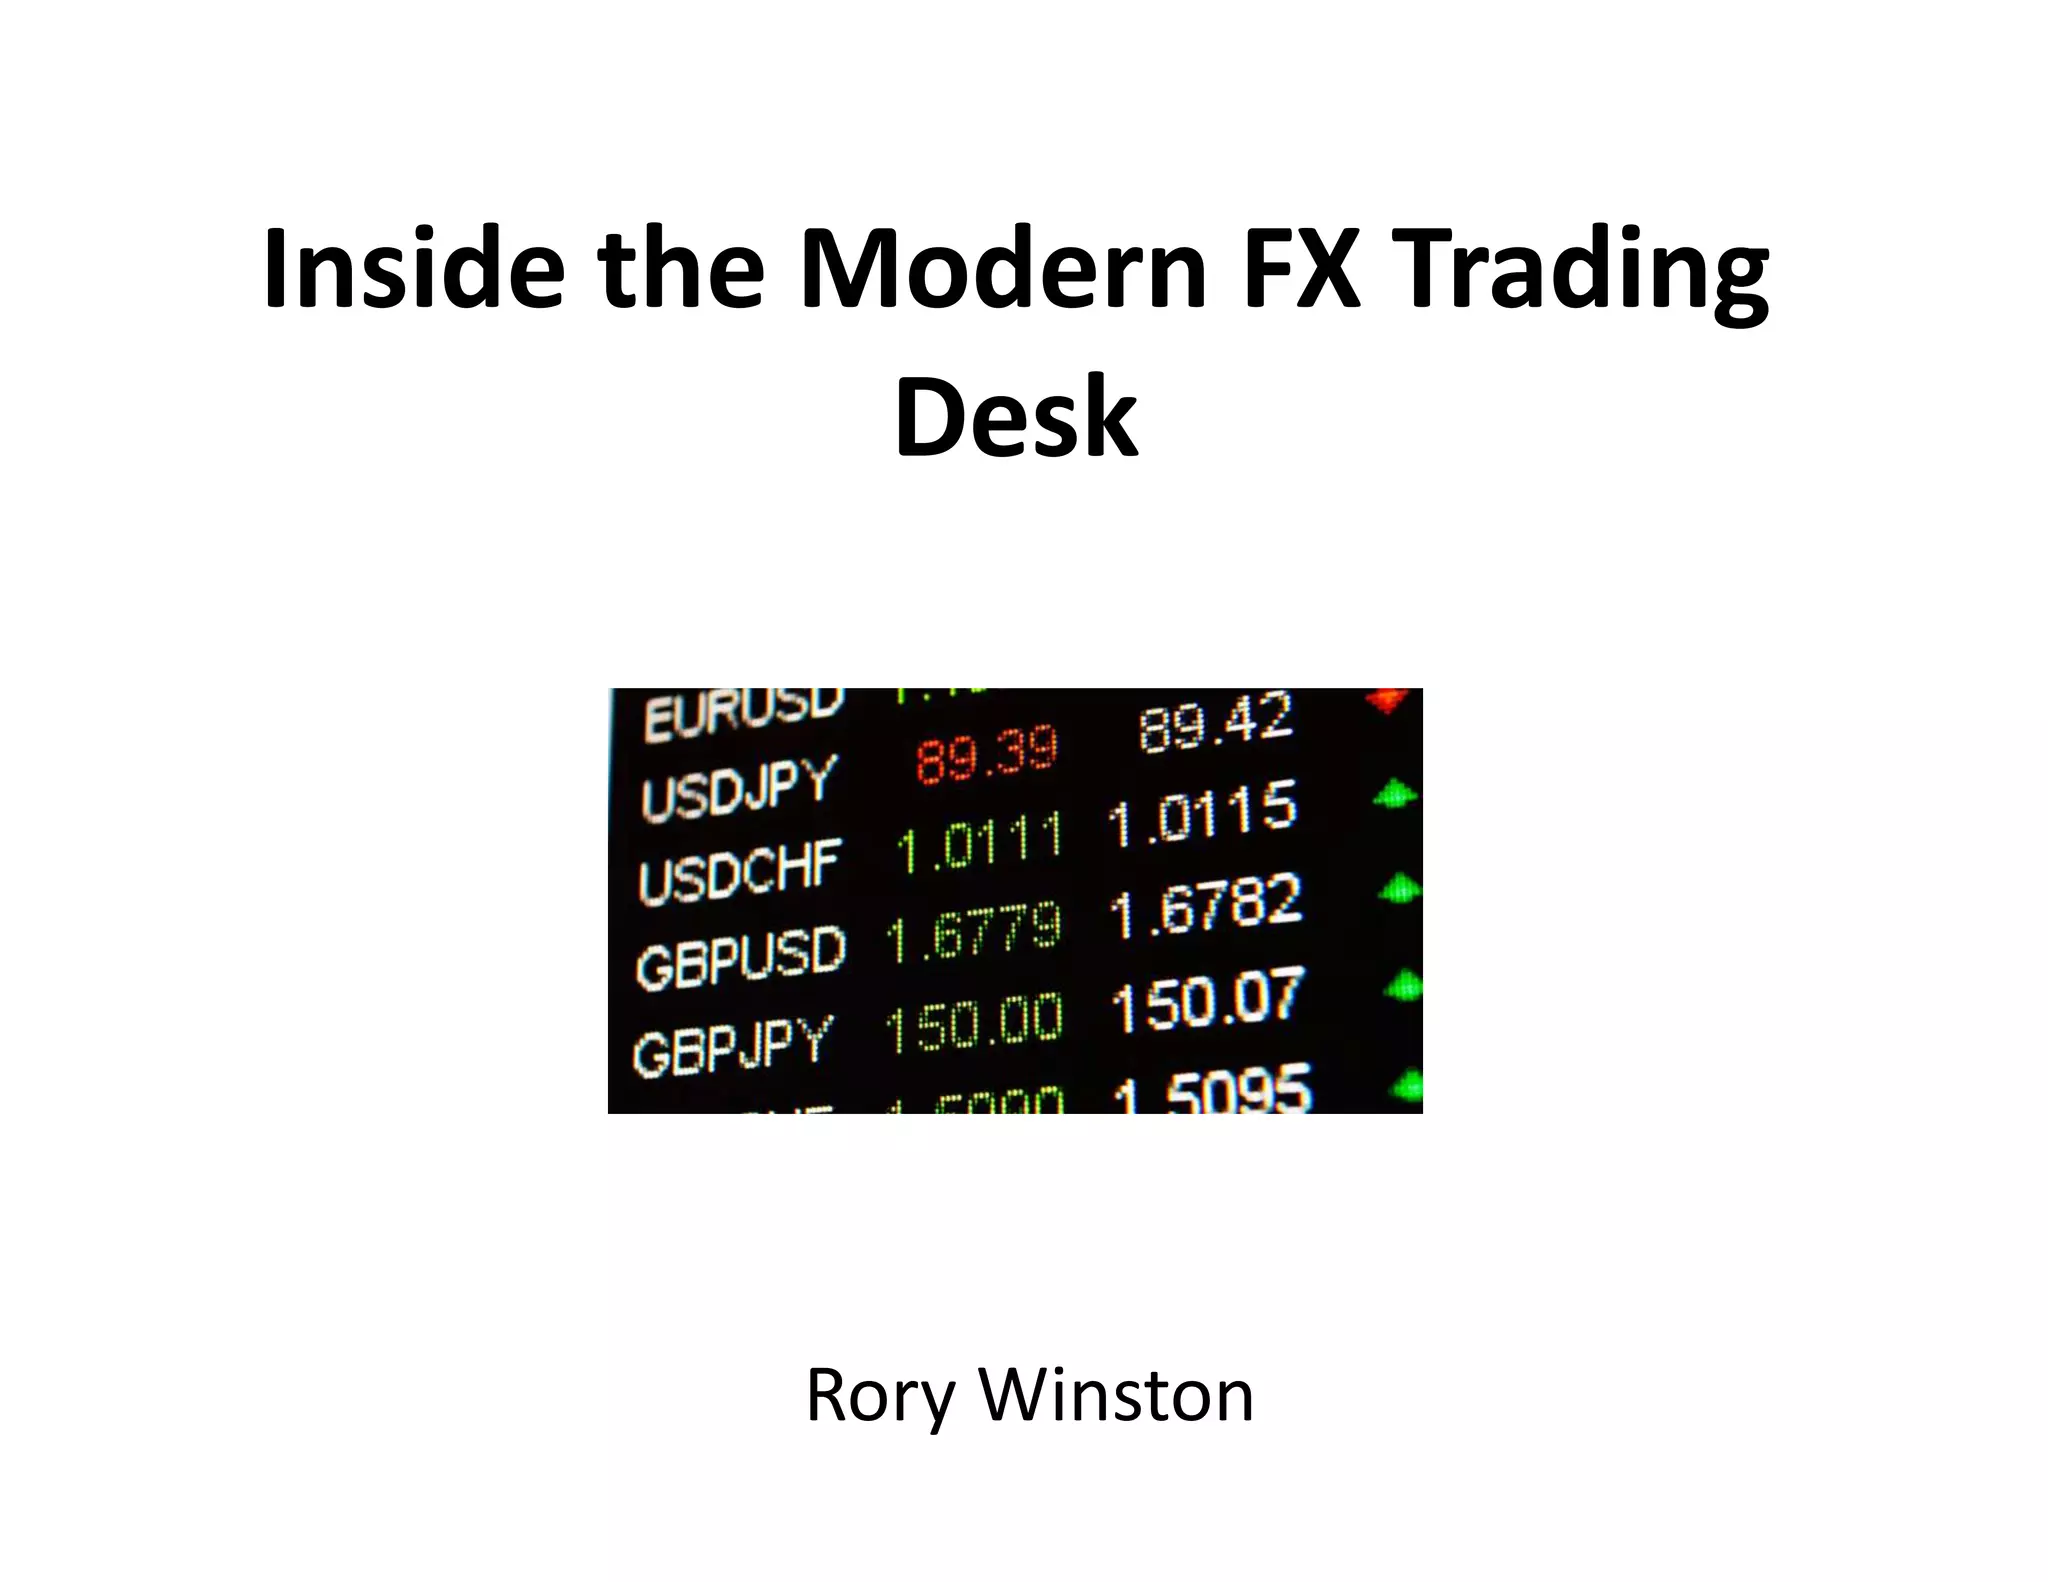
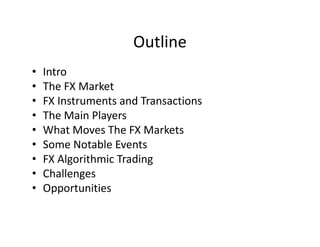
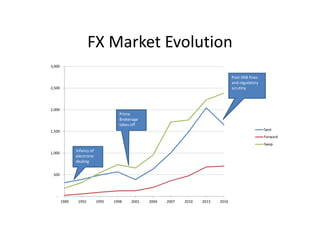
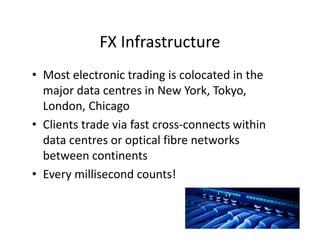
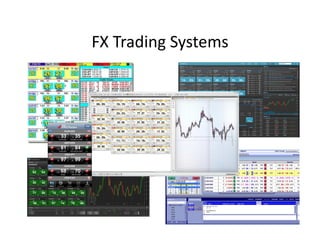
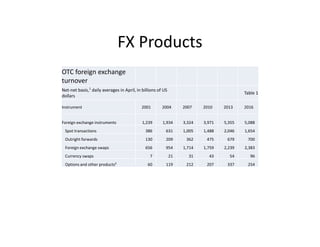
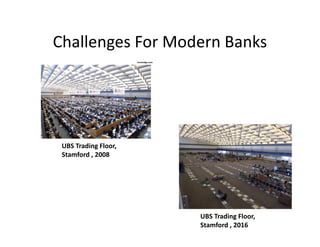
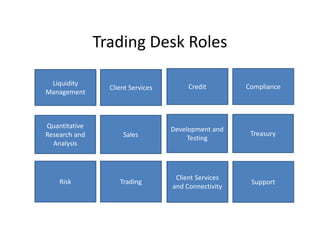
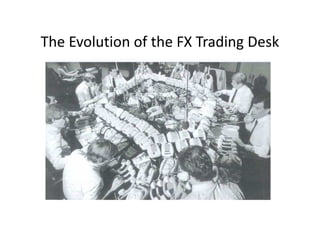
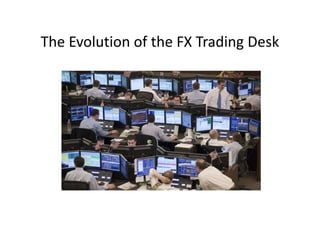
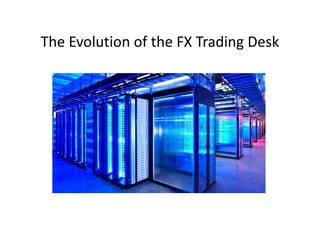
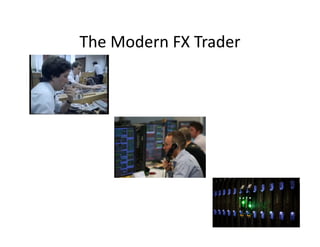
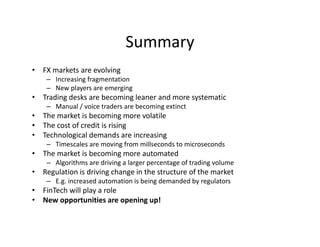
Inside the Modern FX Trading
Desk
Rory Winston
Outline
• Intro
• The FX Market
• FX Instruments and Transactions
• The Main Players
• What Moves The FX Markets
• Some Notable Events
• FX Algorithmic Trading
• Challenges
• Opportunities
About Me
• M. Sc. Computer Science/Physics, National
University Of Ireland
• M.Sc. Finance, London Business School
• Working in electronic FX market making for ~
10 years
• Currently working on an FX algorithmic trading
execution and liquidity management platform
The FX Market
• Decentralised $5+ trillion / day market
– There is no single ‘FX market’
– Cross-border, cross-regulation
• 24 hours / day, 5.5 days/week, 52 weeks / year
– 7am Auckland Monday to 5PM NYC Friday
• Main trading centres are London / US (NYC,
Chicago) / Singapore / HK / Tokyo
– 3 of the top 5 centres are in Asia
– Singapore increased its global share to ~ 8% in 2016
from ~ 5.7% in 2013
The FX Market
• Top traded currency
by volume is USD
• So-called ‘EM’
currencies now make
up a large percentage
of global flow
• NOTE: Gold and other
precious metals fall
under the umbrella of
FX
The Players
• Retail
• Banks / Financial Institutions
• Corporates
• Hedge Funds
• Central Banks
• Buy-Side Firms
• HFT / Market Makers
• Prime Brokers / Prime-of-primes
• Venues: Aggregators / ECNs / multi-dealer
platforms / single-dealer platforms / dark pools
The Players
FX Market Evolution
-
500
1,000
1,500
2,000
2,500
3,000
1989 1992 1995 1998 2001 2004 2007 2010 2013 2016
Spot
Forward
Swap
Infancy of
electronic
dealing
Prime
Brokerage
takes off
Post-SNB fines
and regulatory
scrutiny
FX Infrastructure
• Most electronic trading is colocated in the
major data centres in New York, Tokyo,
London, Chicago
• Clients trade via fast cross-connects within
data centres or optical fibre networks
between continents
• Every millisecond counts!
FX Trading Systems
What is an FX Transaction?
• Currencies are quoted for
trading purposes as A/B
– E.g. EUR/USD, USD/JPY,
AUD/USD
• Normally buy/sell currency
A in units of currency B
• A provider will ‘bid’ to buy
and ‘offer’ to sell
What is an FX Transaction?
Sell € 1,000,000 EUR
Buy $ 1,121,120 USD
@ $1.12112 $/€
Buy € 1,000,000 EUR
Sell $ 1,121,170 USD
@ $1.12117 $/€
Spread: 1.12117 – 1.12112 = 0.00005 = 0.5 pips
(1 pip = $0.0001)
LHS / Bid RHS / Offer
What is an FX Transaction?
• FX currency pairs can be ‘direct’ or ‘cross’
• Direct pairs are normally heavily-traded liquid instruments
• A ‘cross’ pair is one that can be created as a result of trading
two other currency pairs simultaneously
• E.g. a EURJPY price can be calculated from the output of a
simultaneous transaction in EURUSD and USDJPY
FX Products
• Spot: Delivery in T+2 / T+1
– Depending on currency
– Pre-spot: Delivery today (T) / tomorrow
• Forward – Delivery in T+N days
– E.g. 1 month, 3 months
• Swaps – Pair of offsetting transactions
– Normally spot + forward (or forward + forward)
– E.g. buy EURUSD spot, sell EURUSD 1 month forward
• Also: Options / futures / block trades etc
FX Products
OTC foreign exchange
turnover
Net-net basis,1
daily averages in April, in billions of US
dollars
Table 1
Instrument 2001 2004 2007 2010 2013 2016
Foreign exchange instruments 1,239 1,934 3,324 3,971 5,355 5,088
Spot transactions 386 631 1,005 1,488 2,046 1,654
Outright forwards 130 209 362 475 679 700
Foreign exchange swaps 656 954 1,714 1,759 2,239 2,383
Currency swaps 7 21 31 43 54 96
Options and other products² 60 119 212 207 337 254
FX Trading Activity
• Retail consumers
• Corporates
– Hedging
– Dividends/M&A/repatriation
• Banks and Financial Institutions
– Hedging/speculation
• Hedge Funds
– Hedging/speculation
• Asset managers/custodians
– Benchmarking/portfolio rebalancing/overlay
• Central Banks
– Intervention
• Trading Platforms / Aggregators
What Moves The Markets?
• Many schools of thought
– Macroeconomic / Microeconomic
– Interest rate differentials
– Purchasing Power Parity
– GDP
– Short-term order flow imbalance
• FX is an event-driven market
– Economic announcements and events can move the
market significantly
• Political and geopolitical Events
What Moves The Markets?
FX Market Volatility
• Volatility (V): measure of the standard deviation of
returns over a given period
• Volatility of volatility (V2): measure of how much
returns alternate between quiet and volatile changes
• The distribution of V and is V2 is increasingly skewed
• The market is becoming more ‘choppy’
Volatility of volatility 2013 2016
Instrument Mean Median Mean Median
EURUSD 6.20% 6.00% 7.00% 6.30%
USDJPY 8.10% 7.80% 8.30% 7.40%
USDZAR 11.20% 10.30% 17.00% 17.20%
USDTRY 5.20% 4.60% 11.60% 10.60%
EURPLN 6.60% 6.10% 11.80% 10.40%
EURHUF 7.90% 7.40% 8.70% 8.50%
Flash Crash, May 5th 2010
Maximum EURUSD Volatility: 220%
Japanese Tsunami, Mar 11th 2011
Maximum USDJPY Volatility: 160%
SNB De-Peg, Jan 15th 2015
Maximum EURCHF Volatility up to 800%
(Volatility still up to 220% 12 minutes after the event)
Dow Jones ‘Tantrum’ 24th Aug 2015
Maximum AUDUSD Volatility up to 2000%
Brexit 23rd/24th June 2016
Maximum GBPUSD Volatility up to 1200%
Brexit 23rd/24th June 2016
BOJ 28th April 2016
Maximum USDJPY Volatility up to 1300%
NFP 8th July 2016
Maximum EURUSD Volatility up to 1000%
FX Algorithms
• A lot of FX trading is done through automated
computer-driven algorithms
– This may be a factor that exacerbates volatility spikes
• Algos fall into various categories depending on
their purpose
– Aggressive vs Passive
– Dynamic vs static
– Liquidity-seeking vs liquidity providing
– Opportunistic vs predetermined
FX Algorithms
• Algorithms act on input signals (e.g. prices,
volatilities, liquidity indicators and take action
• Typically will attempt to find the optimal balance
between risk and return (optimal execution)
• Minimise ‘Implementation Shortfall’ or slippage
FX Algorithms
• Sweep
– Aggressive strategy that tries to get liquidity by trading
across multiple liquidity pools simultaneously
– High market impact
– Sensitive to liquidity pool selection
• Iceberg
– Passive strategy that places passive orders showing only
part of the order
– When the visible part of the order is matched the algo
replenishes the amount in the market
– Low market impact
– Attempts to minimize information leakage
FX Algorithms
• Peg
– Keeps orders in the market at a fixed distance from a
predefined reference price
– As the reference price updates, the algo replaces the order
at the updated level
– Generally passive (but can vary)
• TWAP
– Splits a larger order into smaller sub-orders worked over a
longer execution period
– Generally low market impact, but can be more aggressive
– Designed to minimise information leakage and price
slippage
TCA
• Transaction Cost Analysis
• Quantifying the performance of trading algorithms against
consistent benchmark
• Used to rank trading algo performance and improve them
Liquidmetrix.com
Modern Trading Challenges
• Managing market fragmentation
– Smart order routing
– Best execution and trade analysis
– Avoiding information leakage
• Managing the ‘data deluge’
– Billions of price ticks/day
– Need to be stored and analysed
– Specialised databases and analytical software
• Credit Management
• Latency and Connectivity
Regulatory Challenges
• The FX market is in a period of change /
evolution
• Increased regulatory constraints have placed
brakes on market activity
• Cost of compliance and credit has risen
– Banks spend a higher % on compliance than ever
• Global FX Code of Conduct being developed
• Regulation is driving automation
Challenges For Modern Banks
UBS Trading Floor,
Stamford , 2008
zerohedge.com
UBS Trading Floor,
Stamford , 2016
Trading Desk Roles
• Quantitative Analysts
– Use analytical tools to devise pricing, trading and risk management strategies
– Backtest and implement trading algorithms
– Mix of mathematical and programming skills
– Quants are becoming more ‘applied’
• FX (Voice) traders
– The traditional FX trader role
– Take orders directly from clients and manage order flow
– Take a limited amount of discretionary risk
• eFX Traders
– Monitor trading flow and manage client orders
– Manually intervene when required
– Adjust client pricing and analyse deal flow
– ‘execution consultants’
• eFX Sales
– Client management
– Maintain dialogue with clients
– Help clients get the optimum setup for their needs
Trading Desk Roles
• Liquidity Management
– Manage external liquidity provider relationships
– Systematically analyse relationships and make changes
based on the data
• Credit Management
– Maintain and set up credit lines
– Monitor credit usage
– Interface to market risk / credit risk / compliance
• Client Services
– Connectivity management
– Client queries and problem resolution
– Need detailed knowledge of client setup
Trading Desk Roles
Liquidity
Management
Risk
Quantitative
Research and
Analysis
Client Services
Trading
Sales
Credit
Client Services
and Connectivity
Development and
Testing
Compliance
Support
Treasury
The Evolution of the FX Trading Desk
The Modern FX Trader
Summary
• FX markets are evolving
– Increasing fragmentation
– New players are emerging
• Trading desks are becoming leaner and more systematic
– Manual / voice traders are becoming extinct
• The market is becoming more volatile
• The cost of credit is rising
• Technological demands are increasing
– Timescales are moving from millseconds to microseconds
• The market is becoming more automated
– Algorithms are driving a larger percentage of trading volume
• Regulation is driving change in the structure of the market
– E.g. increased automation is being demanded by regulators
• FinTech will play a role
• New opportunities are opening up!
References
• http://stats.bis.org
• http://www.fxstreet.com
• http://www.bloomberg.com/markets/currencies
• http://www.reuters.com/finance/currencies
• www.courant.nyu.edu/~almgren/papers/optliq.pdf

The Modern FX Desk

  • 1.
    Inside the ModernFX Trading Desk Rory Winston
  • 2.
    Outline • Intro • TheFX Market • FX Instruments and Transactions • The Main Players • What Moves The FX Markets • Some Notable Events • FX Algorithmic Trading • Challenges • Opportunities
  • 3.
    About Me • M.Sc. Computer Science/Physics, National University Of Ireland • M.Sc. Finance, London Business School • Working in electronic FX market making for ~ 10 years • Currently working on an FX algorithmic trading execution and liquidity management platform
  • 4.
    The FX Market •Decentralised $5+ trillion / day market – There is no single ‘FX market’ – Cross-border, cross-regulation • 24 hours / day, 5.5 days/week, 52 weeks / year – 7am Auckland Monday to 5PM NYC Friday • Main trading centres are London / US (NYC, Chicago) / Singapore / HK / Tokyo – 3 of the top 5 centres are in Asia – Singapore increased its global share to ~ 8% in 2016 from ~ 5.7% in 2013
  • 5.
    The FX Market •Top traded currency by volume is USD • So-called ‘EM’ currencies now make up a large percentage of global flow • NOTE: Gold and other precious metals fall under the umbrella of FX
  • 6.
    The Players • Retail •Banks / Financial Institutions • Corporates • Hedge Funds • Central Banks • Buy-Side Firms • HFT / Market Makers • Prime Brokers / Prime-of-primes • Venues: Aggregators / ECNs / multi-dealer platforms / single-dealer platforms / dark pools
  • 7.
  • 8.
    FX Market Evolution - 500 1,000 1,500 2,000 2,500 3,000 19891992 1995 1998 2001 2004 2007 2010 2013 2016 Spot Forward Swap Infancy of electronic dealing Prime Brokerage takes off Post-SNB fines and regulatory scrutiny
  • 9.
    FX Infrastructure • Mostelectronic trading is colocated in the major data centres in New York, Tokyo, London, Chicago • Clients trade via fast cross-connects within data centres or optical fibre networks between continents • Every millisecond counts!
  • 10.
  • 11.
    What is anFX Transaction? • Currencies are quoted for trading purposes as A/B – E.g. EUR/USD, USD/JPY, AUD/USD • Normally buy/sell currency A in units of currency B • A provider will ‘bid’ to buy and ‘offer’ to sell
  • 12.
    What is anFX Transaction? Sell € 1,000,000 EUR Buy $ 1,121,120 USD @ $1.12112 $/€ Buy € 1,000,000 EUR Sell $ 1,121,170 USD @ $1.12117 $/€ Spread: 1.12117 – 1.12112 = 0.00005 = 0.5 pips (1 pip = $0.0001) LHS / Bid RHS / Offer
  • 13.
    What is anFX Transaction? • FX currency pairs can be ‘direct’ or ‘cross’ • Direct pairs are normally heavily-traded liquid instruments • A ‘cross’ pair is one that can be created as a result of trading two other currency pairs simultaneously • E.g. a EURJPY price can be calculated from the output of a simultaneous transaction in EURUSD and USDJPY
  • 14.
    FX Products • Spot:Delivery in T+2 / T+1 – Depending on currency – Pre-spot: Delivery today (T) / tomorrow • Forward – Delivery in T+N days – E.g. 1 month, 3 months • Swaps – Pair of offsetting transactions – Normally spot + forward (or forward + forward) – E.g. buy EURUSD spot, sell EURUSD 1 month forward • Also: Options / futures / block trades etc
  • 15.
    FX Products OTC foreignexchange turnover Net-net basis,1 daily averages in April, in billions of US dollars Table 1 Instrument 2001 2004 2007 2010 2013 2016 Foreign exchange instruments 1,239 1,934 3,324 3,971 5,355 5,088 Spot transactions 386 631 1,005 1,488 2,046 1,654 Outright forwards 130 209 362 475 679 700 Foreign exchange swaps 656 954 1,714 1,759 2,239 2,383 Currency swaps 7 21 31 43 54 96 Options and other products² 60 119 212 207 337 254
  • 16.
    FX Trading Activity •Retail consumers • Corporates – Hedging – Dividends/M&A/repatriation • Banks and Financial Institutions – Hedging/speculation • Hedge Funds – Hedging/speculation • Asset managers/custodians – Benchmarking/portfolio rebalancing/overlay • Central Banks – Intervention • Trading Platforms / Aggregators
  • 17.
    What Moves TheMarkets? • Many schools of thought – Macroeconomic / Microeconomic – Interest rate differentials – Purchasing Power Parity – GDP – Short-term order flow imbalance • FX is an event-driven market – Economic announcements and events can move the market significantly • Political and geopolitical Events
  • 18.
  • 19.
  • 20.
  • 21.
  • 22.
    FX Market Volatility •Volatility (V): measure of the standard deviation of returns over a given period • Volatility of volatility (V2): measure of how much returns alternate between quiet and volatile changes • The distribution of V and is V2 is increasingly skewed • The market is becoming more ‘choppy’ Volatility of volatility 2013 2016 Instrument Mean Median Mean Median EURUSD 6.20% 6.00% 7.00% 6.30% USDJPY 8.10% 7.80% 8.30% 7.40% USDZAR 11.20% 10.30% 17.00% 17.20% USDTRY 5.20% 4.60% 11.60% 10.60% EURPLN 6.60% 6.10% 11.80% 10.40% EURHUF 7.90% 7.40% 8.70% 8.50%
  • 23.
    Flash Crash, May5th 2010 Maximum EURUSD Volatility: 220%
  • 24.
    Japanese Tsunami, Mar11th 2011 Maximum USDJPY Volatility: 160%
  • 25.
    SNB De-Peg, Jan15th 2015 Maximum EURCHF Volatility up to 800% (Volatility still up to 220% 12 minutes after the event)
  • 26.
    Dow Jones ‘Tantrum’24th Aug 2015 Maximum AUDUSD Volatility up to 2000%
  • 27.
    Brexit 23rd/24th June2016 Maximum GBPUSD Volatility up to 1200%
  • 28.
  • 29.
    BOJ 28th April2016 Maximum USDJPY Volatility up to 1300%
  • 30.
    NFP 8th July2016 Maximum EURUSD Volatility up to 1000%
  • 31.
    FX Algorithms • Alot of FX trading is done through automated computer-driven algorithms – This may be a factor that exacerbates volatility spikes • Algos fall into various categories depending on their purpose – Aggressive vs Passive – Dynamic vs static – Liquidity-seeking vs liquidity providing – Opportunistic vs predetermined
  • 32.
    FX Algorithms • Algorithmsact on input signals (e.g. prices, volatilities, liquidity indicators and take action • Typically will attempt to find the optimal balance between risk and return (optimal execution) • Minimise ‘Implementation Shortfall’ or slippage
  • 33.
    FX Algorithms • Sweep –Aggressive strategy that tries to get liquidity by trading across multiple liquidity pools simultaneously – High market impact – Sensitive to liquidity pool selection • Iceberg – Passive strategy that places passive orders showing only part of the order – When the visible part of the order is matched the algo replenishes the amount in the market – Low market impact – Attempts to minimize information leakage
  • 34.
    FX Algorithms • Peg –Keeps orders in the market at a fixed distance from a predefined reference price – As the reference price updates, the algo replaces the order at the updated level – Generally passive (but can vary) • TWAP – Splits a larger order into smaller sub-orders worked over a longer execution period – Generally low market impact, but can be more aggressive – Designed to minimise information leakage and price slippage
  • 35.
    TCA • Transaction CostAnalysis • Quantifying the performance of trading algorithms against consistent benchmark • Used to rank trading algo performance and improve them Liquidmetrix.com
  • 36.
    Modern Trading Challenges •Managing market fragmentation – Smart order routing – Best execution and trade analysis – Avoiding information leakage • Managing the ‘data deluge’ – Billions of price ticks/day – Need to be stored and analysed – Specialised databases and analytical software • Credit Management • Latency and Connectivity
  • 37.
  • 38.
  • 39.
    Regulatory Challenges • TheFX market is in a period of change / evolution • Increased regulatory constraints have placed brakes on market activity • Cost of compliance and credit has risen – Banks spend a higher % on compliance than ever • Global FX Code of Conduct being developed • Regulation is driving automation
  • 40.
    Challenges For ModernBanks UBS Trading Floor, Stamford , 2008 zerohedge.com UBS Trading Floor, Stamford , 2016
  • 41.
    Trading Desk Roles •Quantitative Analysts – Use analytical tools to devise pricing, trading and risk management strategies – Backtest and implement trading algorithms – Mix of mathematical and programming skills – Quants are becoming more ‘applied’ • FX (Voice) traders – The traditional FX trader role – Take orders directly from clients and manage order flow – Take a limited amount of discretionary risk • eFX Traders – Monitor trading flow and manage client orders – Manually intervene when required – Adjust client pricing and analyse deal flow – ‘execution consultants’ • eFX Sales – Client management – Maintain dialogue with clients – Help clients get the optimum setup for their needs
  • 42.
    Trading Desk Roles •Liquidity Management – Manage external liquidity provider relationships – Systematically analyse relationships and make changes based on the data • Credit Management – Maintain and set up credit lines – Monitor credit usage – Interface to market risk / credit risk / compliance • Client Services – Connectivity management – Client queries and problem resolution – Need detailed knowledge of client setup
  • 43.
    Trading Desk Roles Liquidity Management Risk Quantitative Researchand Analysis Client Services Trading Sales Credit Client Services and Connectivity Development and Testing Compliance Support Treasury
  • 44.
    The Evolution ofthe FX Trading Desk
  • 45.
    The Evolution ofthe FX Trading Desk
  • 46.
    The Evolution ofthe FX Trading Desk
  • 47.
  • 48.
    Summary • FX marketsare evolving – Increasing fragmentation – New players are emerging • Trading desks are becoming leaner and more systematic – Manual / voice traders are becoming extinct • The market is becoming more volatile • The cost of credit is rising • Technological demands are increasing – Timescales are moving from millseconds to microseconds • The market is becoming more automated – Algorithms are driving a larger percentage of trading volume • Regulation is driving change in the structure of the market – E.g. increased automation is being demanded by regulators • FinTech will play a role • New opportunities are opening up!
  • 49.
    References • http://stats.bis.org • http://www.fxstreet.com •http://www.bloomberg.com/markets/currencies • http://www.reuters.com/finance/currencies • www.courant.nyu.edu/~almgren/papers/optliq.pdf