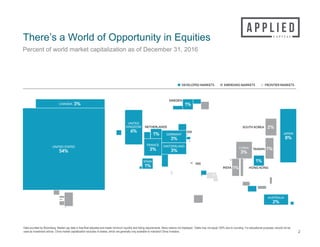
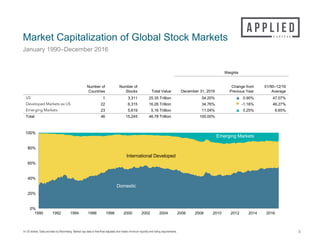
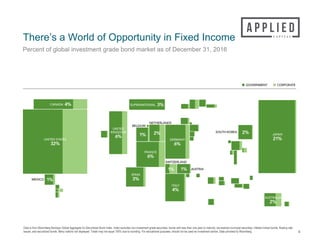
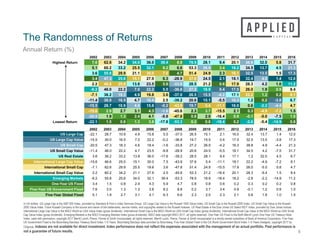
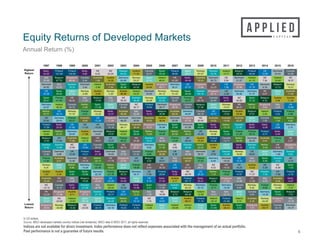
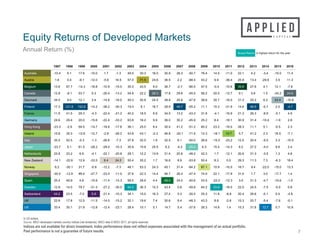
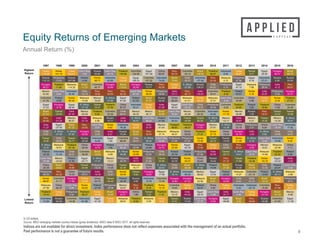
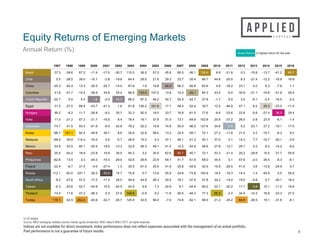
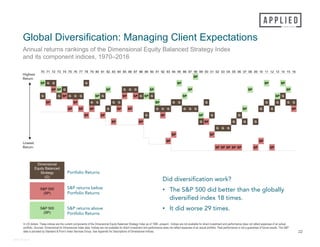
SlideShare a Scribd company logo
The Case for Global Diversification
There’s a World of Opportunity in Equities
2
Percent of world market capitalization as of December 31, 2016
Data provided by Bloomberg. Market cap data is free-float adjusted and meets minimum liquidity and listing requirements. Many nations not displayed. Totals may not equal 100% due to rounding. For educational purposes; should not be
used as investment advice. China market capitalization excludes A-shares, which are generally only available to mainland China investors.
In US dollars. Data provided by Bloomberg. Market cap data is free-float adjusted and meets minimum liquidity and listing requirements.
Market Capitalization of Global Stock Markets
January 1990–December 2016
3
Weights
Number of
Countries
Number of
Stocks Total Value December 31, 2016
Change from
Previous Year
01/90–12/16
Average
US 1 3,311 25.35 Trillion 54.20% p 0.90% 47.07%
Developed Markets ex US 22 6,315 16.26 Trillion 34.76% q -1.16% 46.27%
Emerging Markets 23 5,619 5.16 Trillion 11.04% p 0.25% 6.65%
Total 46 15,245 46.78 Trillion 100.00%
0%
20%
40%
60%
80%
100%
1990 1992 1994 1996 1998 2000 2002 2004 2006 2008 2010 2012 2014 2016
International Developed
Domestic
Emerging Markets
There’s a World of Opportunity in Fixed Income
4
Percent of global investment grade bond market as of December 31, 2016
Data is from Bloomberg Barclays Global Aggregate Ex-Securitized Bond Index. Index excludes non-investment grade securities, bonds with less than one year to maturity, tax-exempt municipal securities, inflation-linked bonds, floating rate
issues, and securitized bonds. Many nations not displayed. Totals may not equal 100% due to rounding. For educational purposes; should not be used as investment advice. Data provided by Bloomberg.
The Randomness of Returns
5
Annual Return (%)
In US dollars. US Large Cap is the S&P 500 Index, provided by Standard & Poor’s Index Services Group. US Large Cap Value is the Russell 1000 Value Index. US Small Cap is the Russell 2000 Index. US Small Cap Value is the Russell
2000 Value Index. Frank Russell Company is the source and owner of the trademarks, service marks, and copyrights related to the Russell Indexes. US Real Estate is the Dow Jones US Select REIT Index, provided by Dow Jones indices.
International Large Cap Value is the MSCI World ex USA Value Index (gross dividends). International Small Cap is the MSCI World ex USA Small Cap Index (gross dividends). International Small Cap Value is the MSCI World ex USA Small
Cap Value Index (gross dividends). Emerging Markets is the MSCI Emerging Markets Index (gross dividends). MSCI data copyright MSCI 2017, all rights reserved. One-Year US Fixed is the BofA Merrill Lynch One-Year US Treasury Note
Index, used with permission; copyright 2017 Merrill Lynch, Pierce, Fenner & Smith Incorporated; all rights reserved. Merrill Lynch, Pierce, Fenner & Smith Incorporated is a wholly owned subsidiary of Bank of America Corporation. Five-Year
US Government Fixed is the Bloomberg Barclays Treasury Bond Index 1–5 Years. Bloomberg Barclays data provided by Bloomberg. Five-Year Global Fixed is the Citi World Government Bond Index 1–5 Years (hedged), copyright 2017 by
Citigroup. Indexes are not available for direct investment. Index performance does not reflect the expenses associated with the management of an actual portfolio. Past performance is
not a guarantee of future results.
2002 2003 2004 2005 2006 2007 2008 2009 2010 2011 2012 2013 2014 2015 2016
Highest Return 7.6 62.6 34.2 34.0 36.0 39.4 8.8 78.5 28.1 9.4 20.1 38.8 32.0 5.8 31.7
5.1 60.2 33.2 25.5 32.1 8.2 6.6 53.3 26.9 3.4 18.2 34.5 13.7 4.5 21.3
3.6 55.8 29.9 21.1 30.0 7.5 4.7 51.4 24.9 2.3 18.1 32.5 13.5 1.5 17.3
3.4 47.3 25.6 15.1 27.9 6.3 -28.9 37.6 24.5 2.1 18.1 32.4 4.9 1.4 12.0
2.2 46.6 25.0 13.8 23.5 5.9 -33.8 28.5 21.2 0.6 17.9 28.3 4.2 1.0 11.2
-6.2 46.0 22.2 7.0 22.2 5.5 -36.8 27.2 18.9 0.4 17.5 26.0 1.9 0.9 8.4
-7.1 36.2 18.3 4.9 19.8 3.6 -37.0 26.5 15.5 -4.2 17.1 22.2 1.2 0.2 8.1
-11.4 30.0 16.5 4.7 18.4 2.5 -39.2 20.6 15.1 -5.5 16.3 1.2 0.2 -3.8 6.7
-15.5 28.7 10.9 4.6 15.8 -0.2 -43.9 19.7 5.4 -11.1 16.0 0.6 -2.2 -4.4 4.7
-15.6 2.0 2.7 3.1 4.3 -1.6 -45.6 2.3 3.7 -15.5 2.1 0.3 -4.9 -7.2 1.5
-20.5 1.9 1.3 2.4 4.1 -9.8 -47.8 0.8 2.0 -16.4 0.9 -0.1 -5.0 -7.5 1.0
Lowest Return -22.1 1.5 0.8 1.3 3.8 -17.6 -53.3 0.2 0.8 -18.4 0.2 -2.6 -5.4 -14.9 0.8
2002 2003 2004 2005 2006 2007 2008 2009 2010 2011 2012 2013 2014 2015 2016
US Large Cap -22.1 28.7 10.9 4.9 15.8 5.5 -37.0 26.5 15.1 2.1 16.0 32.4 13.7 1.4 12.0
US Large Cap Value -15.5 30.0 16.5 7.0 22.2 -0.2 -36.8 19.7 15.5 0.4 17.5 32.5 13.5 -3.8 17.3
US Small Cap -20.5 47.3 18.3 4.6 18.4 -1.6 -33.8 27.2 26.9 -4.2 16.3 38.8 4.9 -4.4 21.3
US Small Cap Value -11.4 46.0 22.2 4.7 23.5 -9.8 -28.9 20.6 24.5 -5.5 18.1 34.5 4.2 -7.5 31.7
US Real Estate 3.6 36.2 33.2 13.8 36.0 -17.6 -39.2 28.5 28.1 9.4 17.1 1.2 32.0 4.5 6.7
International Large Cap Value -15.6 46.6 25.0 15.1 30.0 7.5 -43.9 37.6 5.4 -11.1 18.1 22.2 -4.9 -7.2 8.1
International Small Cap -7.1 62.6 29.9 25.5 19.8 3.6 -47.8 51.4 24.9 -15.5 17.9 26.0 -5.0 5.8 4.7
International Small Cap Value 2.2 60.2 34.2 21.1 27.9 2.5 -45.6 53.3 21.2 -16.4 20.1 28.3 -5.4 1.5 8.4
Emerging Markets -6.2 55.8 25.6 34.0 32.1 39.4 -53.3 78.5 18.9 -18.4 18.2 -2.6 -2.2 -14.9 11.2
One-Year US Fixed 3.4 1.5 0.8 2.4 4.3 5.9 4.7 0.8 0.8 0.6 0.2 0.3 0.2 0.2 0.8
Five-Year US Government Fixed 7.6 2.0 1.3 1.3 3.8 8.2 8.8 0.2 3.7 3.4 0.9 -0.1 1.2 0.9 1.0
Five-Year Global Fixed 5.1 1.9 2.7 3.1 4.1 6.3 6.6 2.3 2.0 2.3 2.1 0.6 1.9 1.0 1.5
Equity Returns of Developed Markets
6
Annual Return (%)
In US dollars.
Source: MSCI developed markets country indices (net dividends). MSCI data © MSCI 2017, all rights reserved.
Indices are not available for direct investment. Index performance does not reflect expenses associated with the management of an actual portfolio.
Past performance is not a guarantee of future results.
1997 1998 1999 2000 2001 2002 2003 2004 2005 2006 2007 2008 2009 2010 2011 2012 2013 2014 2015 2016
Switz.
44.25
Finland
121.64
Finland
152.60
Switz.
5.85
NZ
8.42
NZ
24.24
Sweden
64.53
Austria
71.52
Canada
28.31
Spain
49.36
Finland
48.65
Japan
-29.21
Norway
87.07
Sweden
33.75
Ireland
13.71
Belgium
39.55
Finland
46.04
US
12.69
Denmark
23.43
Canada
24.56
Italy
35.48
Belgium
67.75
Singapore
99.40
Canada
5.34
Australia
1.68
Austria
16.55
Germany
63.80
Norway
53.27
Japan
25.52
Ireland
46.81
HK
41.20
Switz.
-30.49
Australia
76.43
Denmark
30.73
NZ
5.54
Denmark
31.27
Ireland
41.15
NZ
7.34
Ireland
16.49
NZ
18.37
Denmark
34.52
Italy
52.52
Sweden
79.74
Denmark
3.44
Ireland
-2.80
Australia
-1.34
Spain
58.46
Belgium
43.53
Austria
24.64
Singapore
46.71
Germany
35.21
US
-37.57
Singapore
73.96
HK
23.23
US
1.36
Singapore
30.96
US
31.79
Denmark
6.18
Belgium
12.10
Norway
13.31
US
33.38
Spain
49.90
Japan
61.53
Norway
-0.89
Austria
-5.65
Norway
-7.26
Austria
56.96
Ireland
43.07
Denmark
24.50
Norway
45.12
Norway
31.43
Spain
-40.60
Sweden
64.16
Singapore
22.14
UK
-2.56
Germany
30.90
Germany
31.37
HK
5.07
Japan
9.57
Australia
11.45
Spain
25.41
France
41.54
HK
59.52
Italy
-1.33
Belgium
-10.89
Italy
-7.33
NZ
55.43
Sweden
36.28
Norway
24.26
Sweden
43.39
Canada
29.57
France
-43.27
HK
60.15
Canada
20.45
Switz.
-6.77
NZ
29.26
Spain
31.32
Belgium
4.12
Austria
3.46
Austria
11.26
Germany
24.57
Ireland
35.33
Canada
53.74
Nether.
-4.09
Spain
-11.36
Japan
-10.28
Canada
54.60
NZ
35.17
Finland
16.69
Denmark
38.77
Singapore
28.35
Canada
-45.51
Belgium
57.49
Japan
15.44
Norway
-10.01
HK
28.27
Nether.
31.30
Singapore
3.03
Italy
2.30
US
10.89
Nether.
23.77
US
30.14
Norway
31.70
France
-4.31
Norway
-12.22
Switz.
-10.31
Australia
49.46
Italy
32.49
Switz.
16.33
Belgium
36.66
Australia
28.34
Germany
-45.87
Canada
56.18
US
14.77
Belgium
-10.62
Austria
25.90
Belgium
27.61
Ireland
2.29
Finland
2.02
France
4.88
UK
22.62
Germany
29.43
France
29.27
Australia
-9.95
US
-12.39
Singapore
-11.05
Denmark
49.25
Denmark
30.82
Australia
16.02
Austria
36.54
Denmark
25.59
Singapore
-47.35
NZ
50.40
Australia
14.52
Australia
-10.95
Australia
22.07
Japan
27.16
Canada
1.50
Nether.
1.34
Nether.
4.82
Finland
17.28
Switz.
23.53
US
21.92
UK
-11.53
UK
-14.05
Canada
-13.19
Norway
48.11
Australia
30.34
Singapore
14.37
Germany
35.99
Spain
23.95
Denmark
-47.56
Spain
43.48
Switz.
11.79
Nether.
-12.12
Sweden
21.97
Switz.
26.61
Switz.
-0.09
US
0.69
Germany
2.75
Ireland
15.84
Nether.
23.23
Germany
20.04
Austria
-11.96
Denmark
-14.81
Belgium
-14.97
Ireland
43.83
Spain
28.93
Nether.
13.85
France
34.48
Nether.
20.59
Nether.
-48.22
UK
43.30
Norway
10.95
Spain
-12.28
France
21.29
France
26.33
Finland
-0.71
Switz.
0.44
Japan
2.38
Belgium
13.55
UK
17.80
Australia
17.62
Ireland
-12.73
HK
-18.61
UK
-15.23
France
40.22
HK
24.98
Sweden
10.31
Italy
32.49
France
13.24
UK
-48.34
Austria
43.20
Finland
10.28
Canada
-12.71
Nether.
20.59
Denmark
25.25
Australia
-3.41
France
-0.11
HK
2.27
Sweden
12.92
Sweden
13.96
NZ
12.90
US
-12.84
Canada
-20.43
Spain
-15.29
HK
38.10
Singapore
22.27
Germany
9.92
Nether.
31.38
NZ
8.90
Sweden
-49.86
Nether.
42.25
Austria
9.88
Japan
-14.33
Switz.
20.35
Sweden
24.50
Nether.
-3.46
HK
-0.54
Singapore
1.42
Canada
12.80
Denmark
8.99
UK
12.45
Finland
-14.21
Switz.
-21.38
Denmark
-16.03
Italy
37.83
Canada
22.20
France
9.88
Australia
30.86
UK
8.36
Italy
-49.98
Denmark
36.57
UK
8.76
Sweden
-15.98
Norway
18.65
UK
20.67
Japan
-4.02
Germany
-1.89
Sweden
0.62
France
11.94
Australia
6.07
Denmark
12.06
HK
-14.74
Nether.
-22.10
HK
-17.79
Singapore
37.60
UK
19.57
Belgium
9.05
UK
30.61
Italy
6.06
Australia
-50.67
France
31.83
Germany
8.44
Denmark
-16.02
US
15.33
Italy
20.43
Spain
-4.65
Sweden
-5.02
UK
-0.10
Norway
6.24
Japan
5.05
Nether.
6.88
Germany
-15.59
France
-22.36
Nether.
-20.83
Japan
35.91
France
18.48
HK
8.40
HK
30.35
US
5.44
HK
-51.21
Italy
26.57
NZ
8.32
HK
-16.02
UK
15.25
Austria
13.42
UK
-5.39
NZ
-6.26
Spain
-1.02
Austria
1.57
Austria
0.35
Spain
4.83
Spain
-15.86
Germany
-22.39
France
-21.18
Belgium
35.33
Germany
16.17
UK
7.35
Finland
29.94
Switz.
5.29
NZ
-53.79
US
26.25
Nether.
1.74
France
-16.87
Finland
14.57
NZ
11.27
Sweden
-7.55
UK
-7.56
Finland
-4.70
Australia
-10.44
HK
-2.92
Italy
-0.26
Belgium
-16.85
Singapore
-23.42
US
-23.09
Switz.
34.08
Japan
15.86
US
5.14
Switz.
27.40
Austria
2.17
Finland
-55.17
Switz.
25.31
Belgium
-0.42
Singapore
-17.92
Italy
12.48
HK
11.09
Italy
-9.53
Australia
-9.95
Switz.
-4.87
NZ
-14.15
Canada
-6.14
Switz.
-7.02
Sweden
-21.29
Italy
-26.59
Ireland
-26.24
UK
32.06
Switz.
14.96
Spain
4.41
Canada
17.80
Sweden
0.62
Norway
-64.24
Germany
25.15
France
-4.11
Germany
-18.08
Canada
9.09
Norway
9.40
France
-9.92
Norway
-14.99
Ireland
-7.07
HK
-23.29
Singapore
-12.88
Austria
-9.11
Singapore
-27.72
Sweden
-27.18
Finland
-30.31
US
28.41
Nether.
12.24
Italy
1.90
NZ
16.56
Belgium
-2.73
Belgium
-66.48
Ireland
12.28
Italy
-15.01
Italy
-23.18
Japan
8.18
Canada
5.63
Germany
-10.36
Spain
-15.64
Belgium
-7.57
Japan
-23.67
NZ
-22.62
Ireland
-12.63
Japan
-28.16
Japan
-29.40
Sweden
-30.49
Nether.
28.09
US
10.14
NZ
1.74
US
14.67
Japan
-4.23
Austria
-68.41
Finland
11.14
Ireland
-18.12
Finland
-31.90
Ireland
5.74
Australia
4.16
Norway
-22.04
Singapore
-17.71
Italy
-10.45
Singapore
-30.05
Norway
-30.06
Belgium
-14.26
NZ
-33.55
Finland
-38.18
Germany
-33.18
Finland
19.40
Finland
6.14
Ireland
-2.29
Japan
6.24
Ireland
-20.09
Ireland
-71.92
Japan
6.25
Spain
-21.95
Austria
-36.43
Spain
3.00
Singapore
1.70
Austria
-29.77
Canada
-24.16
Denmark
-15.77
Highest
Return
Lowest
Return
Equity Returns of Developed Markets
7
Annual Return (%)
In US dollars.
Source: MSCI developed markets country indices (net dividends). MSCI data © MSCI 2017, all rights reserved.
Indices are not available for direct investment. Index performance does not reflect expenses associated with the management of an actual portfolio.
Past performance is not a guarantee of future results.
1997 1998 1999 2000 2001 2002 2003 2004 2005 2006 2007 2008 2009 2010 2011 2012 2013 2014 2015 2016
Australia -10.4 6.1 17.6 -10.0 1.7 -1.3 49.5 30.3 16.0 30.9 28.3 -50.7 76.4 14.5 -11.0 22.1 4.2 -3.4 -10.0 11.4
Austria 1.6 0.4 -9.1 -12.0 -5.6 16.5 57.0 71.5 24.6 36.5 2.2 -68.4 43.2 9.9 -36.4 25.9 13.4 -29.8 3.5 11.3
Belgium 13.6 67.7 -14.3 -16.8 -10.9 -15.0 35.3 43.5 9.0 36.7 -2.7 -66.5 57.5 -0.4 -10.6 39.6 27.6 4.1 12.1 -7.6
Canada 12.8 -6.1 53.7 5.3 -20.4 -13.2 54.6 22.2 28.3 17.8 29.6 -45.5 56.2 20.5 -12.7 9.1 5.6 1.5 -24.2 24.6
Denmark 34.5 9.0 12.1 3.4 -14.8 -16.0 49.3 30.8 24.5 38.8 25.6 -47.6 36.6 30.7 -16.0 31.3 25.2 6.2 23.4 -15.8
Finland 17.3 121.6 152.6 -14.2 -38.2 -30.3 19.4 6.1 16.7 29.9 48.7 -55.2 11.1 10.3 -31.9 14.6 46.0 -0.7 2.0 -4.7
France 11.9 41.5 29.3 -4.3 -22.4 -21.2 40.2 18.5 9.9 34.5 13.2 -43.3 31.8 -4.1 -16.9 21.3 26.3 -9.9 -0.1 4.9
Germany 24.6 29.4 20.0 -15.6 -22.4 -33.2 63.8 16.2 9.9 36.0 35.2 -45.9 25.2 8.4 -18.1 30.9 31.4 -10.4 -1.9 2.8
Hong Kong -23.3 -2.9 59.5 -14.7 -18.6 -17.8 38.1 25.0 8.4 30.4 41.2 -51.2 60.2 23.2 -16.0 28.3 11.1 5.1 -0.5 2.3
Ireland 15.8 35.3 -12.6 -12.7 -2.8 -26.2 43.8 43.1 -2.3 46.8 -20.1 -71.9 12.3 -18.1 13.7 5.7 41.2 2.3 16.5 -7.1
Italy 35.5 52.5 -0.3 -1.3 -26.6 -7.3 37.8 32.5 1.9 32.5 6.1 -50.0 26.6 -15.0 -23.2 12.5 20.4 -9.5 2.3 -10.5
Japan -23.7 5.1 61.5 -28.2 -29.4 -10.3 35.9 15.9 25.5 6.2 -4.2 -29.2 6.3 15.4 -14.3 8.2 27.2 -4.0 9.6 2.4
Netherlands 23.8 23.2 6.9 -4.1 -22.1 -20.8 28.1 12.2 13.9 31.4 20.6 -48.2 42.3 1.7 -12.1 20.6 31.3 -3.5 1.3 4.8
New Zealand -14.1 -22.6 12.9 -33.5 8.4 24.2 55.4 35.2 1.7 16.6 8.9 -53.8 50.4 8.3 5.5 29.3 11.3 7.3 -6.3 18.4
Norway 6.2 -30.1 31.7 -0.9 -12.2 -7.3 48.1 53.3 24.3 45.1 31.4 -64.2 87.1 10.9 -10.0 18.7 9.4 -22.0 -15.0 13.3
Singapore -30.0 -12.9 99.4 -27.7 -23.4 -11.0 37.6 22.3 14.4 46.7 28.4 -47.4 74.0 22.1 -17.9 31.0 1.7 3.0 -17.7 1.4
Spain 25.4 49.9 4.8 -15.9 -11.4 -15.3 58.5 28.9 4.4 49.4 24.0 -40.6 43.5 -22.0 -12.3 3.0 31.3 -4.7 -15.6 -1.0
Sweden 12.9 14.0 79.7 -21.3 -27.2 -30.5 64.5 36.3 10.3 43.4 0.6 -49.9 64.2 33.8 -16.0 22.0 24.5 -7.5 -5.0 0.6
Switzerland 44.2 23.5 -7.0 5.9 -21.4 -10.3 34.1 15.0 16.3 27.4 5.3 -30.5 25.3 11.8 -6.8 20.4 26.6 -0.1 0.4 -4.9
UK 22.6 17.8 12.5 -11.5 -14.0 -15.2 32.1 19.6 7.4 30.6 8.4 -48.3 43.3 8.8 -2.6 15.3 20.7 -5.4 -7.6 -0.1
US 33.4 30.1 21.9 -12.8 -12.4 -23.1 28.4 10.1 5.1 14.7 5.4 -37.6 26.3 14.8 1.4 15.3 31.8 12.7 0.7 10.9
Boxed Return is highest return for the year.
Equity Returns of Emerging Markets
8
Annual Return (%)
In US dollars.
Source: MSCI emerging markets country indices (gross dividends). MSCI data © MSCI 2017, all rights reserved.
Indices are not available for direct investment. Index performance does not reflect expenses associated with the management of an actual portfolio.
Past performance is not a guarantee of future results.
1997 1998 1999 2000 2001 2002 2003 2004 2005 2006 2007 2008 2009 2010 2011 2012 2013 2014 2015 2016
Turkey
118.05
Korea
141.15
Turkey
252.41
Czech Rep.
1.62
Russia
55.85
Czech Rep.
44.16
Thailand
144.56
Colombia
132.95
Egypt
161.59
China
82.87
Peru
94.74
Colombia
-25.10
Brazil
128.62
Thailand
56.27
Indonesia
6.50
Turkey
64.87
Taiwan
9.77
Egypt
29.35
Hungary
36.31
Brazil
66.75
Russia
112.12
Philippines
13.45
Russia
247.06
Poland
-4.04
Korea
48.71
Indonesia
42.83
Turkey
125.88
Egypt
126.23
Colombia
107.52
Indonesia
74.83
Brazil
79.99
Chile
-35.37
Indonesia
127.63
Peru
53.35
Malaysia
0.12
Philippines
47.56
Egypt
8.18
Indonesia
27.21
Russia
5.00
Russia
55.93
Hungary
95.21
Thailand
11.56
Malaysia
114.33
Brazil
-11.37
Colombia
45.77
Hungary
30.69
Brazil
115.01
Hungary
92.49
Russia
73.77
Peru
62.55
Turkey
74.81
S. Africa
-37.89
Russia
104.91
Chile
44.81
Philippines
0.10
Egypt
47.10
Malaysia
7.68
Philippines
26.40
India
-6.12
Peru
55.61
Mexico
53.92
Czech Rep.
0.54
Indonesia
93.46
Chile
-15.14
Peru
19.92
Peru
30.50
Peru
94.32
Czech Rep.
87.25
Korea
58.00
Philippines
59.65
India
73.11
Peru
-40.11
India
102.81
Colombia
43.41
Thailand
-2.40
Poland
40.97
Korea
4.18
India
23.87
Philippines
-6.25
Hungary
35.37
Colombia
41.76
Poland
-6.69
Korea
92.42
Malaysia
-15.95
Mexico
18.55
S. Africa
27.99
Egypt
91.84
Poland
61.52
Brazil
57.05
Russia
55.93
China
66.24
Malaysia
-41.21
Turkey
98.49
Malaysia
37.01
Czech Rep.
-5.02
Colombia
35.89
China
3.96
Turkey
19.07
Korea
-6.30
Thailand
27.01
Egypt
31.23
Hungary
-8.16
Egypt
88.40
S. Africa
-17.19
Taiwan
10.47
Thailand
27.59
China
87.57
Indonesia
52.21
Turkey
56.94
India
51.00
Egypt
58.43
Czech Rep.
-42.75
Chile
86.73
Philippines
35.49
Colombia
-5.02
Thailand
34.94
Poland
3.62
Thailand
16.84
China
-7.62
Colombia
26.48
Brazil
27.34
Taiwan
-20.64
India
87.35
Mexico
-20.49
Thailand
5.25
Colombia
25.36
Chile
84.41
Mexico
48.32
Mexico
49.11
Brazil
45.80
Czech Rep.
55.93
Mexico
-42.94
Colombia
84.35
Indonesia
34.62
Korea
-11.76
Mexico
29.06
Russia
1.35
Peru
10.51
Taiwan
-10.97
Taiwan
19.59
Peru
20.50
India
-21.24
Mexico
80.07
India
-21.74
Malaysia
4.56
Russia
15.71
India
78.36
S. Africa
44.91
Czech Rep.
46.20
Poland
41.93
Indonesia
55.03
Taiwan
-45.88
Taiwan
80.25
S. Africa
34.21
Mexico
-12.11
India
25.97
Mexico
0.21
Taiwan
10.05
Mexico
-14.24
S. Africa
18.41
India
11.27
Egypt
-27.00
Brazil
67.23
Peru
-23.82
Czech Rep.
-2.01
Korea
8.62
Indonesia
78.20
Turkey
42.03
India
37.57
Mexico
41.44
Thailand
46.63
Thailand
-48.27
Hungary
77.61
Mexico
27.61
S. Africa
-14.36
China
23.10
Philippines
-2.01
China
8.26
Czech Rep.
-16.55
Indonesia
17.52
Chile
5.52
S. Africa
-27.56
S. Africa
57.20
Hungary
-26.80
Chile
-2.83
India
8.37
Russia
75.94
Brazil
36.47
Peru
35.00
Malaysia
37.14
Malaysia
46.07
China
-50.83
Thailand
77.31
Korea
27.15
China
-18.24
Hungary
22.79
India
-3.83
S. Africa
5.69
Chile
-16.85
Chile
16.81
Taiwan
-6.29
Chile
-28.50
Taiwan
52.71
Russia
-30.03
Indonesia
-8.49
Egypt
1.59
Colombia
66.93
Chile
29.01
S. Africa
28.34
Czech Rep.
34.68
Philippines
41.68
Philippines
-51.87
Korea
72.06
Taiwan
22.73
Russia
-19.30
Korea
21.48
S. Africa
-5.78
Czech Rep.
-2.42
Indonesia
-19.08
Korea
9.25
S. Africa
-8.18
Malaysia
-30.81
Thailand
47.16
China
-30.54
Hungary
-9.16
Poland
1.26
Czech Rep.
66.20
Philippines
26.58
Poland
24.96
Hungary
33.70
Korea
32.58
Egypt
-52.35
Peru
72.06
Turkey
21.24
Chile
-20.00
Peru
20.24
Hungary
-5.82
Mexico
-9.23
Malaysia
-20.06
China
1.11
Poland
-22.39
Indonesia
-31.53
Chile
39.01
Colombia
-38.85
Brazil
-16.99
Malaysia
-0.66
S. Africa
45.86
Korea
22.86
Philippines
23.92
Chile
29.33
Poland
25.79
Poland
-54.49
Philippines
67.98
India
20.95
Taiwan
-20.15
S. Africa
19.01
Czech Rep.
-8.10
Malaysia
-10.66
Thailand
-23.32
Poland
0.69
Czech Rep.
-22.69
Mexico
-33.53
Poland
31.50
Egypt
-43.71
S. Africa
-17.21
Mexico
-13.31
Philippines
42.76
India
19.11
Chile
21.62
Taiwan
20.90
Russia
24.79
Korea
-55.07
China
62.63
Russia
19.40
Peru
-21.37
Taiwan
17.66
Thailand
-14.34
Korea
-10.70
Egypt
-23.52
India
-1.43
China
-25.25
Brazil
-39.62
Peru
18.86
Taiwan
-44.90
Philippines
-19.29
China
-14.05
Taiwan
42.55
Malaysia
15.17
China
19.77
S. Africa
20.53
Chile
23.68
Brazil
-56.06
S. Africa
57.82
Poland
15.86
Brazil
-21.59
Russia
14.39
Brazil
-15.79
Chile
-12.20
Poland
-24.91
Czech Rep.
-2.45
Philippines
-62.59
Peru
-40.22
China
13.33
Philippines
-45.01
India
-19.45
Chile
-19.81
Korea
35.94
Taiwan
9.83
Hungary
18.50
Egypt
17.08
S. Africa
18.14
Indonesia
-56.20
Mexico
56.63
Egypt
12.42
Poland
-29.52
Malaysia
14.27
Colombia
-21.14
Poland
-13.60
S. Africa
-25.13
Malaysia
-3.89
Korea
-66.67
Colombia
-41.71
Hungary
11.66
Turkey
-45.65
China
-24.70
Taiwan
-24.45
Poland
35.48
Russia
5.69
Indonesia
15.76
Colombia
13.76
Hungary
16.80
Hungary
-61.53
Malaysia
52.06
Brazil
6.81
Hungary
-33.65
Chile
8.34
Chile
-21.41
Brazil
-13.74
Turkey
-31.55
Philippines
-6.10
Malaysia
-67.98
China
-42.37
Czech Rep.
5.35
Korea
-49.62
Poland
-27.44
Philippines
-28.98
Mexico
32.81
Peru
3.16
Thailand
9.16
Korea
13.19
Colombia
15.00
Turkey
-62.10
Poland
42.51
China
4.83
Turkey
-35.16
Indonesia
5.22
Indonesia
-23.10
Colombia
-19.80
Peru
-31.66
Turkey
-8.12
Thailand
-73.43
Turkey
-52.51
Philippines
3.32
Thailand
-56.27
Turkey
-32.66
Brazil
-30.65
Hungary
32.31
China
1.89
Taiwan
7.25
Thailand
11.61
Mexico
12.15
India
-64.63
Egypt
39.74
Czech Rep.
-1.66
India
-37.17
Czech Rep.
3.48
Turkey
-26.52
Hungary
-27.44
Brazil
-41.18
Mexico
-8.98
Indonesia
-74.06
Russia
-82.99
Colombia
-14.38
Indonesia
-61.90
Egypt
-41.30
Turkey
-35.70
Malaysia
26.61
Thailand
-0.92
Malaysia
2.29
Turkey
-6.97
Taiwan
9.13
Russia
-73.83
Czech Rep.
27.77
Hungary
-9.58
Egypt
-46.86
Brazil
0.34
Peru
-29.84
Russia
-45.86
Colombia
-41.80
Egypt
-11.39
Highest
Return
Lowest
Return
Equity Returns of Emerging Markets
9
Annual Return (%)
In US dollars.
Source: MSCI emerging markets country indices (gross dividends). MSCI data © MSCI 2017, all rights reserved.
Indices are not available for direct investment. Index performance does not reflect expenses associated with the management of an actual portfolio.
Past performance is not a guarantee of future results.
1997 1998 1999 2000 2001 2002 2003 2004 2005 2006 2007 2008 2009 2010 2011 2012 2013 2014 2015 2016
Brazil 27.3 -39.6 67.2 -11.4 -17.0 -30.7 115.0 36.5 57.0 45.8 80.0 -56.1 128.6 6.8 -21.6 0.3 -15.8 -13.7 -41.2 66.7
Chile 5.5 -28.5 39.0 -15.1 -2.8 -19.8 84.4 29.0 21.6 29.3 23.7 -35.4 86.7 44.8 -20.0 8.3 -21.4 -12.2 -16.8 16.8
China -25.3 -42.4 13.3 -30.5 -24.7 -14.0 87.6 1.9 19.8 82.9 66.2 -50.8 62.6 4.8 -18.2 23.1 4.0 8.3 -7.6 1.1
Colombia 41.8 -41.7 -14.4 -38.9 45.8 25.4 66.9 133.0 107.5 13.8 15.0 -25.1 84.3 43.4 -5.0 35.9 -21.1 -19.8 -41.8 26.5
Czech Republic -22.7 0.5 5.3 1.6 -2.0 44.2 66.2 87.3 46.2 34.7 55.9 -42.7 27.8 -1.7 -5.0 3.5 -8.1 -2.4 -16.5 -2.5
Egypt 31.2 -27.0 88.4 -43.7 -41.3 1.6 91.8 126.2 161.6 17.1 58.4 -52.4 39.7 12.4 -46.9 47.1 8.2 29.3 -23.5 -11.4
Hungary 95.2 -8.2 11.7 -26.8 -9.2 30.7 32.3 92.5 18.5 33.7 16.8 -61.5 77.6 -9.6 -33.6 22.8 -5.8 -27.4 36.3 35.4
India 11.3 -21.2 87.3 -21.7 -19.5 8.4 78.4 19.1 37.6 51.0 73.1 -64.6 102.8 20.9 -37.2 26.0 -3.8 23.9 -6.1 -1.4
Indonesia -74.1 -31.5 93.5 -61.9 -8.5 42.8 78.2 52.2 15.8 74.8 55.0 -56.2 127.6 34.6 6.5 5.2 -23.1 27.2 -19.1 17.5
Korea -66.7 141.1 92.4 -49.6 48.7 8.6 35.9 22.9 58.0 13.2 32.6 -55.1 72.1 27.2 -11.8 21.5 4.2 -10.7 -6.3 9.2
Malaysia -68.0 -30.8 114.3 -16.0 4.6 -0.7 26.6 15.2 2.3 37.1 46.1 -41.2 52.1 37.0 0.1 14.3 7.7 -10.7 -20.1 -3.9
Mexico 53.9 -33.5 80.1 -20.5 18.5 -13.3 32.8 48.3 49.1 41.4 12.2 -42.9 56.6 27.6 -12.1 29.1 0.2 -9.2 -14.2 -9.0
Peru 20.5 -40.2 18.9 -23.8 19.9 30.5 94.3 3.2 35.0 62.6 94.7 -40.1 72.1 53.3 -21.4 20.2 -29.8 10.5 -31.7 55.6
Philippines -62.6 13.5 3.3 -45.0 -19.3 -29.0 42.8 26.6 23.9 59.7 41.7 -51.9 68.0 35.5 0.1 47.6 -2.0 26.4 -6.3 -6.1
Poland -22.4 -6.7 31.5 -4.0 -27.4 1.3 35.5 61.5 25.0 41.9 25.8 -54.5 42.5 15.9 -29.5 41.0 3.6 -13.6 -24.9 0.7
Russia 112.1 -83.0 247.1 -30.0 55.9 15.7 75.9 5.7 73.8 55.9 24.8 -73.8 104.9 19.4 -19.3 14.4 1.4 -45.9 5.0 55.9
South Africa -8.2 -27.6 57.2 -17.2 -17.2 28.0 45.9 44.9 28.3 20.5 18.1 -37.9 57.8 34.2 -14.4 19.0 -5.8 5.7 -25.1 18.4
Taiwan -6.3 -20.6 52.7 -44.9 10.5 -24.5 42.5 9.8 7.3 20.9 9.1 -45.9 80.2 22.7 -20.2 17.7 9.8 10.1 -11.0 19.6
Thailand -73.4 11.6 47.2 -56.3 5.3 27.6 144.6 -0.9 9.2 11.6 46.6 -48.3 77.3 56.3 -2.4 34.9 -14.3 16.8 -23.3 27.0
Turkey 118.1 -52.5 252.4 -45.6 -32.7 -35.7 125.9 42.0 56.9 -7.0 74.8 -62.1 98.5 21.2 -35.2 64.9 -26.5 19.1 -31.6 -8.1
Boxed Return is highest return for the year.
In US dollars.
MSCI Country Indices (net dividends). MSCI data © MSCI 2017, all rights reserved. Indices are not available for direct investment. Their performance does not reflect the expenses associated with the management of an actual portfolio.
Past performance is not a guarantee of future results.
Best minus Worst Performing Developed Markets
10
Year Worst Performer (%) Best Performer (%)
Best – Worst
Return
Difference (%) Year Worst Performer (%) Best Performer (%)
Best – Worst
Return
Difference (%)
1988 New Zealand -13.8 Belgium 53.6 67.4 2003 Finland 19.4 Sweden 64.5 45.1
1989 Finland -9.6 Austria 103.9 113.5 2004 Finland 6.1 Austria 71.5 65.4
1990 New Zealand -37.7 UK 10.3 48.0 2005 Ireland -2.3 Canada 28.3 30.6
1991 Finland -18.1 Hong Kong 49.5 67.6 2006 Japan 6.2 Spain 49.4 43.1
1992 Denmark -28.2 Hong Kong 32.3 60.5 2007 Ireland -20.1 Finland 48.7 68.7
1993 USA 9.1 Hong Kong 116.7 107.6 2008 Ireland -71.9 Japan -29.2 42.7
1994 Hong Kong -28.9 Finland 52.2 81.1 2009 Japan 6.3 Norway 87.1 80.8
1995 Austria -4.7 Switzerland 44.1 48.8 2010 Spain -22.0 Sweden 33.8 55.7
1996 Japan -15.5 Spain 40.1 55.6 2011 Austria -36.4 Ireland 13.7 50.1
1997 Singapore -30.0 Switzerland 44.2 74.3 2012 Spain 3.0 Belgium 39.6 36.5
1998 Norway -30.1 Finland 121.6 151.7 2013 Singapore 1.7 Finland 46.0 44.3
1999 Belgium -14.3 Finland 152.6 166.9 2014 Austria -29.8 USA 12.7 42.5
2000 New Zealand -33.5 Switzerland 5.9 39.4 2015 Canada -24.2 Denmark 23.4 47.6
2001 Finland -38.2 New Zealand 8.4 46.6 2016 Denmark -15.8 Canada 24.6 40.3
2002 Germany -33.2 New Zealand 24.2 57.4
Average of Worst
Performers (%)
-17.5%
Average of Best
Performers (%)
47.4%
Average Best – Worst
Return Difference (%)
64.8%
In US dollars.
MSCI Emerging Markets Country Indices (gross dividends). MSCI data © MSCI 2017, all rights reserved. Indices are not available for direct investment. Their performance does not reflect the expenses associated with the management of
an actual portfolio. Past performance is not a guarantee of future results.
Best minus Worst Performing Emerging Markets
11
Year Worst Performer (%) Best Performer (%)
Best – Worst
Return
Difference (%) Year Worst Performer (%) Best Performer (%)
Best – Worst
Return
Difference (%)
1995 India -30.9 Peru 23.3 54.2 2006 Turkey -7.0 China 82.9 89.8
1996 Korea -38.1 Russia 152.9 191.1 2007 Taiwan 9.1 Peru 94.7 85.6
1997 Indonesia -74.1 Turkey 118.1 192.1 2008 Russia -73.8 Colombia -25.1 48.7
1998 Russia -83.0 Korea 141.1 224.1 2009
Czech
Republic
27.8 Brazil 128.6 100.8
1999 Colombia -14.4 Turkey 252.4 266.8 2010 Hungary -9.6 Thailand 56.3 65.8
2000 Indonesia -61.9
Czech
Republic
1.6 63.5 2011 Egypt -46.9 Indonesia 6.5 53.4
2001 Egypt -41.3 Russia 55.9 97.2 2012 Brazil 0.3 Turkey 64.9 64.5
2002 Turkey -35.7
Czech
Republic
44.2 79.9 2013 Peru -29.8 Taiwan 9.8 39.6
2003 Malaysia 26.6 Thailand 144.6 117.9 2014 Russia -45.9 Egypt 29.3 75.2
2004 Thailand -0.9 Colombia 133.0 133.9 2015 Colombia -41.8 Hungary 36.3 78.1
2005 Malaysia 2.3 Egypt 161.6 159.3 2016 Egypt -11.4 Brazil 66.7 78.1
Average of Worst
Performers (%)
-26.4%
Average of Best
Performers (%)
80.9%
Average Best – Worst
Return Difference (%)
107.3%
In US dollars. Sources: Dimensional for Dimensional Index data. See "Dimensional Equity Balanced Strategy Index Description" slide in the Appendix for more information. Indices are not available for direct investment and performance
does not reflect expenses of an actual portfolio. Past performance is not a guarantee of future results. The S&P data is provided by Standard & Poor's Index Services Group.
Global Balanced Equity Strategy Index vs. S&P 500 vs. T-Bills
Performance: January 1970–December 1979
12
Dimensional Equity
Balanced Strategy Index
$3.50
S&P 500
Index
$1.77
US One-Month
Treasury Bills
$1.84
#44915-0315
$0.00
$0.50
$1.00
$1.50
$2.00
$2.50
$3.00
$3.50
$4.00
1970 1971 1972 1973 1974 1975 1976 1977 1978 1979
In US dollars. Sources: Dimensional for Dimensional Index data. See "Dimensional Equity Balanced Strategy Index Description" slide in the Appendix for more information. Indices are not available for direct investment and performance
does not reflect expenses of an actual portfolio. Past performance is not a guarantee of future results. The S&P data is provided by Standard & Poor's Index Services Group.
Global Balanced Equity Strategy Index vs. S&P 500 vs. T-Bills
Performance: January 1980–December 1989
13
#44915-0315
Dimensional Equity
Balanced Strategy Index
$7.32
S&P 500
Index
$5.04
US One-Month
Treasury Bills
$2.34
$0.00
$1.00
$2.00
$3.00
$4.00
$5.00
$6.00
$7.00
$8.00
1980 1981 1982 1983 1984 1985 1986 1987 1988 1989
In US dollars. Sources: Dimensional for Dimensional Index data. See "Dimensional Equity Balanced Strategy Index Description" slide in the Appendix for more information. Indices are not available for direct investment and performance
does not reflect expenses of an actual portfolio. Past performance is not a guarantee of future results. The S&P data is provided by Standard & Poor's Index Services Group.
Global Balanced Equity Strategy Index vs. S&P 500 vs. T-Bills
Performance: January 1990–December 1999
14
#44915-0315
Dimensional Equity
Balanced Strategy Index
$3.59
S&P 500
Index
$5.33
US One-Month
Treasury Bills
$1.62
$0.00
$1.00
$2.00
$3.00
$4.00
$5.00
$6.00
1990 1991 1992 1993 1994 1995 1996 1997 1998 1999
In US dollars. Sources: Dimensional for Dimensional Index data. See "Dimensional Equity Balanced Strategy Index Description" slide in the Appendix for more information. Indices are not available for direct investment and performance
does not reflect expenses of an actual portfolio. Past performance is not a guarantee of future results. The S&P data is provided by Standard & Poor's Index Services Group.
Global Balanced Equity Strategy Index vs. S&P 500 vs. T-Bills
Performance: January 2000–December 2009
15
#44915-0315
Dimensional Equity
Balanced Strategy Index
$2.06
S&P 500
Index
$0.91
US One-Month
Treasury Bills
$1.31
$0.00
$0.50
$1.00
$1.50
$2.00
$2.50
$3.00
2000 2001 2002 2003 2004 2005 2006 2007 2008 2009
In US dollars. Sources: Dimensional for Dimensional Index data. See "Dimensional Equity Balanced Strategy Index Description" slide in the Appendix for more information. Indices are not available for direct investment and performance
does not reflect expenses of an actual portfolio. Past performance is not a guarantee of future results. The S&P data is provided by Standard & Poor's Index Services Group.
Global Balanced Equity Strategy Index vs. S&P 500 vs. T-Bills
Performance: January 2010–December 2016
16
#44915-0315
Dimensional Equity
Balanced Strategy Index
$2.12
S&P 500
Index
$2.33
US One-Month
Treasury Bills
$1.00
$0.00
$0.50
$1.00
$1.50
$2.00
$2.50
2010 2011 2012 2013 2014 2015 2016
In US dollars. Sources: Dimensional for Dimensional Index data. See "Dimensional Equity Balanced Strategy Index Description" slide in the Appendix for more information. Indices are not available for direct investment and performance
does not reflect expenses of an actual portfolio. Past performance is not a guarantee of future results. The S&P data is provided by Standard & Poor's Index Services Group.
Global Balanced Equity Strategy Index vs. S&P 500 vs. T-Bills
Performance: January 1970–December 2016
17
#44915-0315
One-Month
T-Bill
$9.21
Dimensional Equity
Balanced Strategy Index
$400.50
S&P 500
Index
$100.40
$0.0
$50.0
$100.0
$150.0
$200.0
$250.0
$300.0
$350.0
$400.0
$450.0
1970 1972 1974 1976 1978 1980 1982 1984 1986 1988 1990 1992 1994 1996 1998 2000 2002 2004 2006 2008 2010 2012 2014 2016
In US dollars. Sources: Dimensional for Dimensional Index data. Dimensional Equity Balanced Strategy Index vs. S&P 500: There are 444 overlapping 10-year periods. See "Dimensional Equity Balanced Strategy Index Description" slide
in the Appendix for more information. Indices are not available for direct investment and performance does not reflect expenses of an actual portfolio. Past performance is not a guarantee of future results. The S&P data is provided by
Standard & Poor's Index Services Group.
Global Exposure to Higher Expected Returns
10-Year Rolling Returns: January 1980–December 2016
18
The Dimensional Equity Balanced Strategy Index outperformed
the S&P 500 Index 84.0% of overlapping 10-year periods.
-5%
0%
5%
10%
15%
20%
25%
30%
1980
1981
1982
1983
1984
1985
1986
1987
1988
1989
1990
1991
1992
1993
1994
1995
1996
1997
1998
1999
2000
2001
2002
2003
2004
2005
2006
2007
2008
2009
2010
2011
2012
2013
2014
2015
2016
Dimensional Equity Balanced Strategy Index
S&P 500 Index
Date 1970 1971 1972 1973 1974 1975 1976 1977 1978 1979 1980 1981 1982 1983 1984 1985 1986 1987 1988 1989 1990 1991 1992 1993 1994 1995 1996 1997 1998 1999 2000 2001 2002 2003 2004 2005 2006 2007 2008 2009 2010 2011 2012 2013 2014 2015 2016
1970 -3.8
1971 4.0 12.4
1972 4.7 9.3 6.2
1973 2.5 4.7 1.0 -3.9
1974 2.7 4.4 1.9 -0.3 3.5
1975 4.2 5.9 4.3 3.7 7.7 12.0
1976 4.6 6.1 4.9 4.5 7.5 9.5 7.0
1977 7.1 8.7 8.1 8.5 11.8 14.7 16.1 25.9
1978 8.2 9.8 9.4 10.0 13.0 15.5 16.6 21.7 17.7
1979 7.7 9.1 8.6 9.0 11.3 12.9 13.2 15.3 10.3 3.4
1980 6.6 7.7 7.2 7.3 9.0 9.9 9.5 10.2 5.4 -0.3 -3.9
1981 7.0 8.0 7.6 7.8 9.3 10.2 9.9 10.4 6.9 3.5 3.6 11.5
1982 6.0 6.9 6.4 6.4 7.6 8.1 7.6 7.7 4.4 1.3 0.6 2.9 -5.0
1983 6.3 7.2 6.7 6.8 7.9 8.4 8.0 8.1 5.4 3.1 3.0 5.4 2.5 10.6
1984 6.1 6.8 6.4 6.4 7.4 7.8 7.3 7.4 5.0 3.0 2.9 4.7 2.5 6.4 2.4
1985 6.0 6.7 6.3 6.3 7.2 7.5 7.1 7.1 5.0 3.2 3.2 4.7 3.1 5.9 3.6 4.8
1986 6.2 6.9 6.5 6.6 7.4 7.7 7.4 7.4 5.5 4.1 4.2 5.6 4.4 6.9 5.7 7.4 10.1
1987 6.2 6.8 6.5 6.5 7.3 7.6 7.2 7.2 5.5 4.3 4.4 5.6 4.6 6.7 5.7 6.9 7.9 5.7
1988 6.4 7.0 6.7 6.8 7.5 7.8 7.5 7.5 6.0 4.9 5.0 6.2 5.5 7.3 6.7 7.8 8.8 8.1 10.6
1989 5.9 6.4 6.1 6.1 6.7 7.0 6.6 6.6 5.1 4.0 4.1 5.0 4.2 5.6 4.8 5.3 5.4 3.9 3.0 -4.1
1990 5.0 5.5 5.1 5.0 5.6 5.7 5.3 5.2 3.8 2.7 2.6 3.3 2.4 3.4 2.4 2.4 1.9 -0.1 -2.0 -7.7 -11.1
1991 4.7 5.1 4.8 4.7 5.2 5.3 4.9 4.8 3.4 2.4 2.3 2.9 2.1 2.9 2.0 1.9 1.4 -0.2 -1.7 -5.5 -6.1 -0.8
1992 4.6 5.0 4.7 4.6 5.0 5.1 4.7 4.6 3.3 2.4 2.3 2.8 2.1 2.8 2.0 1.9 1.5 0.1 -1.0 -3.7 -3.5 0.6 2.0
1993 5.2 5.6 5.3 5.2 5.7 5.8 5.5 5.4 4.2 3.4 3.4 4.0 3.4 4.1 3.5 3.6 3.5 2.6 2.1 0.5 1.6 6.3 10.0 18.8
1994 5.1 5.5 5.2 5.1 5.6 5.7 5.4 5.3 4.2 3.4 3.4 3.9 3.4 4.1 3.5 3.6 3.5 2.7 2.3 1.0 2.0 5.6 7.8 10.9 3.6
1995 4.2 4.5 4.2 4.1 4.5 4.6 4.2 4.1 3.0 2.2 2.1 2.5 1.9 2.4 1.8 1.7 1.4 0.5 -0.1 -1.6 -1.2 1.0 1.4 1.2 -6.5 -15.6
1996 4.0 4.3 4.0 3.9 4.2 4.3 3.9 3.8 2.7 1.9 1.8 2.2 1.6 2.1 1.5 1.4 1.1 0.2 -0.4 -1.6 -1.3 0.5 0.7 0.4 -5.0 -9.1 -2.0
1997 3.2 3.5 3.2 3.1 3.4 3.4 3.0 2.8 1.8 1.0 0.9 1.1 0.5 0.9 0.2 0.1 -0.3 -1.2 -1.9 -3.2 -3.0 -1.8 -2.0 -2.7 -7.5 -10.9 -8.5 -14.5
1998 2.2 2.4 2.0 1.9 2.1 2.0 1.6 1.4 0.3 -0.4 -0.6 -0.5 -1.1 -0.9 -1.6 -1.9 -2.4 -3.4 -4.1 -5.5 -5.7 -4.9 -5.5 -6.7 -11.1 -14.4 -14.0 -19.5 -24.2
1999 2.0 2.2 1.9 1.7 1.9 1.9 1.5 1.2 0.2 -0.5 -0.7 -0.5 -1.2 -1.0 -1.6 -1.9 -2.4 -3.3 -4.0 -5.2 -5.3 -4.6 -5.1 -6.1 -9.7 -12.1 -11.2 -14.1 -13.8 -2.1
2000 2.3 2.5 2.2 2.1 2.3 2.2 1.9 1.7 0.7 0.0 -0.1 0.0 -0.5 -0.3 -0.9 -1.1 -1.5 -2.2 -2.8 -3.9 -3.8 -3.1 -3.3 -4.0 -6.8 -8.5 -7.0 -8.2 -5.9 4.8 12.1
2001 2.7 2.9 2.6 2.5 2.7 2.7 2.3 2.1 1.2 0.6 0.5 0.7 0.1 0.4 -0.1 -0.3 -0.6 -1.2 -1.7 -2.6 -2.5 -1.6 -1.7 -2.1 -4.5 -5.6 -3.8 -4.1 -1.4 7.7 12.9 13.8
2002 2.9 3.2 2.9 2.8 3.0 3.0 2.7 2.5 1.7 1.0 0.9 1.2 0.7 1.0 0.5 0.4 0.2 -0.4 -0.8 -1.6 -1.4 -0.5 -0.5 -0.8 -2.7 -3.5 -1.6 -1.5 1.3 8.9 12.8 13.2 12.5
2003 3.4 3.6 3.3 3.3 3.5 3.5 3.2 3.1 2.3 1.7 1.6 1.9 1.5 1.8 1.4 1.3 1.1 0.6 0.3 -0.3 -0.1 0.8 1.0 0.9 -0.7 -1.2 0.8 1.2 4.0 10.8 14.3 15.0 15.7 18.9
2004 3.6 3.9 3.6 3.5 3.8 3.8 3.5 3.4 2.7 2.1 2.1 2.3 1.9 2.3 1.9 1.9 1.7 1.3 1.0 0.4 0.7 1.6 1.8 1.8 0.4 0.1 2.0 2.5 5.2 11.1 14.0 14.5 14.7 15.8 12.7
2005 3.8 4.0 3.8 3.7 3.9 3.9 3.7 3.6 2.9 2.3 2.3 2.6 2.2 2.5 2.2 2.2 2.0 1.6 1.4 0.9 1.2 2.1 2.3 2.3 1.1 0.8 2.6 3.2 5.6 10.7 13.0 13.2 13.1 13.3 10.6 8.4
2006 3.9 4.1 3.9 3.8 4.1 4.1 3.8 3.7 3.0 2.6 2.5 2.8 2.4 2.8 2.4 2.4 2.3 2.0 1.8 1.3 1.6 2.5 2.7 2.8 1.6 1.5 3.2 3.7 5.9 10.5 12.4 12.4 12.2 12.1 9.9 8.5 8.6
2007 3.7 3.9 3.7 3.6 3.8 3.8 3.6 3.5 2.8 2.3 2.3 2.5 2.2 2.5 2.1 2.1 2.0 1.6 1.4 1.0 1.3 2.1 2.2 2.3 1.2 1.0 2.5 2.9 4.9 8.7 10.1 9.9 9.2 8.6 6.1 4.0 1.9 -4.4
2008 3.5 3.6 3.4 3.3 3.6 3.6 3.3 3.2 2.5 2.1 2.0 2.2 1.9 2.2 1.9 1.8 1.7 1.4 1.1 0.7 1.0 1.7 1.8 1.8 0.8 0.6 1.9 2.3 4.0 7.3 8.4 7.9 7.1 6.3 3.9 1.8 -0.3 -4.5 -4.6
2009 3.7 3.9 3.7 3.7 3.9 3.9 3.7 3.6 2.9 2.5 2.5 2.7 2.4 2.7 2.4 2.4 2.3 1.9 1.8 1.4 1.7 2.4 2.6 2.6 1.7 1.5 2.9 3.3 4.9 8.1 9.1 8.8 8.2 7.6 5.8 4.5 3.5 1.9 5.2 15.9
2010 3.8 4.0 3.8 3.7 4.0 4.0 3.7 3.7 3.0 2.6 2.6 2.8 2.5 2.8 2.5 2.5 2.4 2.1 2.0 1.6 1.9 2.6 2.8 2.8 2.0 1.9 3.1 3.5 5.0 7.9 8.9 8.6 8.0 7.5 5.9 4.8 4.1 3.1 5.7 11.2 6.7
2011 3.5 3.7 3.5 3.4 3.6 3.6 3.4 3.3 2.7 2.3 2.2 2.4 2.2 2.4 2.1 2.1 2.0 1.7 1.5 1.2 1.4 2.1 2.2 2.2 1.4 1.2 2.4 2.7 4.1 6.6 7.4 7.0 6.3 5.6 4.1 2.9 2.0 0.7 2.1 4.4 -0.9 -8.0
2012 3.5 3.7 3.5 3.4 3.6 3.6 3.4 3.3 2.7 2.3 2.3 2.5 2.2 2.4 2.2 2.1 2.0 1.7 1.6 1.2 1.5 2.1 2.2 2.2 1.4 1.3 2.4 2.7 4.0 6.3 7.0 6.6 6.0 5.3 3.9 2.9 2.1 1.1 2.2 4.0 0.3 -2.8 2.7
2013 3.3 3.5 3.3 3.2 3.4 3.4 3.2 3.1 2.5 2.1 2.0 2.2 2.0 2.2 1.9 1.9 1.8 1.5 1.3 1.0 1.2 1.8 1.9 1.9 1.1 1.0 2.0 2.2 3.4 5.6 6.1 5.7 5.0 4.4 3.0 2.0 1.2 0.2 1.0 2.1 -1.0 -3.5 -1.1 -4.8
2014 3.1 3.2 3.0 2.9 3.1 3.1 2.9 2.8 2.2 1.8 1.8 2.0 1.7 1.9 1.6 1.6 1.5 1.2 1.0 0.7 0.9 1.4 1.5 1.5 0.7 0.6 1.5 1.7 2.8 4.7 5.2 4.7 4.1 3.4 2.1 1.1 0.3 -0.7 -0.2 0.6 -2.2 -4.3 -3.0 -5.8 -6.8
2015 2.9 3.1 2.9 2.8 2.9 2.9 2.7 2.6 2.1 1.7 1.6 1.8 1.5 1.7 1.4 1.4 1.3 1.0 0.8 0.5 0.7 1.2 1.3 1.2 0.5 0.4 1.2 1.4 2.4 4.2 4.6 4.1 3.5 2.8 1.5 0.6 -0.2 -1.1 -0.7 -0.1 -2.5 -4.3 -3.3 -5.3 -5.5 -4.2
2016 3.0 3.1 2.9 2.8 3.0 3.0 2.8 2.7 2.1 1.8 1.7 1.9 1.6 1.8 1.6 1.5 1.4 1.2 1.0 0.7 0.9 1.4 1.4 1.4 0.7 0.6 1.4 1.6 2.5 4.3 4.7 4.2 3.6 3.0 1.9 1.0 0.4 -0.4 0.0 0.6 -1.4 -2.7 -1.6 -2.6 -1.9 0.7 5.8
The difference is Positive 85.3% of the time.
The difference is Negative 14.7% of the
time.
In US dollars. The indices are not available for direct investment; therefore, their performance does not reflect the expenses associated with the management of an actual portfolio. Past performance is no guarantee of future results, and
there is always the risk that an investor may lose money.
Sources: Dimensional Index data compiled by Dimensional; the S&P data is provided by Standard & Poor’s Index Services Group. See "Dimensional Equity Balanced Strategy Index Description" slides in the Appendix for more information.
Global Exposure to Higher Expected Returns
Dimensional Equity Balanced Strategy Index minus S&P 500 Index
19
X.X Difference is positive
X.X Difference is negative
Annual: January 1970–December 2016
Global Diversification: Managing Client Expectations
Annual returns rankings of the Dimensional Equity Balanced Strategy Index
and its component indices, 1970–2016
20
In US dollars. These indices are the current components of the Dimensional Equity Balanced Strategy Index as of 1994 –present. Indices are not available for direct investment and performance does not reflect expenses of an actual
portfolio. Sources: Dimensional for Dimensional Index data. Indices are not available for direct investment and performance does not reflect expenses of an actual portfolio. Past performance is not a guarantee of future results. The S&P
data is provided by Standard & Poor's Index Services Group. See Appendix for Descriptions of Dimensional Indices.
Dimensional
Equity
Balanced
Strategy
Dimensional
US Small
Cap
Dimensional
International
Marketwide
Value
Dimensional
Emerging
Markets
S&P 500
Dimensional
US Small
Cap Value
Dimensional
International
Small Cap
Dimensional
Emerging
Markets
Value
Dimensional
US Large
Cap Value
Dow Jones
US Select
REIT Index
Dimensional
International
Small Cap
Value
Dimensional
Emerging
Markets
Small Cap
Highest
Return
Lowest
Return
70 71 72 73 74 75 76 77 78 79 80 81 82 83 84 85 86 87 88 89 90 91 92 93 94 95 96 97 98 99 00 01 02 03 04 05 06 07 08 09 10 11 12 13 14 15 16
In US dollars. These indices are the current components of the Dimensional Equity Balanced Strategy Index as of 1994 –present. Indices are not available for direct investment and performance does not reflect expenses of an actual
portfolio. Sources: Dimensional for Dimensional Index data. Indices are not available for direct investment and performance does not reflect expenses of an actual portfolio. Past performance is not a guarantee of future results. The S&P
data is provided by Standard & Poor's Index Services Group. See Appendix for Descriptions of Dimensional Indices.
Global Diversification: Managing Client Expectations
Annual returns rankings of the Dimensional Equity Balanced Strategy Index
and its component indices, 1970–2016
21
#44915-0315
S&P 500
(SP)
70 71 72 73 74 75 76 77 78 79 80 81 82 83 84 85 86 87 88 89 90 91 92 93 94 95 96 97 98 99 00 01 02 03 04 05 06 07 08 09 10 11 12 13 14 15 16
SP
SP SP SP SP
SP SP SP SP SP SP SP
SP SP SP
SP SP SP SP SP SP SP
SP SP SP SP
SP SP SP
SP SP
SP SP
SP SP SP SP SP SP SP
Highest
Return
Lowest
Return
In US dollars. These indices are the current components of the Dimensional Equity Balanced Strategy Index as of 1994 –present. Indices are not available for direct investment and performance does not reflect expenses of an actual
portfolio. Sources: Dimensional for Dimensional Index data. Indices are not available for direct investment and performance does not reflect expenses of an actual portfolio. Past performance is not a guarantee of future results. The S&P
data is provided by Standard & Poor's Index Services Group. See Appendix for Descriptions of Dimensional Indices.
Global Diversification: Managing Client Expectations
Annual returns rankings of the Dimensional Equity Balanced Strategy Index
and its component indices, 1970–2016
22
Did diversification work?
• The S&P 500 did better than the globally
diversified index 18 times.
• It did worse 29 times.
#44915-0315
Dimensional
Equity Balanced
Strategy
(G)
S&P 500
(SP)
S&P 500
(SP)
Portfolio Returns
S&P returns below
Portfolio Returns
S&P returns above
Portfolio Returns
70 71 72 73 74 75 76 77 78 79 80 81 82 83 84 85 86 87 88 89 90 91 92 93 94 95 96 97 98 99 00 01 02 03 04 05 06 07 08 09 10 11 12 13 14 15 16
SP
SP G G G SP SP SP
SP SP G SP G G G SP SP SP SP
G G SP G G G SP G SP SP G SP G SP SP G
SP SP G G G G SP G G G G G G G
SP SP SP G SP SP G G G G G G SP G G SP
SP SP G SP SP G G
SP SP G SP G G G
G G G
SP SP
SP SP
SP SP SP SP SP SP SP
Highest
Return
Lowest
Return
Appendix
Dimensional Equity Balanced Strategy Index Description
Rebalanced monthly. The Dimensional Equity Balanced Strategy
Index is comprised of commercial and Dimensional indices, 70%
US equity indices, and 30% non-US indices. US: S&P 500, large
cap value, small cap, small cap value, Dow Jones REIT; non-US:
international value, international small cap and small cap value,
emerging markets, and emerging markets value and small cap.
Additional index information is available upon request.
Real Estate Strategy weighting allocated evenly between US
Small Cap and US Small Cap Value prior to January 1978 data
inception.
International Value weighting allocated to Fama/French
International Value Index prior to January 1994 data inception,
and evenly between International Small Cap and MSCI EAFE
Index (net dividends) prior to January 1975 data inception.
International Small Cap Value weighting allocated to International
Small Cap prior to July 1981 data inception.
Emerging Markets weighting allocated to MSCI Emerging
Markets Index (gross dividends) prior to January 1994 data
inception, and evenly between International Small Cap and
International Value prior to January 1988 data inception.
Emerging Markets Value and Small Cap weighting allocated
evenly between International Small Cap and International Value
prior to January 1989 data inception. Two-Year Global weighting
allocated to One-Year prior to January 1985 data inception.
For illustrative purposes only. The balanced strategies are not
recommendations for an actual allocation.
Indices are not available for direct investment; their performance
does not reflect the expenses associated with the management of
an actual portfolio.
Rebalanced monthly. All performance results of the balanced
strategies are based on performance of indices with model/back-
tested asset allocations; the performance was achieved with the
benefit of hindsight; it does not represent actual investment
strategies. The model’s performance does not reflect advisory
fees or other expenses associated with the management of an
actual portfolio. There are limitations inherent in model
allocations. In particular, model performance may not reflect the
impact that economic and market factors may have had on the
advisor’s decision making if the advisor were actually managing
client money.
Past performance is no guarantee of future results.
#44915-0315
Descriptions of Dimensional Indices
Dimensional US Large Cap Value Index is compiled by Dimensional from CRSP
and Compustat data. Targets securities of US companies traded on the NYSE,
NYSE MKT (formerly AMEX), and Nasdaq Global Market with market capitalizations
above the 1,000th-largest company whose relative price is in the bottom 30% of the
Dimensional US Large Cap Index after the exclusion of utilities, companies lacking
financial data, and companies with negative relative price. The index emphasizes
securities with higher profitability, lower relative price, and lower market
capitalization. Profitability is measured as operating income before depreciation and
amortization minus interest expense scaled by book. Exclusions: non-US
companies, REITs, UITs, and investment companies. The index has been
retroactively calculated by Dimensional and did not exist prior to March 2007. The
calculation methodology for the Dimensional US Large Cap Value Index was
amended in January 2014 to include direct profitability as a factor in selecting
securities for inclusion in the index. Prior to January 1975: Targets securities of US
companies traded on the NYSE, NYSE MKT (formerly AMEX), and Nasdaq Global
Market with market capitalizations above the 1,000th-largest company whose
relative price is in the bottom 20% of the Dimensional US Large Cap Index after the
exclusion of utilities, companies lacking financial data, and companies with negative
relative price.
Dimensional US Small Cap Index was created by Dimensional in March 2007 and
is compiled by Dimensional. It represents a market-capitalization-weighted index of
securities of the smallest US companies whose market capitalization falls in the
lowest 8% of the total market capitalization of the Eligible Market. The Eligible
Market is composed of securities of US companies traded on the NYSE, NYSE MKT
(formerly AMEX), and Nasdaq Global Market. Exclusions: Non-US companies,
REITs, UITs, and investment companies. From January 1975 to the present, the
index also excludes companies with the lowest profitability and highest relative price
within the small cap universe. Profitability is measured as operating income before
depreciation and amortization minus interest expense scaled by book. Source:
CRSP and Compustat. The index monthly returns are computed as the simple
average of the monthly returns of 12 sub-indices, each one reconstituted once a
year at the end of a different month of the year. The calculation methodology for the
Dimensional US Small Cap Index was amended on January 1, 2014, to include
profitability as a factor in selecting securities for inclusion in the index.
Dimensional US Small Cap Value Index is compiled by Dimensional from CRSP
and Compustat data. Targets securities of US companies traded on the NYSE,
NYSE MKT (formerly AMEX), and Nasdaq Global Market whose relative price is in
the bottom 35% of the Dimensional US Small Cap Index after the exclusion of
utilities, companies lacking financial data, and companies with negative relative
price. The index emphasizes securities with higher profitability, lower relative price,
and lower market capitalization. Profitability is measured as operating income before
depreciation and amortization minus interest expense scaled by book. Exclusions:
non-US companies, REITs, UITs, and investment companies. The index has been
retroactively calculated by Dimensional and did not exist prior to March 2007. The
calculation methodology for the Dimensional US Small Cap Value Index was
amended in January 2014 to include direct profitability as a factor in selecting
securities for inclusion in the index. Prior to January 1975: Targets securities of US
companies traded on the NYSE, NYSE MKT (formerly AMEX), and Nasdaq Global
Market whose relative price is in the bottom 25% of the Dimensional US Small Cap
Index after the exclusion of utilities, companies lacking financial data, and
companies with negative relative price.
Dimensional International Marketwide Value Index is compiled by Dimensional
from Bloomberg securities data. The index consists of companies whose relative
price is in the bottom 33% of their country’s companies after the exclusion of utilities
and companies with either negative or missing relative price data. The index
emphasizes companies with smaller capitalization, lower relative price, and higher
profitability. The index also excludes those companies with the lowest profitability
and highest relative price within their country’s value universe. Profitability is
measured as operating income before depreciation and amortization minus interest
expense scaled by book. Exclusions: REITs and investment companies. The index
has been retroactively calculated by Dimensional and did not exist prior to April
2008. The calculation methodology for the Dimensional International Marketwide
Value Index was amended in January 2014 to include direct profitability as a factor
in selecting securities for inclusion in the index.
#44915-0315
Descriptions of Dimensional Indices
Dimensional International Small Cap Index was created by Dimensional in April
2008 and is compiled by Dimensional. July 1981–December 1993: It Includes non-
US developed securities in the bottom 10% of market capitalization in each eligible
country. All securities are market capitalization weighted. Each country is capped at
50%. Rebalanced semiannually. January 1994–Present: Market-capitalization-
weighted index of small company securities in the eligible markets excluding those
with the lowest profitability and highest relative price within the small cap universe.
Profitability is measured as operating income before depreciation and amortization
minus interest expense scaled by book. The index monthly returns are computed as
the simple average of the monthly returns of four sub-indices, each one
reconstituted once a year at the end of a different quarter of the year. Prior to July
1981, the index is 50% UK and 50% Japan. The calculation methodology for the
Dimensional International Small Cap Index was amended on January 1, 2014, to
include profitability as a factor in selecting securities for inclusion in the index.
Dimensional International Small Cap Value Index is defined as companies whose
relative price is in the bottom 35% of their country’s respective constituents in the
Dimensional International Small Cap Index after the exclusion of utilities and
companies with either negative or missing relative price data. The index also
excludes those companies with the lowest profitability within their country’s small
value universe. Profitability is measured as operating income before depreciation
and amortization minus interest expense scaled by book. Exclusions: REITs and
investment companies. The index has been retroactively calculated by Dimensional
and did not exist prior to April 2008. The calculation methodology for the
Dimensional International Small Cap Value Index was amended in January 2014 to
include direct profitability as a factor in selecting securities for inclusion in the index.
Prior to January 1994: Created by Dimensional; includes securities of MSCI EAFE
countries in the top 30% of book-to-market by market capitalization conditional on
the securities being in the bottom 10% of market capitalization, excluding the bottom
1%. All securities are market-capitalization weighted. Each country is capped at
50%; rebalanced semiannually.
Dimensional Emerging Markets Index is compiled by Dimensional from Bloomberg
securities data. Market-capitalization-weighted index of all securities in the eligible
markets. The index has been retroactively calculated by Dimensional and did not
exist prior to April 2008.
Dimensional Emerging Markets Value Index is compiled by Dimensional from
Bloomberg securities data. The index consists of companies whose relative price is
in the bottom 33% of their country’s companies after the exclusion of utilities and
companies with either negative or missing relative price data. The index emphasizes
companies with smaller capitalization, lower relative price, and higher profitability.
The index also excludes those companies with the lowest profitability and highest
relative price within their country’s value universe. Profitability is measured as
operating income before depreciation and amortization minus interest expense
scaled by book. Exclusions: REITs and investment companies. The index has been
retroactively calculated by Dimensional and did not exist prior to April 2008. The
calculation methodology for the Dimensional Emerging Markets Value Index was
amended in January 2014 to include profitability as a factor in selecting securities for
inclusion in the index. Prior to January 1994: Fama/French Emerging Markets Value
Index.
Dimensional Emerging Markets Small Cap Index was created by Dimensional in
April 2008 and is compiled by Dimensional. January 1989–December 1993:
Fama/French Emerging Markets Small Cap Index. January 1994–Present:
Dimensional Emerging Markets Small Index Composition: Market-capitalization-
weighted index of small company securities in the eligible markets excluding those
with the lowest profitability and highest relative price within the small cap universe.
Profitability is measured as operating income before depreciation and amortization
minus interest expense scaled by book. The index monthly returns are computed as
the simple average of the monthly returns of four sub-indices, each one
reconstituted once a year at the end of a different quarter of the year.
Source: Bloomberg. The calculation methodology for the Dimensional Emerging
Markets Small Cap Index was amended on January 1, 2014, to include profitability
as a factor in selecting securities for inclusion in the index.
#44915-0315

More Related Content

What's hot

The Linkous Group, LTD Market Review - Q2 2017
The Linkous Group, LTD Market Review - Q2 2017The Linkous Group, LTD Market Review - Q2 2017
The Linkous Group, LTD Market Review - Q2 2017
Susan Linkous, AIF®
 
F5FP Quarterly Market Review - Second Quarter 2017
F5FP Quarterly Market Review - Second Quarter 2017F5FP Quarterly Market Review - Second Quarter 2017
F5FP Quarterly Market Review - Second Quarter 2017
Curtis Stowers, CFP®
 
Quarterly Market Review Q1 2020
Quarterly Market Review Q1 2020Quarterly Market Review Q1 2020
Quarterly Market Review Q1 2020
Susan Langdon
 
Quarterly Market Review - Q2 2021
Quarterly Market Review - Q2 2021Quarterly Market Review - Q2 2021
Quarterly Market Review - Q2 2021
Mark Beal, CFP®
 
Quarterly Market Review - Fourth Quarter 2013
Quarterly Market Review - Fourth Quarter 2013Quarterly Market Review - Fourth Quarter 2013
Quarterly Market Review - Fourth Quarter 2013
Will Ferlis
 
Baer Wealth Management Q3
Baer Wealth Management Q3Baer Wealth Management Q3
Baer Wealth Management Q3
Mikol McMeen
 
2021 Annual Market Review
2021 Annual Market Review2021 Annual Market Review
2021 Annual Market Review
Mark Beal, CFP®
 
2020.Q1 - Quarterly Market Review
2020.Q1 - Quarterly Market Review2020.Q1 - Quarterly Market Review
2020.Q1 - Quarterly Market Review
Mark Beal, CFP®
 
Quarterly market review q3 2018
Quarterly market review   q3 2018Quarterly market review   q3 2018
Quarterly market review q3 2018
Mark Beal, CFP®
 
Baer Wealth - Quarterly Market Review - Q3 2019
Baer Wealth - Quarterly Market Review - Q3 2019Baer Wealth - Quarterly Market Review - Q3 2019
Baer Wealth - Quarterly Market Review - Q3 2019
Mark Beal, CFP®
 
2021.Q3 - Quarterly Market Review
2021.Q3 - Quarterly Market Review2021.Q3 - Quarterly Market Review
2021.Q3 - Quarterly Market Review
Mark Beal, CFP®
 
Quarterly market review q2 2018
Quarterly market review   q2 2018Quarterly market review   q2 2018
Quarterly market review q2 2018
Mark Beal, CFP®
 
Annual market review - 2018
Annual market review - 2018Annual market review - 2018
Annual market review - 2018
Mark Beal, CFP®
 
Quarterly market review (qmr) q1 2018 (landscape version)
Quarterly market review (qmr)   q1 2018 (landscape version)Quarterly market review (qmr)   q1 2018 (landscape version)
Quarterly market review (qmr) q1 2018 (landscape version)
Mark Beal, CFP®
 
Quarterly market review - Q4 2018
Quarterly market review - Q4 2018Quarterly market review - Q4 2018
Quarterly market review - Q4 2018
Mark Beal, CFP®
 
Financial Synergies | Q4 2016 Market Review
Financial Synergies | Q4 2016 Market ReviewFinancial Synergies | Q4 2016 Market Review
Financial Synergies | Q4 2016 Market Review
Financial Synergies Wealth Advisors, Inc.
 
Quarterly market review - Q2 2019
Quarterly market review - Q2 2019Quarterly market review - Q2 2019
Quarterly market review - Q2 2019
Mark Beal, CFP®
 
Second Quarter in Review
Second Quarter in ReviewSecond Quarter in Review
Second Quarter in Review
Kenneth Baer, CFP®
 
QMR Q416 2016_mamc
QMR Q416 2016_mamcQMR Q416 2016_mamc
QMR Q416 2016_mamc
mclean8200
 
Daily commodity report 28th april 2017 by epic reseach
Daily commodity report 28th  april 2017 by epic reseachDaily commodity report 28th  april 2017 by epic reseach
Daily commodity report 28th april 2017 by epic reseach
Free Stock Tips for traders
 

What's hot (20)

The Linkous Group, LTD Market Review - Q2 2017
The Linkous Group, LTD Market Review - Q2 2017The Linkous Group, LTD Market Review - Q2 2017
The Linkous Group, LTD Market Review - Q2 2017
 
F5FP Quarterly Market Review - Second Quarter 2017
F5FP Quarterly Market Review - Second Quarter 2017F5FP Quarterly Market Review - Second Quarter 2017
F5FP Quarterly Market Review - Second Quarter 2017
 
Quarterly Market Review Q1 2020
Quarterly Market Review Q1 2020Quarterly Market Review Q1 2020
Quarterly Market Review Q1 2020
 
Quarterly Market Review - Q2 2021
Quarterly Market Review - Q2 2021Quarterly Market Review - Q2 2021
Quarterly Market Review - Q2 2021
 
Quarterly Market Review - Fourth Quarter 2013
Quarterly Market Review - Fourth Quarter 2013Quarterly Market Review - Fourth Quarter 2013
Quarterly Market Review - Fourth Quarter 2013
 
Baer Wealth Management Q3
Baer Wealth Management Q3Baer Wealth Management Q3
Baer Wealth Management Q3
 
2021 Annual Market Review
2021 Annual Market Review2021 Annual Market Review
2021 Annual Market Review
 
2020.Q1 - Quarterly Market Review
2020.Q1 - Quarterly Market Review2020.Q1 - Quarterly Market Review
2020.Q1 - Quarterly Market Review
 
Quarterly market review q3 2018
Quarterly market review   q3 2018Quarterly market review   q3 2018
Quarterly market review q3 2018
 
Baer Wealth - Quarterly Market Review - Q3 2019
Baer Wealth - Quarterly Market Review - Q3 2019Baer Wealth - Quarterly Market Review - Q3 2019
Baer Wealth - Quarterly Market Review - Q3 2019
 
2021.Q3 - Quarterly Market Review
2021.Q3 - Quarterly Market Review2021.Q3 - Quarterly Market Review
2021.Q3 - Quarterly Market Review
 
Quarterly market review q2 2018
Quarterly market review   q2 2018Quarterly market review   q2 2018
Quarterly market review q2 2018
 
Annual market review - 2018
Annual market review - 2018Annual market review - 2018
Annual market review - 2018
 
Quarterly market review (qmr) q1 2018 (landscape version)
Quarterly market review (qmr)   q1 2018 (landscape version)Quarterly market review (qmr)   q1 2018 (landscape version)
Quarterly market review (qmr) q1 2018 (landscape version)
 
Quarterly market review - Q4 2018
Quarterly market review - Q4 2018Quarterly market review - Q4 2018
Quarterly market review - Q4 2018
 
Financial Synergies | Q4 2016 Market Review
Financial Synergies | Q4 2016 Market ReviewFinancial Synergies | Q4 2016 Market Review
Financial Synergies | Q4 2016 Market Review
 
Quarterly market review - Q2 2019
Quarterly market review - Q2 2019Quarterly market review - Q2 2019
Quarterly market review - Q2 2019
 
Second Quarter in Review
Second Quarter in ReviewSecond Quarter in Review
Second Quarter in Review
 
QMR Q416 2016_mamc
QMR Q416 2016_mamcQMR Q416 2016_mamc
QMR Q416 2016_mamc
 
Daily commodity report 28th april 2017 by epic reseach
Daily commodity report 28th  april 2017 by epic reseachDaily commodity report 28th  april 2017 by epic reseach
Daily commodity report 28th april 2017 by epic reseach
 

Similar to The Importance of Global Diversification

AAFP_3Q 2022.pdf
AAFP_3Q 2022.pdfAAFP_3Q 2022.pdf
AAFP_3Q 2022.pdf
RamtinKhah1
 
AAFP_3Q 2022.pdf
AAFP_3Q 2022.pdfAAFP_3Q 2022.pdf
AAFP_3Q 2022.pdf
RamtinKhah1
 
Asset Allocation & Financial Planning
Asset Allocation & Financial PlanningAsset Allocation & Financial Planning
Asset Allocation & Financial Planning
RamtinKhah1
 
The Importance of Diversification
The Importance of DiversificationThe Importance of Diversification
The Importance of Diversification
Marqus J Freeman
 
Planning Strategies Q410
Planning Strategies Q410Planning Strategies Q410
Planning Strategies Q410
Barry Mendelson
 
Qmr q415 2015_mamc
Qmr q415 2015_mamcQmr q415 2015_mamc
Qmr q415 2015_mamc
mclean8200
 
Quarterly Market Review: Q4 2015
Quarterly Market Review: Q4 2015Quarterly Market Review: Q4 2015
Quarterly Market Review: Q4 2015
Mark Stern
 
Financial Synergies | 4th Quarter 2015 Market Review
Financial Synergies | 4th Quarter 2015 Market ReviewFinancial Synergies | 4th Quarter 2015 Market Review
Financial Synergies | 4th Quarter 2015 Market Review
Financial Synergies Wealth Advisors, Inc.
 
Bisonwood Financial Management - Q4 2015 Market Review
Bisonwood Financial Management - Q4 2015 Market ReviewBisonwood Financial Management - Q4 2015 Market Review
Bisonwood Financial Management - Q4 2015 Market Review
Jason Traff
 
Global Equity Update October 2022
Global Equity Update October 2022Global Equity Update October 2022
Global Equity Update October 2022
Riverbend Investment Management
 
Financial Synergies | Q1 2016 Market Review
Financial Synergies | Q1 2016 Market ReviewFinancial Synergies | Q1 2016 Market Review
Financial Synergies | Q1 2016 Market Review
Financial Synergies Wealth Advisors, Inc.
 
Quarterly Market Review: Q1 2016
Quarterly Market Review: Q1 2016Quarterly Market Review: Q1 2016
Quarterly Market Review: Q1 2016
Mark Stern
 
Barometer readings november 2016
Barometer readings    november 2016Barometer readings    november 2016
Barometer readings november 2016
Paul Song
 
Bisonwood Q1 2016 quarterly market review
Bisonwood Q1 2016 quarterly market reviewBisonwood Q1 2016 quarterly market review
Bisonwood Q1 2016 quarterly market review
Jason Traff
 
Qmr q116 2016_mamc
Qmr q116 2016_mamcQmr q116 2016_mamc
Qmr q116 2016_mamc
mclean8200
 
Q3 2016 Bisonwood Quarterly Newsletter
Q3 2016 Bisonwood Quarterly NewsletterQ3 2016 Bisonwood Quarterly Newsletter
Q3 2016 Bisonwood Quarterly Newsletter
Jason Traff
 
Quarterly Market Review, Q2 2016
Quarterly Market Review, Q2 2016Quarterly Market Review, Q2 2016
Quarterly Market Review, Q2 2016
Mark Stern
 
Investing for Doctors | Q3 Market Review
Investing for Doctors | Q3 Market ReviewInvesting for Doctors | Q3 Market Review
Investing for Doctors | Q3 Market Review
LFGmarketing
 
Financial Synergies | Q1 2018 Market Review
Financial Synergies | Q1 2018 Market ReviewFinancial Synergies | Q1 2018 Market Review
Financial Synergies | Q1 2018 Market Review
Financial Synergies Wealth Advisors, Inc.
 

Similar to The Importance of Global Diversification (20)

AAFP_3Q 2022.pdf
AAFP_3Q 2022.pdfAAFP_3Q 2022.pdf
AAFP_3Q 2022.pdf
 
AAFP_3Q 2022.pdf
AAFP_3Q 2022.pdfAAFP_3Q 2022.pdf
AAFP_3Q 2022.pdf
 
Asset Allocation & Financial Planning
Asset Allocation & Financial PlanningAsset Allocation & Financial Planning
Asset Allocation & Financial Planning
 
Newsletter Q3 2016
Newsletter Q3 2016Newsletter Q3 2016
Newsletter Q3 2016
 
The Importance of Diversification
The Importance of DiversificationThe Importance of Diversification
The Importance of Diversification
 
Planning Strategies Q410
Planning Strategies Q410Planning Strategies Q410
Planning Strategies Q410
 
Qmr q415 2015_mamc
Qmr q415 2015_mamcQmr q415 2015_mamc
Qmr q415 2015_mamc
 
Quarterly Market Review: Q4 2015
Quarterly Market Review: Q4 2015Quarterly Market Review: Q4 2015
Quarterly Market Review: Q4 2015
 
Financial Synergies | 4th Quarter 2015 Market Review
Financial Synergies | 4th Quarter 2015 Market ReviewFinancial Synergies | 4th Quarter 2015 Market Review
Financial Synergies | 4th Quarter 2015 Market Review
 
Bisonwood Financial Management - Q4 2015 Market Review
Bisonwood Financial Management - Q4 2015 Market ReviewBisonwood Financial Management - Q4 2015 Market Review
Bisonwood Financial Management - Q4 2015 Market Review
 
Global Equity Update October 2022
Global Equity Update October 2022Global Equity Update October 2022
Global Equity Update October 2022
 
Financial Synergies | Q1 2016 Market Review
Financial Synergies | Q1 2016 Market ReviewFinancial Synergies | Q1 2016 Market Review
Financial Synergies | Q1 2016 Market Review
 
Quarterly Market Review: Q1 2016
Quarterly Market Review: Q1 2016Quarterly Market Review: Q1 2016
Quarterly Market Review: Q1 2016
 
Barometer readings november 2016
Barometer readings    november 2016Barometer readings    november 2016
Barometer readings november 2016
 
Bisonwood Q1 2016 quarterly market review
Bisonwood Q1 2016 quarterly market reviewBisonwood Q1 2016 quarterly market review
Bisonwood Q1 2016 quarterly market review
 
Qmr q116 2016_mamc
Qmr q116 2016_mamcQmr q116 2016_mamc
Qmr q116 2016_mamc
 
Q3 2016 Bisonwood Quarterly Newsletter
Q3 2016 Bisonwood Quarterly NewsletterQ3 2016 Bisonwood Quarterly Newsletter
Q3 2016 Bisonwood Quarterly Newsletter
 
Quarterly Market Review, Q2 2016
Quarterly Market Review, Q2 2016Quarterly Market Review, Q2 2016
Quarterly Market Review, Q2 2016
 
Investing for Doctors | Q3 Market Review
Investing for Doctors | Q3 Market ReviewInvesting for Doctors | Q3 Market Review
Investing for Doctors | Q3 Market Review
 
Financial Synergies | Q1 2018 Market Review
Financial Synergies | Q1 2018 Market ReviewFinancial Synergies | Q1 2018 Market Review
Financial Synergies | Q1 2018 Market Review
 

Recently uploaded

when will pi network coin be available on crypto exchange.
when will pi network coin be available on crypto exchange.when will pi network coin be available on crypto exchange.
when will pi network coin be available on crypto exchange.
DOT TECH
 
how to sell pi coins in all Africa Countries.
how to sell pi coins in all Africa Countries.how to sell pi coins in all Africa Countries.
how to sell pi coins in all Africa Countries.
DOT TECH
 
BYD SWOT Analysis and In-Depth Insights 2024.pptx
BYD SWOT Analysis and In-Depth Insights 2024.pptxBYD SWOT Analysis and In-Depth Insights 2024.pptx
BYD SWOT Analysis and In-Depth Insights 2024.pptx
mikemetalprod
 
can I really make money with pi network.
can I really make money with pi network.can I really make money with pi network.
can I really make money with pi network.
DOT TECH
 
how to sell pi coins at high rate quickly.
how to sell pi coins at high rate quickly.how to sell pi coins at high rate quickly.
how to sell pi coins at high rate quickly.
DOT TECH
 
how can I sell/buy bulk pi coins securely
how can I sell/buy bulk pi coins securelyhow can I sell/buy bulk pi coins securely
how can I sell/buy bulk pi coins securely
DOT TECH
 
SWAIAP Fraud Risk Mitigation Prof Oyedokun.pptx
SWAIAP Fraud Risk Mitigation   Prof Oyedokun.pptxSWAIAP Fraud Risk Mitigation   Prof Oyedokun.pptx
SWAIAP Fraud Risk Mitigation Prof Oyedokun.pptx
Godwin Emmanuel Oyedokun MBA MSc ACA ACIB FCTI FCFIP CFE
 
This assessment plan proposal is to outline a structured approach to evaluati...
This assessment plan proposal is to outline a structured approach to evaluati...This assessment plan proposal is to outline a structured approach to evaluati...
This assessment plan proposal is to outline a structured approach to evaluati...
lamluanvan.net Viết thuê luận văn
 
Which Crypto to Buy Today for Short-Term in May-June 2024.pdf
Which Crypto to Buy Today for Short-Term in May-June 2024.pdfWhich Crypto to Buy Today for Short-Term in May-June 2024.pdf
Which Crypto to Buy Today for Short-Term in May-June 2024.pdf
Kezex (KZX)
 
what is the future of Pi Network currency.
what is the future of Pi Network currency.what is the future of Pi Network currency.
what is the future of Pi Network currency.
DOT TECH
 
一比一原版(GWU,GW毕业证)加利福尼亚大学|尔湾分校毕业证如何办理
一比一原版(GWU,GW毕业证)加利福尼亚大学|尔湾分校毕业证如何办理一比一原版(GWU,GW毕业证)加利福尼亚大学|尔湾分校毕业证如何办理
一比一原版(GWU,GW毕业证)加利福尼亚大学|尔湾分校毕业证如何办理
obyzuk
 
Instant Issue Debit Cards - High School Spirit
Instant Issue Debit Cards - High School SpiritInstant Issue Debit Cards - High School Spirit
Instant Issue Debit Cards - High School Spirit
egoetzinger
 
innovative-invoice-discounting-platforms-in-india-empowering-retail-investors...
innovative-invoice-discounting-platforms-in-india-empowering-retail-investors...innovative-invoice-discounting-platforms-in-india-empowering-retail-investors...
innovative-invoice-discounting-platforms-in-india-empowering-retail-investors...
Falcon Invoice Discounting
 
The Role of Non-Banking Financial Companies (NBFCs)
The Role of Non-Banking Financial Companies (NBFCs)The Role of Non-Banking Financial Companies (NBFCs)
The Role of Non-Banking Financial Companies (NBFCs)
nickysharmasucks
 
how can i use my minded pi coins I need some funds.
how can i use my minded pi coins I need some funds.how can i use my minded pi coins I need some funds.
how can i use my minded pi coins I need some funds.
DOT TECH
 
how to swap pi coins to foreign currency withdrawable.
how to swap pi coins to foreign currency withdrawable.how to swap pi coins to foreign currency withdrawable.
how to swap pi coins to foreign currency withdrawable.
DOT TECH
 
how to sell pi coins on Bitmart crypto exchange
how to sell pi coins on Bitmart crypto exchangehow to sell pi coins on Bitmart crypto exchange
how to sell pi coins on Bitmart crypto exchange
DOT TECH
 
Abhay Bhutada Leads Poonawalla Fincorp To Record Low NPA And Unprecedented Gr...
Abhay Bhutada Leads Poonawalla Fincorp To Record Low NPA And Unprecedented Gr...Abhay Bhutada Leads Poonawalla Fincorp To Record Low NPA And Unprecedented Gr...
Abhay Bhutada Leads Poonawalla Fincorp To Record Low NPA And Unprecedented Gr...
Vighnesh Shashtri
 
一比一原版(UCSB毕业证)圣芭芭拉分校毕业证如何办理
一比一原版(UCSB毕业证)圣芭芭拉分校毕业证如何办理一比一原版(UCSB毕业证)圣芭芭拉分校毕业证如何办理
一比一原版(UCSB毕业证)圣芭芭拉分校毕业证如何办理
bbeucd
 
US Economic Outlook - Being Decided - M Capital Group August 2021.pdf
US Economic Outlook - Being Decided - M Capital Group August 2021.pdfUS Economic Outlook - Being Decided - M Capital Group August 2021.pdf
US Economic Outlook - Being Decided - M Capital Group August 2021.pdf
pchutichetpong
 

Recently uploaded (20)

when will pi network coin be available on crypto exchange.
when will pi network coin be available on crypto exchange.when will pi network coin be available on crypto exchange.
when will pi network coin be available on crypto exchange.
 
how to sell pi coins in all Africa Countries.
how to sell pi coins in all Africa Countries.how to sell pi coins in all Africa Countries.
how to sell pi coins in all Africa Countries.
 
BYD SWOT Analysis and In-Depth Insights 2024.pptx
BYD SWOT Analysis and In-Depth Insights 2024.pptxBYD SWOT Analysis and In-Depth Insights 2024.pptx
BYD SWOT Analysis and In-Depth Insights 2024.pptx
 
can I really make money with pi network.
can I really make money with pi network.can I really make money with pi network.
can I really make money with pi network.
 
how to sell pi coins at high rate quickly.
how to sell pi coins at high rate quickly.how to sell pi coins at high rate quickly.
how to sell pi coins at high rate quickly.
 
how can I sell/buy bulk pi coins securely
how can I sell/buy bulk pi coins securelyhow can I sell/buy bulk pi coins securely
how can I sell/buy bulk pi coins securely
 
SWAIAP Fraud Risk Mitigation Prof Oyedokun.pptx
SWAIAP Fraud Risk Mitigation   Prof Oyedokun.pptxSWAIAP Fraud Risk Mitigation   Prof Oyedokun.pptx
SWAIAP Fraud Risk Mitigation Prof Oyedokun.pptx
 
This assessment plan proposal is to outline a structured approach to evaluati...
This assessment plan proposal is to outline a structured approach to evaluati...This assessment plan proposal is to outline a structured approach to evaluati...
This assessment plan proposal is to outline a structured approach to evaluati...
 
Which Crypto to Buy Today for Short-Term in May-June 2024.pdf
Which Crypto to Buy Today for Short-Term in May-June 2024.pdfWhich Crypto to Buy Today for Short-Term in May-June 2024.pdf
Which Crypto to Buy Today for Short-Term in May-June 2024.pdf
 
what is the future of Pi Network currency.
what is the future of Pi Network currency.what is the future of Pi Network currency.
what is the future of Pi Network currency.
 
一比一原版(GWU,GW毕业证)加利福尼亚大学|尔湾分校毕业证如何办理
一比一原版(GWU,GW毕业证)加利福尼亚大学|尔湾分校毕业证如何办理一比一原版(GWU,GW毕业证)加利福尼亚大学|尔湾分校毕业证如何办理
一比一原版(GWU,GW毕业证)加利福尼亚大学|尔湾分校毕业证如何办理
 
Instant Issue Debit Cards - High School Spirit
Instant Issue Debit Cards - High School SpiritInstant Issue Debit Cards - High School Spirit
Instant Issue Debit Cards - High School Spirit
 
innovative-invoice-discounting-platforms-in-india-empowering-retail-investors...
innovative-invoice-discounting-platforms-in-india-empowering-retail-investors...innovative-invoice-discounting-platforms-in-india-empowering-retail-investors...
innovative-invoice-discounting-platforms-in-india-empowering-retail-investors...
 
The Role of Non-Banking Financial Companies (NBFCs)
The Role of Non-Banking Financial Companies (NBFCs)The Role of Non-Banking Financial Companies (NBFCs)
The Role of Non-Banking Financial Companies (NBFCs)
 
how can i use my minded pi coins I need some funds.
how can i use my minded pi coins I need some funds.how can i use my minded pi coins I need some funds.
how can i use my minded pi coins I need some funds.
 
how to swap pi coins to foreign currency withdrawable.
how to swap pi coins to foreign currency withdrawable.how to swap pi coins to foreign currency withdrawable.
how to swap pi coins to foreign currency withdrawable.
 
how to sell pi coins on Bitmart crypto exchange
how to sell pi coins on Bitmart crypto exchangehow to sell pi coins on Bitmart crypto exchange
how to sell pi coins on Bitmart crypto exchange
 
Abhay Bhutada Leads Poonawalla Fincorp To Record Low NPA And Unprecedented Gr...
Abhay Bhutada Leads Poonawalla Fincorp To Record Low NPA And Unprecedented Gr...Abhay Bhutada Leads Poonawalla Fincorp To Record Low NPA And Unprecedented Gr...
Abhay Bhutada Leads Poonawalla Fincorp To Record Low NPA And Unprecedented Gr...
 
一比一原版(UCSB毕业证)圣芭芭拉分校毕业证如何办理
一比一原版(UCSB毕业证)圣芭芭拉分校毕业证如何办理一比一原版(UCSB毕业证)圣芭芭拉分校毕业证如何办理
一比一原版(UCSB毕业证)圣芭芭拉分校毕业证如何办理
 
US Economic Outlook - Being Decided - M Capital Group August 2021.pdf
US Economic Outlook - Being Decided - M Capital Group August 2021.pdfUS Economic Outlook - Being Decided - M Capital Group August 2021.pdf
US Economic Outlook - Being Decided - M Capital Group August 2021.pdf
 

The Importance of Global Diversification

  • 1. The Case for Global Diversification
  • 2. There’s a World of Opportunity in Equities 2 Percent of world market capitalization as of December 31, 2016 Data provided by Bloomberg. Market cap data is free-float adjusted and meets minimum liquidity and listing requirements. Many nations not displayed. Totals may not equal 100% due to rounding. For educational purposes; should not be used as investment advice. China market capitalization excludes A-shares, which are generally only available to mainland China investors.
  • 3. In US dollars. Data provided by Bloomberg. Market cap data is free-float adjusted and meets minimum liquidity and listing requirements. Market Capitalization of Global Stock Markets January 1990–December 2016 3 Weights Number of Countries Number of Stocks Total Value December 31, 2016 Change from Previous Year 01/90–12/16 Average US 1 3,311 25.35 Trillion 54.20% p 0.90% 47.07% Developed Markets ex US 22 6,315 16.26 Trillion 34.76% q -1.16% 46.27% Emerging Markets 23 5,619 5.16 Trillion 11.04% p 0.25% 6.65% Total 46 15,245 46.78 Trillion 100.00% 0% 20% 40% 60% 80% 100% 1990 1992 1994 1996 1998 2000 2002 2004 2006 2008 2010 2012 2014 2016 International Developed Domestic Emerging Markets
  • 4. There’s a World of Opportunity in Fixed Income 4 Percent of global investment grade bond market as of December 31, 2016 Data is from Bloomberg Barclays Global Aggregate Ex-Securitized Bond Index. Index excludes non-investment grade securities, bonds with less than one year to maturity, tax-exempt municipal securities, inflation-linked bonds, floating rate issues, and securitized bonds. Many nations not displayed. Totals may not equal 100% due to rounding. For educational purposes; should not be used as investment advice. Data provided by Bloomberg.
  • 5. The Randomness of Returns 5 Annual Return (%) In US dollars. US Large Cap is the S&P 500 Index, provided by Standard & Poor’s Index Services Group. US Large Cap Value is the Russell 1000 Value Index. US Small Cap is the Russell 2000 Index. US Small Cap Value is the Russell 2000 Value Index. Frank Russell Company is the source and owner of the trademarks, service marks, and copyrights related to the Russell Indexes. US Real Estate is the Dow Jones US Select REIT Index, provided by Dow Jones indices. International Large Cap Value is the MSCI World ex USA Value Index (gross dividends). International Small Cap is the MSCI World ex USA Small Cap Index (gross dividends). International Small Cap Value is the MSCI World ex USA Small Cap Value Index (gross dividends). Emerging Markets is the MSCI Emerging Markets Index (gross dividends). MSCI data copyright MSCI 2017, all rights reserved. One-Year US Fixed is the BofA Merrill Lynch One-Year US Treasury Note Index, used with permission; copyright 2017 Merrill Lynch, Pierce, Fenner & Smith Incorporated; all rights reserved. Merrill Lynch, Pierce, Fenner & Smith Incorporated is a wholly owned subsidiary of Bank of America Corporation. Five-Year US Government Fixed is the Bloomberg Barclays Treasury Bond Index 1–5 Years. Bloomberg Barclays data provided by Bloomberg. Five-Year Global Fixed is the Citi World Government Bond Index 1–5 Years (hedged), copyright 2017 by Citigroup. Indexes are not available for direct investment. Index performance does not reflect the expenses associated with the management of an actual portfolio. Past performance is not a guarantee of future results. 2002 2003 2004 2005 2006 2007 2008 2009 2010 2011 2012 2013 2014 2015 2016 Highest Return 7.6 62.6 34.2 34.0 36.0 39.4 8.8 78.5 28.1 9.4 20.1 38.8 32.0 5.8 31.7 5.1 60.2 33.2 25.5 32.1 8.2 6.6 53.3 26.9 3.4 18.2 34.5 13.7 4.5 21.3 3.6 55.8 29.9 21.1 30.0 7.5 4.7 51.4 24.9 2.3 18.1 32.5 13.5 1.5 17.3 3.4 47.3 25.6 15.1 27.9 6.3 -28.9 37.6 24.5 2.1 18.1 32.4 4.9 1.4 12.0 2.2 46.6 25.0 13.8 23.5 5.9 -33.8 28.5 21.2 0.6 17.9 28.3 4.2 1.0 11.2 -6.2 46.0 22.2 7.0 22.2 5.5 -36.8 27.2 18.9 0.4 17.5 26.0 1.9 0.9 8.4 -7.1 36.2 18.3 4.9 19.8 3.6 -37.0 26.5 15.5 -4.2 17.1 22.2 1.2 0.2 8.1 -11.4 30.0 16.5 4.7 18.4 2.5 -39.2 20.6 15.1 -5.5 16.3 1.2 0.2 -3.8 6.7 -15.5 28.7 10.9 4.6 15.8 -0.2 -43.9 19.7 5.4 -11.1 16.0 0.6 -2.2 -4.4 4.7 -15.6 2.0 2.7 3.1 4.3 -1.6 -45.6 2.3 3.7 -15.5 2.1 0.3 -4.9 -7.2 1.5 -20.5 1.9 1.3 2.4 4.1 -9.8 -47.8 0.8 2.0 -16.4 0.9 -0.1 -5.0 -7.5 1.0 Lowest Return -22.1 1.5 0.8 1.3 3.8 -17.6 -53.3 0.2 0.8 -18.4 0.2 -2.6 -5.4 -14.9 0.8 2002 2003 2004 2005 2006 2007 2008 2009 2010 2011 2012 2013 2014 2015 2016 US Large Cap -22.1 28.7 10.9 4.9 15.8 5.5 -37.0 26.5 15.1 2.1 16.0 32.4 13.7 1.4 12.0 US Large Cap Value -15.5 30.0 16.5 7.0 22.2 -0.2 -36.8 19.7 15.5 0.4 17.5 32.5 13.5 -3.8 17.3 US Small Cap -20.5 47.3 18.3 4.6 18.4 -1.6 -33.8 27.2 26.9 -4.2 16.3 38.8 4.9 -4.4 21.3 US Small Cap Value -11.4 46.0 22.2 4.7 23.5 -9.8 -28.9 20.6 24.5 -5.5 18.1 34.5 4.2 -7.5 31.7 US Real Estate 3.6 36.2 33.2 13.8 36.0 -17.6 -39.2 28.5 28.1 9.4 17.1 1.2 32.0 4.5 6.7 International Large Cap Value -15.6 46.6 25.0 15.1 30.0 7.5 -43.9 37.6 5.4 -11.1 18.1 22.2 -4.9 -7.2 8.1 International Small Cap -7.1 62.6 29.9 25.5 19.8 3.6 -47.8 51.4 24.9 -15.5 17.9 26.0 -5.0 5.8 4.7 International Small Cap Value 2.2 60.2 34.2 21.1 27.9 2.5 -45.6 53.3 21.2 -16.4 20.1 28.3 -5.4 1.5 8.4 Emerging Markets -6.2 55.8 25.6 34.0 32.1 39.4 -53.3 78.5 18.9 -18.4 18.2 -2.6 -2.2 -14.9 11.2 One-Year US Fixed 3.4 1.5 0.8 2.4 4.3 5.9 4.7 0.8 0.8 0.6 0.2 0.3 0.2 0.2 0.8 Five-Year US Government Fixed 7.6 2.0 1.3 1.3 3.8 8.2 8.8 0.2 3.7 3.4 0.9 -0.1 1.2 0.9 1.0 Five-Year Global Fixed 5.1 1.9 2.7 3.1 4.1 6.3 6.6 2.3 2.0 2.3 2.1 0.6 1.9 1.0 1.5
  • 6. Equity Returns of Developed Markets 6 Annual Return (%) In US dollars. Source: MSCI developed markets country indices (net dividends). MSCI data © MSCI 2017, all rights reserved. Indices are not available for direct investment. Index performance does not reflect expenses associated with the management of an actual portfolio. Past performance is not a guarantee of future results. 1997 1998 1999 2000 2001 2002 2003 2004 2005 2006 2007 2008 2009 2010 2011 2012 2013 2014 2015 2016 Switz. 44.25 Finland 121.64 Finland 152.60 Switz. 5.85 NZ 8.42 NZ 24.24 Sweden 64.53 Austria 71.52 Canada 28.31 Spain 49.36 Finland 48.65 Japan -29.21 Norway 87.07 Sweden 33.75 Ireland 13.71 Belgium 39.55 Finland 46.04 US 12.69 Denmark 23.43 Canada 24.56 Italy 35.48 Belgium 67.75 Singapore 99.40 Canada 5.34 Australia 1.68 Austria 16.55 Germany 63.80 Norway 53.27 Japan 25.52 Ireland 46.81 HK 41.20 Switz. -30.49 Australia 76.43 Denmark 30.73 NZ 5.54 Denmark 31.27 Ireland 41.15 NZ 7.34 Ireland 16.49 NZ 18.37 Denmark 34.52 Italy 52.52 Sweden 79.74 Denmark 3.44 Ireland -2.80 Australia -1.34 Spain 58.46 Belgium 43.53 Austria 24.64 Singapore 46.71 Germany 35.21 US -37.57 Singapore 73.96 HK 23.23 US 1.36 Singapore 30.96 US 31.79 Denmark 6.18 Belgium 12.10 Norway 13.31 US 33.38 Spain 49.90 Japan 61.53 Norway -0.89 Austria -5.65 Norway -7.26 Austria 56.96 Ireland 43.07 Denmark 24.50 Norway 45.12 Norway 31.43 Spain -40.60 Sweden 64.16 Singapore 22.14 UK -2.56 Germany 30.90 Germany 31.37 HK 5.07 Japan 9.57 Australia 11.45 Spain 25.41 France 41.54 HK 59.52 Italy -1.33 Belgium -10.89 Italy -7.33 NZ 55.43 Sweden 36.28 Norway 24.26 Sweden 43.39 Canada 29.57 France -43.27 HK 60.15 Canada 20.45 Switz. -6.77 NZ 29.26 Spain 31.32 Belgium 4.12 Austria 3.46 Austria 11.26 Germany 24.57 Ireland 35.33 Canada 53.74 Nether. -4.09 Spain -11.36 Japan -10.28 Canada 54.60 NZ 35.17 Finland 16.69 Denmark 38.77 Singapore 28.35 Canada -45.51 Belgium 57.49 Japan 15.44 Norway -10.01 HK 28.27 Nether. 31.30 Singapore 3.03 Italy 2.30 US 10.89 Nether. 23.77 US 30.14 Norway 31.70 France -4.31 Norway -12.22 Switz. -10.31 Australia 49.46 Italy 32.49 Switz. 16.33 Belgium 36.66 Australia 28.34 Germany -45.87 Canada 56.18 US 14.77 Belgium -10.62 Austria 25.90 Belgium 27.61 Ireland 2.29 Finland 2.02 France 4.88 UK 22.62 Germany 29.43 France 29.27 Australia -9.95 US -12.39 Singapore -11.05 Denmark 49.25 Denmark 30.82 Australia 16.02 Austria 36.54 Denmark 25.59 Singapore -47.35 NZ 50.40 Australia 14.52 Australia -10.95 Australia 22.07 Japan 27.16 Canada 1.50 Nether. 1.34 Nether. 4.82 Finland 17.28 Switz. 23.53 US 21.92 UK -11.53 UK -14.05 Canada -13.19 Norway 48.11 Australia 30.34 Singapore 14.37 Germany 35.99 Spain 23.95 Denmark -47.56 Spain 43.48 Switz. 11.79 Nether. -12.12 Sweden 21.97 Switz. 26.61 Switz. -0.09 US 0.69 Germany 2.75 Ireland 15.84 Nether. 23.23 Germany 20.04 Austria -11.96 Denmark -14.81 Belgium -14.97 Ireland 43.83 Spain 28.93 Nether. 13.85 France 34.48 Nether. 20.59 Nether. -48.22 UK 43.30 Norway 10.95 Spain -12.28 France 21.29 France 26.33 Finland -0.71 Switz. 0.44 Japan 2.38 Belgium 13.55 UK 17.80 Australia 17.62 Ireland -12.73 HK -18.61 UK -15.23 France 40.22 HK 24.98 Sweden 10.31 Italy 32.49 France 13.24 UK -48.34 Austria 43.20 Finland 10.28 Canada -12.71 Nether. 20.59 Denmark 25.25 Australia -3.41 France -0.11 HK 2.27 Sweden 12.92 Sweden 13.96 NZ 12.90 US -12.84 Canada -20.43 Spain -15.29 HK 38.10 Singapore 22.27 Germany 9.92 Nether. 31.38 NZ 8.90 Sweden -49.86 Nether. 42.25 Austria 9.88 Japan -14.33 Switz. 20.35 Sweden 24.50 Nether. -3.46 HK -0.54 Singapore 1.42 Canada 12.80 Denmark 8.99 UK 12.45 Finland -14.21 Switz. -21.38 Denmark -16.03 Italy 37.83 Canada 22.20 France 9.88 Australia 30.86 UK 8.36 Italy -49.98 Denmark 36.57 UK 8.76 Sweden -15.98 Norway 18.65 UK 20.67 Japan -4.02 Germany -1.89 Sweden 0.62 France 11.94 Australia 6.07 Denmark 12.06 HK -14.74 Nether. -22.10 HK -17.79 Singapore 37.60 UK 19.57 Belgium 9.05 UK 30.61 Italy 6.06 Australia -50.67 France 31.83 Germany 8.44 Denmark -16.02 US 15.33 Italy 20.43 Spain -4.65 Sweden -5.02 UK -0.10 Norway 6.24 Japan 5.05 Nether. 6.88 Germany -15.59 France -22.36 Nether. -20.83 Japan 35.91 France 18.48 HK 8.40 HK 30.35 US 5.44 HK -51.21 Italy 26.57 NZ 8.32 HK -16.02 UK 15.25 Austria 13.42 UK -5.39 NZ -6.26 Spain -1.02 Austria 1.57 Austria 0.35 Spain 4.83 Spain -15.86 Germany -22.39 France -21.18 Belgium 35.33 Germany 16.17 UK 7.35 Finland 29.94 Switz. 5.29 NZ -53.79 US 26.25 Nether. 1.74 France -16.87 Finland 14.57 NZ 11.27 Sweden -7.55 UK -7.56 Finland -4.70 Australia -10.44 HK -2.92 Italy -0.26 Belgium -16.85 Singapore -23.42 US -23.09 Switz. 34.08 Japan 15.86 US 5.14 Switz. 27.40 Austria 2.17 Finland -55.17 Switz. 25.31 Belgium -0.42 Singapore -17.92 Italy 12.48 HK 11.09 Italy -9.53 Australia -9.95 Switz. -4.87 NZ -14.15 Canada -6.14 Switz. -7.02 Sweden -21.29 Italy -26.59 Ireland -26.24 UK 32.06 Switz. 14.96 Spain 4.41 Canada 17.80 Sweden 0.62 Norway -64.24 Germany 25.15 France -4.11 Germany -18.08 Canada 9.09 Norway 9.40 France -9.92 Norway -14.99 Ireland -7.07 HK -23.29 Singapore -12.88 Austria -9.11 Singapore -27.72 Sweden -27.18 Finland -30.31 US 28.41 Nether. 12.24 Italy 1.90 NZ 16.56 Belgium -2.73 Belgium -66.48 Ireland 12.28 Italy -15.01 Italy -23.18 Japan 8.18 Canada 5.63 Germany -10.36 Spain -15.64 Belgium -7.57 Japan -23.67 NZ -22.62 Ireland -12.63 Japan -28.16 Japan -29.40 Sweden -30.49 Nether. 28.09 US 10.14 NZ 1.74 US 14.67 Japan -4.23 Austria -68.41 Finland 11.14 Ireland -18.12 Finland -31.90 Ireland 5.74 Australia 4.16 Norway -22.04 Singapore -17.71 Italy -10.45 Singapore -30.05 Norway -30.06 Belgium -14.26 NZ -33.55 Finland -38.18 Germany -33.18 Finland 19.40 Finland 6.14 Ireland -2.29 Japan 6.24 Ireland -20.09 Ireland -71.92 Japan 6.25 Spain -21.95 Austria -36.43 Spain 3.00 Singapore 1.70 Austria -29.77 Canada -24.16 Denmark -15.77 Highest Return Lowest Return
  • 7. Equity Returns of Developed Markets 7 Annual Return (%) In US dollars. Source: MSCI developed markets country indices (net dividends). MSCI data © MSCI 2017, all rights reserved. Indices are not available for direct investment. Index performance does not reflect expenses associated with the management of an actual portfolio. Past performance is not a guarantee of future results. 1997 1998 1999 2000 2001 2002 2003 2004 2005 2006 2007 2008 2009 2010 2011 2012 2013 2014 2015 2016 Australia -10.4 6.1 17.6 -10.0 1.7 -1.3 49.5 30.3 16.0 30.9 28.3 -50.7 76.4 14.5 -11.0 22.1 4.2 -3.4 -10.0 11.4 Austria 1.6 0.4 -9.1 -12.0 -5.6 16.5 57.0 71.5 24.6 36.5 2.2 -68.4 43.2 9.9 -36.4 25.9 13.4 -29.8 3.5 11.3 Belgium 13.6 67.7 -14.3 -16.8 -10.9 -15.0 35.3 43.5 9.0 36.7 -2.7 -66.5 57.5 -0.4 -10.6 39.6 27.6 4.1 12.1 -7.6 Canada 12.8 -6.1 53.7 5.3 -20.4 -13.2 54.6 22.2 28.3 17.8 29.6 -45.5 56.2 20.5 -12.7 9.1 5.6 1.5 -24.2 24.6 Denmark 34.5 9.0 12.1 3.4 -14.8 -16.0 49.3 30.8 24.5 38.8 25.6 -47.6 36.6 30.7 -16.0 31.3 25.2 6.2 23.4 -15.8 Finland 17.3 121.6 152.6 -14.2 -38.2 -30.3 19.4 6.1 16.7 29.9 48.7 -55.2 11.1 10.3 -31.9 14.6 46.0 -0.7 2.0 -4.7 France 11.9 41.5 29.3 -4.3 -22.4 -21.2 40.2 18.5 9.9 34.5 13.2 -43.3 31.8 -4.1 -16.9 21.3 26.3 -9.9 -0.1 4.9 Germany 24.6 29.4 20.0 -15.6 -22.4 -33.2 63.8 16.2 9.9 36.0 35.2 -45.9 25.2 8.4 -18.1 30.9 31.4 -10.4 -1.9 2.8 Hong Kong -23.3 -2.9 59.5 -14.7 -18.6 -17.8 38.1 25.0 8.4 30.4 41.2 -51.2 60.2 23.2 -16.0 28.3 11.1 5.1 -0.5 2.3 Ireland 15.8 35.3 -12.6 -12.7 -2.8 -26.2 43.8 43.1 -2.3 46.8 -20.1 -71.9 12.3 -18.1 13.7 5.7 41.2 2.3 16.5 -7.1 Italy 35.5 52.5 -0.3 -1.3 -26.6 -7.3 37.8 32.5 1.9 32.5 6.1 -50.0 26.6 -15.0 -23.2 12.5 20.4 -9.5 2.3 -10.5 Japan -23.7 5.1 61.5 -28.2 -29.4 -10.3 35.9 15.9 25.5 6.2 -4.2 -29.2 6.3 15.4 -14.3 8.2 27.2 -4.0 9.6 2.4 Netherlands 23.8 23.2 6.9 -4.1 -22.1 -20.8 28.1 12.2 13.9 31.4 20.6 -48.2 42.3 1.7 -12.1 20.6 31.3 -3.5 1.3 4.8 New Zealand -14.1 -22.6 12.9 -33.5 8.4 24.2 55.4 35.2 1.7 16.6 8.9 -53.8 50.4 8.3 5.5 29.3 11.3 7.3 -6.3 18.4 Norway 6.2 -30.1 31.7 -0.9 -12.2 -7.3 48.1 53.3 24.3 45.1 31.4 -64.2 87.1 10.9 -10.0 18.7 9.4 -22.0 -15.0 13.3 Singapore -30.0 -12.9 99.4 -27.7 -23.4 -11.0 37.6 22.3 14.4 46.7 28.4 -47.4 74.0 22.1 -17.9 31.0 1.7 3.0 -17.7 1.4 Spain 25.4 49.9 4.8 -15.9 -11.4 -15.3 58.5 28.9 4.4 49.4 24.0 -40.6 43.5 -22.0 -12.3 3.0 31.3 -4.7 -15.6 -1.0 Sweden 12.9 14.0 79.7 -21.3 -27.2 -30.5 64.5 36.3 10.3 43.4 0.6 -49.9 64.2 33.8 -16.0 22.0 24.5 -7.5 -5.0 0.6 Switzerland 44.2 23.5 -7.0 5.9 -21.4 -10.3 34.1 15.0 16.3 27.4 5.3 -30.5 25.3 11.8 -6.8 20.4 26.6 -0.1 0.4 -4.9 UK 22.6 17.8 12.5 -11.5 -14.0 -15.2 32.1 19.6 7.4 30.6 8.4 -48.3 43.3 8.8 -2.6 15.3 20.7 -5.4 -7.6 -0.1 US 33.4 30.1 21.9 -12.8 -12.4 -23.1 28.4 10.1 5.1 14.7 5.4 -37.6 26.3 14.8 1.4 15.3 31.8 12.7 0.7 10.9 Boxed Return is highest return for the year.
  • 8. Equity Returns of Emerging Markets 8 Annual Return (%) In US dollars. Source: MSCI emerging markets country indices (gross dividends). MSCI data © MSCI 2017, all rights reserved. Indices are not available for direct investment. Index performance does not reflect expenses associated with the management of an actual portfolio. Past performance is not a guarantee of future results. 1997 1998 1999 2000 2001 2002 2003 2004 2005 2006 2007 2008 2009 2010 2011 2012 2013 2014 2015 2016 Turkey 118.05 Korea 141.15 Turkey 252.41 Czech Rep. 1.62 Russia 55.85 Czech Rep. 44.16 Thailand 144.56 Colombia 132.95 Egypt 161.59 China 82.87 Peru 94.74 Colombia -25.10 Brazil 128.62 Thailand 56.27 Indonesia 6.50 Turkey 64.87 Taiwan 9.77 Egypt 29.35 Hungary 36.31 Brazil 66.75 Russia 112.12 Philippines 13.45 Russia 247.06 Poland -4.04 Korea 48.71 Indonesia 42.83 Turkey 125.88 Egypt 126.23 Colombia 107.52 Indonesia 74.83 Brazil 79.99 Chile -35.37 Indonesia 127.63 Peru 53.35 Malaysia 0.12 Philippines 47.56 Egypt 8.18 Indonesia 27.21 Russia 5.00 Russia 55.93 Hungary 95.21 Thailand 11.56 Malaysia 114.33 Brazil -11.37 Colombia 45.77 Hungary 30.69 Brazil 115.01 Hungary 92.49 Russia 73.77 Peru 62.55 Turkey 74.81 S. Africa -37.89 Russia 104.91 Chile 44.81 Philippines 0.10 Egypt 47.10 Malaysia 7.68 Philippines 26.40 India -6.12 Peru 55.61 Mexico 53.92 Czech Rep. 0.54 Indonesia 93.46 Chile -15.14 Peru 19.92 Peru 30.50 Peru 94.32 Czech Rep. 87.25 Korea 58.00 Philippines 59.65 India 73.11 Peru -40.11 India 102.81 Colombia 43.41 Thailand -2.40 Poland 40.97 Korea 4.18 India 23.87 Philippines -6.25 Hungary 35.37 Colombia 41.76 Poland -6.69 Korea 92.42 Malaysia -15.95 Mexico 18.55 S. Africa 27.99 Egypt 91.84 Poland 61.52 Brazil 57.05 Russia 55.93 China 66.24 Malaysia -41.21 Turkey 98.49 Malaysia 37.01 Czech Rep. -5.02 Colombia 35.89 China 3.96 Turkey 19.07 Korea -6.30 Thailand 27.01 Egypt 31.23 Hungary -8.16 Egypt 88.40 S. Africa -17.19 Taiwan 10.47 Thailand 27.59 China 87.57 Indonesia 52.21 Turkey 56.94 India 51.00 Egypt 58.43 Czech Rep. -42.75 Chile 86.73 Philippines 35.49 Colombia -5.02 Thailand 34.94 Poland 3.62 Thailand 16.84 China -7.62 Colombia 26.48 Brazil 27.34 Taiwan -20.64 India 87.35 Mexico -20.49 Thailand 5.25 Colombia 25.36 Chile 84.41 Mexico 48.32 Mexico 49.11 Brazil 45.80 Czech Rep. 55.93 Mexico -42.94 Colombia 84.35 Indonesia 34.62 Korea -11.76 Mexico 29.06 Russia 1.35 Peru 10.51 Taiwan -10.97 Taiwan 19.59 Peru 20.50 India -21.24 Mexico 80.07 India -21.74 Malaysia 4.56 Russia 15.71 India 78.36 S. Africa 44.91 Czech Rep. 46.20 Poland 41.93 Indonesia 55.03 Taiwan -45.88 Taiwan 80.25 S. Africa 34.21 Mexico -12.11 India 25.97 Mexico 0.21 Taiwan 10.05 Mexico -14.24 S. Africa 18.41 India 11.27 Egypt -27.00 Brazil 67.23 Peru -23.82 Czech Rep. -2.01 Korea 8.62 Indonesia 78.20 Turkey 42.03 India 37.57 Mexico 41.44 Thailand 46.63 Thailand -48.27 Hungary 77.61 Mexico 27.61 S. Africa -14.36 China 23.10 Philippines -2.01 China 8.26 Czech Rep. -16.55 Indonesia 17.52 Chile 5.52 S. Africa -27.56 S. Africa 57.20 Hungary -26.80 Chile -2.83 India 8.37 Russia 75.94 Brazil 36.47 Peru 35.00 Malaysia 37.14 Malaysia 46.07 China -50.83 Thailand 77.31 Korea 27.15 China -18.24 Hungary 22.79 India -3.83 S. Africa 5.69 Chile -16.85 Chile 16.81 Taiwan -6.29 Chile -28.50 Taiwan 52.71 Russia -30.03 Indonesia -8.49 Egypt 1.59 Colombia 66.93 Chile 29.01 S. Africa 28.34 Czech Rep. 34.68 Philippines 41.68 Philippines -51.87 Korea 72.06 Taiwan 22.73 Russia -19.30 Korea 21.48 S. Africa -5.78 Czech Rep. -2.42 Indonesia -19.08 Korea 9.25 S. Africa -8.18 Malaysia -30.81 Thailand 47.16 China -30.54 Hungary -9.16 Poland 1.26 Czech Rep. 66.20 Philippines 26.58 Poland 24.96 Hungary 33.70 Korea 32.58 Egypt -52.35 Peru 72.06 Turkey 21.24 Chile -20.00 Peru 20.24 Hungary -5.82 Mexico -9.23 Malaysia -20.06 China 1.11 Poland -22.39 Indonesia -31.53 Chile 39.01 Colombia -38.85 Brazil -16.99 Malaysia -0.66 S. Africa 45.86 Korea 22.86 Philippines 23.92 Chile 29.33 Poland 25.79 Poland -54.49 Philippines 67.98 India 20.95 Taiwan -20.15 S. Africa 19.01 Czech Rep. -8.10 Malaysia -10.66 Thailand -23.32 Poland 0.69 Czech Rep. -22.69 Mexico -33.53 Poland 31.50 Egypt -43.71 S. Africa -17.21 Mexico -13.31 Philippines 42.76 India 19.11 Chile 21.62 Taiwan 20.90 Russia 24.79 Korea -55.07 China 62.63 Russia 19.40 Peru -21.37 Taiwan 17.66 Thailand -14.34 Korea -10.70 Egypt -23.52 India -1.43 China -25.25 Brazil -39.62 Peru 18.86 Taiwan -44.90 Philippines -19.29 China -14.05 Taiwan 42.55 Malaysia 15.17 China 19.77 S. Africa 20.53 Chile 23.68 Brazil -56.06 S. Africa 57.82 Poland 15.86 Brazil -21.59 Russia 14.39 Brazil -15.79 Chile -12.20 Poland -24.91 Czech Rep. -2.45 Philippines -62.59 Peru -40.22 China 13.33 Philippines -45.01 India -19.45 Chile -19.81 Korea 35.94 Taiwan 9.83 Hungary 18.50 Egypt 17.08 S. Africa 18.14 Indonesia -56.20 Mexico 56.63 Egypt 12.42 Poland -29.52 Malaysia 14.27 Colombia -21.14 Poland -13.60 S. Africa -25.13 Malaysia -3.89 Korea -66.67 Colombia -41.71 Hungary 11.66 Turkey -45.65 China -24.70 Taiwan -24.45 Poland 35.48 Russia 5.69 Indonesia 15.76 Colombia 13.76 Hungary 16.80 Hungary -61.53 Malaysia 52.06 Brazil 6.81 Hungary -33.65 Chile 8.34 Chile -21.41 Brazil -13.74 Turkey -31.55 Philippines -6.10 Malaysia -67.98 China -42.37 Czech Rep. 5.35 Korea -49.62 Poland -27.44 Philippines -28.98 Mexico 32.81 Peru 3.16 Thailand 9.16 Korea 13.19 Colombia 15.00 Turkey -62.10 Poland 42.51 China 4.83 Turkey -35.16 Indonesia 5.22 Indonesia -23.10 Colombia -19.80 Peru -31.66 Turkey -8.12 Thailand -73.43 Turkey -52.51 Philippines 3.32 Thailand -56.27 Turkey -32.66 Brazil -30.65 Hungary 32.31 China 1.89 Taiwan 7.25 Thailand 11.61 Mexico 12.15 India -64.63 Egypt 39.74 Czech Rep. -1.66 India -37.17 Czech Rep. 3.48 Turkey -26.52 Hungary -27.44 Brazil -41.18 Mexico -8.98 Indonesia -74.06 Russia -82.99 Colombia -14.38 Indonesia -61.90 Egypt -41.30 Turkey -35.70 Malaysia 26.61 Thailand -0.92 Malaysia 2.29 Turkey -6.97 Taiwan 9.13 Russia -73.83 Czech Rep. 27.77 Hungary -9.58 Egypt -46.86 Brazil 0.34 Peru -29.84 Russia -45.86 Colombia -41.80 Egypt -11.39 Highest Return Lowest Return
  • 9. Equity Returns of Emerging Markets 9 Annual Return (%) In US dollars. Source: MSCI emerging markets country indices (gross dividends). MSCI data © MSCI 2017, all rights reserved. Indices are not available for direct investment. Index performance does not reflect expenses associated with the management of an actual portfolio. Past performance is not a guarantee of future results. 1997 1998 1999 2000 2001 2002 2003 2004 2005 2006 2007 2008 2009 2010 2011 2012 2013 2014 2015 2016 Brazil 27.3 -39.6 67.2 -11.4 -17.0 -30.7 115.0 36.5 57.0 45.8 80.0 -56.1 128.6 6.8 -21.6 0.3 -15.8 -13.7 -41.2 66.7 Chile 5.5 -28.5 39.0 -15.1 -2.8 -19.8 84.4 29.0 21.6 29.3 23.7 -35.4 86.7 44.8 -20.0 8.3 -21.4 -12.2 -16.8 16.8 China -25.3 -42.4 13.3 -30.5 -24.7 -14.0 87.6 1.9 19.8 82.9 66.2 -50.8 62.6 4.8 -18.2 23.1 4.0 8.3 -7.6 1.1 Colombia 41.8 -41.7 -14.4 -38.9 45.8 25.4 66.9 133.0 107.5 13.8 15.0 -25.1 84.3 43.4 -5.0 35.9 -21.1 -19.8 -41.8 26.5 Czech Republic -22.7 0.5 5.3 1.6 -2.0 44.2 66.2 87.3 46.2 34.7 55.9 -42.7 27.8 -1.7 -5.0 3.5 -8.1 -2.4 -16.5 -2.5 Egypt 31.2 -27.0 88.4 -43.7 -41.3 1.6 91.8 126.2 161.6 17.1 58.4 -52.4 39.7 12.4 -46.9 47.1 8.2 29.3 -23.5 -11.4 Hungary 95.2 -8.2 11.7 -26.8 -9.2 30.7 32.3 92.5 18.5 33.7 16.8 -61.5 77.6 -9.6 -33.6 22.8 -5.8 -27.4 36.3 35.4 India 11.3 -21.2 87.3 -21.7 -19.5 8.4 78.4 19.1 37.6 51.0 73.1 -64.6 102.8 20.9 -37.2 26.0 -3.8 23.9 -6.1 -1.4 Indonesia -74.1 -31.5 93.5 -61.9 -8.5 42.8 78.2 52.2 15.8 74.8 55.0 -56.2 127.6 34.6 6.5 5.2 -23.1 27.2 -19.1 17.5 Korea -66.7 141.1 92.4 -49.6 48.7 8.6 35.9 22.9 58.0 13.2 32.6 -55.1 72.1 27.2 -11.8 21.5 4.2 -10.7 -6.3 9.2 Malaysia -68.0 -30.8 114.3 -16.0 4.6 -0.7 26.6 15.2 2.3 37.1 46.1 -41.2 52.1 37.0 0.1 14.3 7.7 -10.7 -20.1 -3.9 Mexico 53.9 -33.5 80.1 -20.5 18.5 -13.3 32.8 48.3 49.1 41.4 12.2 -42.9 56.6 27.6 -12.1 29.1 0.2 -9.2 -14.2 -9.0 Peru 20.5 -40.2 18.9 -23.8 19.9 30.5 94.3 3.2 35.0 62.6 94.7 -40.1 72.1 53.3 -21.4 20.2 -29.8 10.5 -31.7 55.6 Philippines -62.6 13.5 3.3 -45.0 -19.3 -29.0 42.8 26.6 23.9 59.7 41.7 -51.9 68.0 35.5 0.1 47.6 -2.0 26.4 -6.3 -6.1 Poland -22.4 -6.7 31.5 -4.0 -27.4 1.3 35.5 61.5 25.0 41.9 25.8 -54.5 42.5 15.9 -29.5 41.0 3.6 -13.6 -24.9 0.7 Russia 112.1 -83.0 247.1 -30.0 55.9 15.7 75.9 5.7 73.8 55.9 24.8 -73.8 104.9 19.4 -19.3 14.4 1.4 -45.9 5.0 55.9 South Africa -8.2 -27.6 57.2 -17.2 -17.2 28.0 45.9 44.9 28.3 20.5 18.1 -37.9 57.8 34.2 -14.4 19.0 -5.8 5.7 -25.1 18.4 Taiwan -6.3 -20.6 52.7 -44.9 10.5 -24.5 42.5 9.8 7.3 20.9 9.1 -45.9 80.2 22.7 -20.2 17.7 9.8 10.1 -11.0 19.6 Thailand -73.4 11.6 47.2 -56.3 5.3 27.6 144.6 -0.9 9.2 11.6 46.6 -48.3 77.3 56.3 -2.4 34.9 -14.3 16.8 -23.3 27.0 Turkey 118.1 -52.5 252.4 -45.6 -32.7 -35.7 125.9 42.0 56.9 -7.0 74.8 -62.1 98.5 21.2 -35.2 64.9 -26.5 19.1 -31.6 -8.1 Boxed Return is highest return for the year.
  • 10. In US dollars. MSCI Country Indices (net dividends). MSCI data © MSCI 2017, all rights reserved. Indices are not available for direct investment. Their performance does not reflect the expenses associated with the management of an actual portfolio. Past performance is not a guarantee of future results. Best minus Worst Performing Developed Markets 10 Year Worst Performer (%) Best Performer (%) Best – Worst Return Difference (%) Year Worst Performer (%) Best Performer (%) Best – Worst Return Difference (%) 1988 New Zealand -13.8 Belgium 53.6 67.4 2003 Finland 19.4 Sweden 64.5 45.1 1989 Finland -9.6 Austria 103.9 113.5 2004 Finland 6.1 Austria 71.5 65.4 1990 New Zealand -37.7 UK 10.3 48.0 2005 Ireland -2.3 Canada 28.3 30.6 1991 Finland -18.1 Hong Kong 49.5 67.6 2006 Japan 6.2 Spain 49.4 43.1 1992 Denmark -28.2 Hong Kong 32.3 60.5 2007 Ireland -20.1 Finland 48.7 68.7 1993 USA 9.1 Hong Kong 116.7 107.6 2008 Ireland -71.9 Japan -29.2 42.7 1994 Hong Kong -28.9 Finland 52.2 81.1 2009 Japan 6.3 Norway 87.1 80.8 1995 Austria -4.7 Switzerland 44.1 48.8 2010 Spain -22.0 Sweden 33.8 55.7 1996 Japan -15.5 Spain 40.1 55.6 2011 Austria -36.4 Ireland 13.7 50.1 1997 Singapore -30.0 Switzerland 44.2 74.3 2012 Spain 3.0 Belgium 39.6 36.5 1998 Norway -30.1 Finland 121.6 151.7 2013 Singapore 1.7 Finland 46.0 44.3 1999 Belgium -14.3 Finland 152.6 166.9 2014 Austria -29.8 USA 12.7 42.5 2000 New Zealand -33.5 Switzerland 5.9 39.4 2015 Canada -24.2 Denmark 23.4 47.6 2001 Finland -38.2 New Zealand 8.4 46.6 2016 Denmark -15.8 Canada 24.6 40.3 2002 Germany -33.2 New Zealand 24.2 57.4 Average of Worst Performers (%) -17.5% Average of Best Performers (%) 47.4% Average Best – Worst Return Difference (%) 64.8%
  • 11. In US dollars. MSCI Emerging Markets Country Indices (gross dividends). MSCI data © MSCI 2017, all rights reserved. Indices are not available for direct investment. Their performance does not reflect the expenses associated with the management of an actual portfolio. Past performance is not a guarantee of future results. Best minus Worst Performing Emerging Markets 11 Year Worst Performer (%) Best Performer (%) Best – Worst Return Difference (%) Year Worst Performer (%) Best Performer (%) Best – Worst Return Difference (%) 1995 India -30.9 Peru 23.3 54.2 2006 Turkey -7.0 China 82.9 89.8 1996 Korea -38.1 Russia 152.9 191.1 2007 Taiwan 9.1 Peru 94.7 85.6 1997 Indonesia -74.1 Turkey 118.1 192.1 2008 Russia -73.8 Colombia -25.1 48.7 1998 Russia -83.0 Korea 141.1 224.1 2009 Czech Republic 27.8 Brazil 128.6 100.8 1999 Colombia -14.4 Turkey 252.4 266.8 2010 Hungary -9.6 Thailand 56.3 65.8 2000 Indonesia -61.9 Czech Republic 1.6 63.5 2011 Egypt -46.9 Indonesia 6.5 53.4 2001 Egypt -41.3 Russia 55.9 97.2 2012 Brazil 0.3 Turkey 64.9 64.5 2002 Turkey -35.7 Czech Republic 44.2 79.9 2013 Peru -29.8 Taiwan 9.8 39.6 2003 Malaysia 26.6 Thailand 144.6 117.9 2014 Russia -45.9 Egypt 29.3 75.2 2004 Thailand -0.9 Colombia 133.0 133.9 2015 Colombia -41.8 Hungary 36.3 78.1 2005 Malaysia 2.3 Egypt 161.6 159.3 2016 Egypt -11.4 Brazil 66.7 78.1 Average of Worst Performers (%) -26.4% Average of Best Performers (%) 80.9% Average Best – Worst Return Difference (%) 107.3%
  • 12. In US dollars. Sources: Dimensional for Dimensional Index data. See "Dimensional Equity Balanced Strategy Index Description" slide in the Appendix for more information. Indices are not available for direct investment and performance does not reflect expenses of an actual portfolio. Past performance is not a guarantee of future results. The S&P data is provided by Standard & Poor's Index Services Group. Global Balanced Equity Strategy Index vs. S&P 500 vs. T-Bills Performance: January 1970–December 1979 12 Dimensional Equity Balanced Strategy Index $3.50 S&P 500 Index $1.77 US One-Month Treasury Bills $1.84 #44915-0315 $0.00 $0.50 $1.00 $1.50 $2.00 $2.50 $3.00 $3.50 $4.00 1970 1971 1972 1973 1974 1975 1976 1977 1978 1979
  • 13. In US dollars. Sources: Dimensional for Dimensional Index data. See "Dimensional Equity Balanced Strategy Index Description" slide in the Appendix for more information. Indices are not available for direct investment and performance does not reflect expenses of an actual portfolio. Past performance is not a guarantee of future results. The S&P data is provided by Standard & Poor's Index Services Group. Global Balanced Equity Strategy Index vs. S&P 500 vs. T-Bills Performance: January 1980–December 1989 13 #44915-0315 Dimensional Equity Balanced Strategy Index $7.32 S&P 500 Index $5.04 US One-Month Treasury Bills $2.34 $0.00 $1.00 $2.00 $3.00 $4.00 $5.00 $6.00 $7.00 $8.00 1980 1981 1982 1983 1984 1985 1986 1987 1988 1989
  • 14. In US dollars. Sources: Dimensional for Dimensional Index data. See "Dimensional Equity Balanced Strategy Index Description" slide in the Appendix for more information. Indices are not available for direct investment and performance does not reflect expenses of an actual portfolio. Past performance is not a guarantee of future results. The S&P data is provided by Standard & Poor's Index Services Group. Global Balanced Equity Strategy Index vs. S&P 500 vs. T-Bills Performance: January 1990–December 1999 14 #44915-0315 Dimensional Equity Balanced Strategy Index $3.59 S&P 500 Index $5.33 US One-Month Treasury Bills $1.62 $0.00 $1.00 $2.00 $3.00 $4.00 $5.00 $6.00 1990 1991 1992 1993 1994 1995 1996 1997 1998 1999
  • 15. In US dollars. Sources: Dimensional for Dimensional Index data. See "Dimensional Equity Balanced Strategy Index Description" slide in the Appendix for more information. Indices are not available for direct investment and performance does not reflect expenses of an actual portfolio. Past performance is not a guarantee of future results. The S&P data is provided by Standard & Poor's Index Services Group. Global Balanced Equity Strategy Index vs. S&P 500 vs. T-Bills Performance: January 2000–December 2009 15 #44915-0315 Dimensional Equity Balanced Strategy Index $2.06 S&P 500 Index $0.91 US One-Month Treasury Bills $1.31 $0.00 $0.50 $1.00 $1.50 $2.00 $2.50 $3.00 2000 2001 2002 2003 2004 2005 2006 2007 2008 2009
  • 16. In US dollars. Sources: Dimensional for Dimensional Index data. See "Dimensional Equity Balanced Strategy Index Description" slide in the Appendix for more information. Indices are not available for direct investment and performance does not reflect expenses of an actual portfolio. Past performance is not a guarantee of future results. The S&P data is provided by Standard & Poor's Index Services Group. Global Balanced Equity Strategy Index vs. S&P 500 vs. T-Bills Performance: January 2010–December 2016 16 #44915-0315 Dimensional Equity Balanced Strategy Index $2.12 S&P 500 Index $2.33 US One-Month Treasury Bills $1.00 $0.00 $0.50 $1.00 $1.50 $2.00 $2.50 2010 2011 2012 2013 2014 2015 2016
  • 17. In US dollars. Sources: Dimensional for Dimensional Index data. See "Dimensional Equity Balanced Strategy Index Description" slide in the Appendix for more information. Indices are not available for direct investment and performance does not reflect expenses of an actual portfolio. Past performance is not a guarantee of future results. The S&P data is provided by Standard & Poor's Index Services Group. Global Balanced Equity Strategy Index vs. S&P 500 vs. T-Bills Performance: January 1970–December 2016 17 #44915-0315 One-Month T-Bill $9.21 Dimensional Equity Balanced Strategy Index $400.50 S&P 500 Index $100.40 $0.0 $50.0 $100.0 $150.0 $200.0 $250.0 $300.0 $350.0 $400.0 $450.0 1970 1972 1974 1976 1978 1980 1982 1984 1986 1988 1990 1992 1994 1996 1998 2000 2002 2004 2006 2008 2010 2012 2014 2016
  • 18. In US dollars. Sources: Dimensional for Dimensional Index data. Dimensional Equity Balanced Strategy Index vs. S&P 500: There are 444 overlapping 10-year periods. See "Dimensional Equity Balanced Strategy Index Description" slide in the Appendix for more information. Indices are not available for direct investment and performance does not reflect expenses of an actual portfolio. Past performance is not a guarantee of future results. The S&P data is provided by Standard & Poor's Index Services Group. Global Exposure to Higher Expected Returns 10-Year Rolling Returns: January 1980–December 2016 18 The Dimensional Equity Balanced Strategy Index outperformed the S&P 500 Index 84.0% of overlapping 10-year periods. -5% 0% 5% 10% 15% 20% 25% 30% 1980 1981 1982 1983 1984 1985 1986 1987 1988 1989 1990 1991 1992 1993 1994 1995 1996 1997 1998 1999 2000 2001 2002 2003 2004 2005 2006 2007 2008 2009 2010 2011 2012 2013 2014 2015 2016 Dimensional Equity Balanced Strategy Index S&P 500 Index
  • 19. Date 1970 1971 1972 1973 1974 1975 1976 1977 1978 1979 1980 1981 1982 1983 1984 1985 1986 1987 1988 1989 1990 1991 1992 1993 1994 1995 1996 1997 1998 1999 2000 2001 2002 2003 2004 2005 2006 2007 2008 2009 2010 2011 2012 2013 2014 2015 2016 1970 -3.8 1971 4.0 12.4 1972 4.7 9.3 6.2 1973 2.5 4.7 1.0 -3.9 1974 2.7 4.4 1.9 -0.3 3.5 1975 4.2 5.9 4.3 3.7 7.7 12.0 1976 4.6 6.1 4.9 4.5 7.5 9.5 7.0 1977 7.1 8.7 8.1 8.5 11.8 14.7 16.1 25.9 1978 8.2 9.8 9.4 10.0 13.0 15.5 16.6 21.7 17.7 1979 7.7 9.1 8.6 9.0 11.3 12.9 13.2 15.3 10.3 3.4 1980 6.6 7.7 7.2 7.3 9.0 9.9 9.5 10.2 5.4 -0.3 -3.9 1981 7.0 8.0 7.6 7.8 9.3 10.2 9.9 10.4 6.9 3.5 3.6 11.5 1982 6.0 6.9 6.4 6.4 7.6 8.1 7.6 7.7 4.4 1.3 0.6 2.9 -5.0 1983 6.3 7.2 6.7 6.8 7.9 8.4 8.0 8.1 5.4 3.1 3.0 5.4 2.5 10.6 1984 6.1 6.8 6.4 6.4 7.4 7.8 7.3 7.4 5.0 3.0 2.9 4.7 2.5 6.4 2.4 1985 6.0 6.7 6.3 6.3 7.2 7.5 7.1 7.1 5.0 3.2 3.2 4.7 3.1 5.9 3.6 4.8 1986 6.2 6.9 6.5 6.6 7.4 7.7 7.4 7.4 5.5 4.1 4.2 5.6 4.4 6.9 5.7 7.4 10.1 1987 6.2 6.8 6.5 6.5 7.3 7.6 7.2 7.2 5.5 4.3 4.4 5.6 4.6 6.7 5.7 6.9 7.9 5.7 1988 6.4 7.0 6.7 6.8 7.5 7.8 7.5 7.5 6.0 4.9 5.0 6.2 5.5 7.3 6.7 7.8 8.8 8.1 10.6 1989 5.9 6.4 6.1 6.1 6.7 7.0 6.6 6.6 5.1 4.0 4.1 5.0 4.2 5.6 4.8 5.3 5.4 3.9 3.0 -4.1 1990 5.0 5.5 5.1 5.0 5.6 5.7 5.3 5.2 3.8 2.7 2.6 3.3 2.4 3.4 2.4 2.4 1.9 -0.1 -2.0 -7.7 -11.1 1991 4.7 5.1 4.8 4.7 5.2 5.3 4.9 4.8 3.4 2.4 2.3 2.9 2.1 2.9 2.0 1.9 1.4 -0.2 -1.7 -5.5 -6.1 -0.8 1992 4.6 5.0 4.7 4.6 5.0 5.1 4.7 4.6 3.3 2.4 2.3 2.8 2.1 2.8 2.0 1.9 1.5 0.1 -1.0 -3.7 -3.5 0.6 2.0 1993 5.2 5.6 5.3 5.2 5.7 5.8 5.5 5.4 4.2 3.4 3.4 4.0 3.4 4.1 3.5 3.6 3.5 2.6 2.1 0.5 1.6 6.3 10.0 18.8 1994 5.1 5.5 5.2 5.1 5.6 5.7 5.4 5.3 4.2 3.4 3.4 3.9 3.4 4.1 3.5 3.6 3.5 2.7 2.3 1.0 2.0 5.6 7.8 10.9 3.6 1995 4.2 4.5 4.2 4.1 4.5 4.6 4.2 4.1 3.0 2.2 2.1 2.5 1.9 2.4 1.8 1.7 1.4 0.5 -0.1 -1.6 -1.2 1.0 1.4 1.2 -6.5 -15.6 1996 4.0 4.3 4.0 3.9 4.2 4.3 3.9 3.8 2.7 1.9 1.8 2.2 1.6 2.1 1.5 1.4 1.1 0.2 -0.4 -1.6 -1.3 0.5 0.7 0.4 -5.0 -9.1 -2.0 1997 3.2 3.5 3.2 3.1 3.4 3.4 3.0 2.8 1.8 1.0 0.9 1.1 0.5 0.9 0.2 0.1 -0.3 -1.2 -1.9 -3.2 -3.0 -1.8 -2.0 -2.7 -7.5 -10.9 -8.5 -14.5 1998 2.2 2.4 2.0 1.9 2.1 2.0 1.6 1.4 0.3 -0.4 -0.6 -0.5 -1.1 -0.9 -1.6 -1.9 -2.4 -3.4 -4.1 -5.5 -5.7 -4.9 -5.5 -6.7 -11.1 -14.4 -14.0 -19.5 -24.2 1999 2.0 2.2 1.9 1.7 1.9 1.9 1.5 1.2 0.2 -0.5 -0.7 -0.5 -1.2 -1.0 -1.6 -1.9 -2.4 -3.3 -4.0 -5.2 -5.3 -4.6 -5.1 -6.1 -9.7 -12.1 -11.2 -14.1 -13.8 -2.1 2000 2.3 2.5 2.2 2.1 2.3 2.2 1.9 1.7 0.7 0.0 -0.1 0.0 -0.5 -0.3 -0.9 -1.1 -1.5 -2.2 -2.8 -3.9 -3.8 -3.1 -3.3 -4.0 -6.8 -8.5 -7.0 -8.2 -5.9 4.8 12.1 2001 2.7 2.9 2.6 2.5 2.7 2.7 2.3 2.1 1.2 0.6 0.5 0.7 0.1 0.4 -0.1 -0.3 -0.6 -1.2 -1.7 -2.6 -2.5 -1.6 -1.7 -2.1 -4.5 -5.6 -3.8 -4.1 -1.4 7.7 12.9 13.8 2002 2.9 3.2 2.9 2.8 3.0 3.0 2.7 2.5 1.7 1.0 0.9 1.2 0.7 1.0 0.5 0.4 0.2 -0.4 -0.8 -1.6 -1.4 -0.5 -0.5 -0.8 -2.7 -3.5 -1.6 -1.5 1.3 8.9 12.8 13.2 12.5 2003 3.4 3.6 3.3 3.3 3.5 3.5 3.2 3.1 2.3 1.7 1.6 1.9 1.5 1.8 1.4 1.3 1.1 0.6 0.3 -0.3 -0.1 0.8 1.0 0.9 -0.7 -1.2 0.8 1.2 4.0 10.8 14.3 15.0 15.7 18.9 2004 3.6 3.9 3.6 3.5 3.8 3.8 3.5 3.4 2.7 2.1 2.1 2.3 1.9 2.3 1.9 1.9 1.7 1.3 1.0 0.4 0.7 1.6 1.8 1.8 0.4 0.1 2.0 2.5 5.2 11.1 14.0 14.5 14.7 15.8 12.7 2005 3.8 4.0 3.8 3.7 3.9 3.9 3.7 3.6 2.9 2.3 2.3 2.6 2.2 2.5 2.2 2.2 2.0 1.6 1.4 0.9 1.2 2.1 2.3 2.3 1.1 0.8 2.6 3.2 5.6 10.7 13.0 13.2 13.1 13.3 10.6 8.4 2006 3.9 4.1 3.9 3.8 4.1 4.1 3.8 3.7 3.0 2.6 2.5 2.8 2.4 2.8 2.4 2.4 2.3 2.0 1.8 1.3 1.6 2.5 2.7 2.8 1.6 1.5 3.2 3.7 5.9 10.5 12.4 12.4 12.2 12.1 9.9 8.5 8.6 2007 3.7 3.9 3.7 3.6 3.8 3.8 3.6 3.5 2.8 2.3 2.3 2.5 2.2 2.5 2.1 2.1 2.0 1.6 1.4 1.0 1.3 2.1 2.2 2.3 1.2 1.0 2.5 2.9 4.9 8.7 10.1 9.9 9.2 8.6 6.1 4.0 1.9 -4.4 2008 3.5 3.6 3.4 3.3 3.6 3.6 3.3 3.2 2.5 2.1 2.0 2.2 1.9 2.2 1.9 1.8 1.7 1.4 1.1 0.7 1.0 1.7 1.8 1.8 0.8 0.6 1.9 2.3 4.0 7.3 8.4 7.9 7.1 6.3 3.9 1.8 -0.3 -4.5 -4.6 2009 3.7 3.9 3.7 3.7 3.9 3.9 3.7 3.6 2.9 2.5 2.5 2.7 2.4 2.7 2.4 2.4 2.3 1.9 1.8 1.4 1.7 2.4 2.6 2.6 1.7 1.5 2.9 3.3 4.9 8.1 9.1 8.8 8.2 7.6 5.8 4.5 3.5 1.9 5.2 15.9 2010 3.8 4.0 3.8 3.7 4.0 4.0 3.7 3.7 3.0 2.6 2.6 2.8 2.5 2.8 2.5 2.5 2.4 2.1 2.0 1.6 1.9 2.6 2.8 2.8 2.0 1.9 3.1 3.5 5.0 7.9 8.9 8.6 8.0 7.5 5.9 4.8 4.1 3.1 5.7 11.2 6.7 2011 3.5 3.7 3.5 3.4 3.6 3.6 3.4 3.3 2.7 2.3 2.2 2.4 2.2 2.4 2.1 2.1 2.0 1.7 1.5 1.2 1.4 2.1 2.2 2.2 1.4 1.2 2.4 2.7 4.1 6.6 7.4 7.0 6.3 5.6 4.1 2.9 2.0 0.7 2.1 4.4 -0.9 -8.0 2012 3.5 3.7 3.5 3.4 3.6 3.6 3.4 3.3 2.7 2.3 2.3 2.5 2.2 2.4 2.2 2.1 2.0 1.7 1.6 1.2 1.5 2.1 2.2 2.2 1.4 1.3 2.4 2.7 4.0 6.3 7.0 6.6 6.0 5.3 3.9 2.9 2.1 1.1 2.2 4.0 0.3 -2.8 2.7 2013 3.3 3.5 3.3 3.2 3.4 3.4 3.2 3.1 2.5 2.1 2.0 2.2 2.0 2.2 1.9 1.9 1.8 1.5 1.3 1.0 1.2 1.8 1.9 1.9 1.1 1.0 2.0 2.2 3.4 5.6 6.1 5.7 5.0 4.4 3.0 2.0 1.2 0.2 1.0 2.1 -1.0 -3.5 -1.1 -4.8 2014 3.1 3.2 3.0 2.9 3.1 3.1 2.9 2.8 2.2 1.8 1.8 2.0 1.7 1.9 1.6 1.6 1.5 1.2 1.0 0.7 0.9 1.4 1.5 1.5 0.7 0.6 1.5 1.7 2.8 4.7 5.2 4.7 4.1 3.4 2.1 1.1 0.3 -0.7 -0.2 0.6 -2.2 -4.3 -3.0 -5.8 -6.8 2015 2.9 3.1 2.9 2.8 2.9 2.9 2.7 2.6 2.1 1.7 1.6 1.8 1.5 1.7 1.4 1.4 1.3 1.0 0.8 0.5 0.7 1.2 1.3 1.2 0.5 0.4 1.2 1.4 2.4 4.2 4.6 4.1 3.5 2.8 1.5 0.6 -0.2 -1.1 -0.7 -0.1 -2.5 -4.3 -3.3 -5.3 -5.5 -4.2 2016 3.0 3.1 2.9 2.8 3.0 3.0 2.8 2.7 2.1 1.8 1.7 1.9 1.6 1.8 1.6 1.5 1.4 1.2 1.0 0.7 0.9 1.4 1.4 1.4 0.7 0.6 1.4 1.6 2.5 4.3 4.7 4.2 3.6 3.0 1.9 1.0 0.4 -0.4 0.0 0.6 -1.4 -2.7 -1.6 -2.6 -1.9 0.7 5.8 The difference is Positive 85.3% of the time. The difference is Negative 14.7% of the time. In US dollars. The indices are not available for direct investment; therefore, their performance does not reflect the expenses associated with the management of an actual portfolio. Past performance is no guarantee of future results, and there is always the risk that an investor may lose money. Sources: Dimensional Index data compiled by Dimensional; the S&P data is provided by Standard & Poor’s Index Services Group. See "Dimensional Equity Balanced Strategy Index Description" slides in the Appendix for more information. Global Exposure to Higher Expected Returns Dimensional Equity Balanced Strategy Index minus S&P 500 Index 19 X.X Difference is positive X.X Difference is negative Annual: January 1970–December 2016
  • 20. Global Diversification: Managing Client Expectations Annual returns rankings of the Dimensional Equity Balanced Strategy Index and its component indices, 1970–2016 20 In US dollars. These indices are the current components of the Dimensional Equity Balanced Strategy Index as of 1994 –present. Indices are not available for direct investment and performance does not reflect expenses of an actual portfolio. Sources: Dimensional for Dimensional Index data. Indices are not available for direct investment and performance does not reflect expenses of an actual portfolio. Past performance is not a guarantee of future results. The S&P data is provided by Standard & Poor's Index Services Group. See Appendix for Descriptions of Dimensional Indices. Dimensional Equity Balanced Strategy Dimensional US Small Cap Dimensional International Marketwide Value Dimensional Emerging Markets S&P 500 Dimensional US Small Cap Value Dimensional International Small Cap Dimensional Emerging Markets Value Dimensional US Large Cap Value Dow Jones US Select REIT Index Dimensional International Small Cap Value Dimensional Emerging Markets Small Cap Highest Return Lowest Return 70 71 72 73 74 75 76 77 78 79 80 81 82 83 84 85 86 87 88 89 90 91 92 93 94 95 96 97 98 99 00 01 02 03 04 05 06 07 08 09 10 11 12 13 14 15 16
  • 21. In US dollars. These indices are the current components of the Dimensional Equity Balanced Strategy Index as of 1994 –present. Indices are not available for direct investment and performance does not reflect expenses of an actual portfolio. Sources: Dimensional for Dimensional Index data. Indices are not available for direct investment and performance does not reflect expenses of an actual portfolio. Past performance is not a guarantee of future results. The S&P data is provided by Standard & Poor's Index Services Group. See Appendix for Descriptions of Dimensional Indices. Global Diversification: Managing Client Expectations Annual returns rankings of the Dimensional Equity Balanced Strategy Index and its component indices, 1970–2016 21 #44915-0315 S&P 500 (SP) 70 71 72 73 74 75 76 77 78 79 80 81 82 83 84 85 86 87 88 89 90 91 92 93 94 95 96 97 98 99 00 01 02 03 04 05 06 07 08 09 10 11 12 13 14 15 16 SP SP SP SP SP SP SP SP SP SP SP SP SP SP SP SP SP SP SP SP SP SP SP SP SP SP SP SP SP SP SP SP SP SP SP SP SP SP SP SP SP SP SP SP SP SP SP Highest Return Lowest Return
  • 22. In US dollars. These indices are the current components of the Dimensional Equity Balanced Strategy Index as of 1994 –present. Indices are not available for direct investment and performance does not reflect expenses of an actual portfolio. Sources: Dimensional for Dimensional Index data. Indices are not available for direct investment and performance does not reflect expenses of an actual portfolio. Past performance is not a guarantee of future results. The S&P data is provided by Standard & Poor's Index Services Group. See Appendix for Descriptions of Dimensional Indices. Global Diversification: Managing Client Expectations Annual returns rankings of the Dimensional Equity Balanced Strategy Index and its component indices, 1970–2016 22 Did diversification work? • The S&P 500 did better than the globally diversified index 18 times. • It did worse 29 times. #44915-0315 Dimensional Equity Balanced Strategy (G) S&P 500 (SP) S&P 500 (SP) Portfolio Returns S&P returns below Portfolio Returns S&P returns above Portfolio Returns 70 71 72 73 74 75 76 77 78 79 80 81 82 83 84 85 86 87 88 89 90 91 92 93 94 95 96 97 98 99 00 01 02 03 04 05 06 07 08 09 10 11 12 13 14 15 16 SP SP G G G SP SP SP SP SP G SP G G G SP SP SP SP G G SP G G G SP G SP SP G SP G SP SP G SP SP G G G G SP G G G G G G G SP SP SP G SP SP G G G G G G SP G G SP SP SP G SP SP G G SP SP G SP G G G G G G SP SP SP SP SP SP SP SP SP SP SP Highest Return Lowest Return
  • 24. Dimensional Equity Balanced Strategy Index Description Rebalanced monthly. The Dimensional Equity Balanced Strategy Index is comprised of commercial and Dimensional indices, 70% US equity indices, and 30% non-US indices. US: S&P 500, large cap value, small cap, small cap value, Dow Jones REIT; non-US: international value, international small cap and small cap value, emerging markets, and emerging markets value and small cap. Additional index information is available upon request. Real Estate Strategy weighting allocated evenly between US Small Cap and US Small Cap Value prior to January 1978 data inception. International Value weighting allocated to Fama/French International Value Index prior to January 1994 data inception, and evenly between International Small Cap and MSCI EAFE Index (net dividends) prior to January 1975 data inception. International Small Cap Value weighting allocated to International Small Cap prior to July 1981 data inception. Emerging Markets weighting allocated to MSCI Emerging Markets Index (gross dividends) prior to January 1994 data inception, and evenly between International Small Cap and International Value prior to January 1988 data inception. Emerging Markets Value and Small Cap weighting allocated evenly between International Small Cap and International Value prior to January 1989 data inception. Two-Year Global weighting allocated to One-Year prior to January 1985 data inception. For illustrative purposes only. The balanced strategies are not recommendations for an actual allocation. Indices are not available for direct investment; their performance does not reflect the expenses associated with the management of an actual portfolio. Rebalanced monthly. All performance results of the balanced strategies are based on performance of indices with model/back- tested asset allocations; the performance was achieved with the benefit of hindsight; it does not represent actual investment strategies. The model’s performance does not reflect advisory fees or other expenses associated with the management of an actual portfolio. There are limitations inherent in model allocations. In particular, model performance may not reflect the impact that economic and market factors may have had on the advisor’s decision making if the advisor were actually managing client money. Past performance is no guarantee of future results. #44915-0315
  • 25. Descriptions of Dimensional Indices Dimensional US Large Cap Value Index is compiled by Dimensional from CRSP and Compustat data. Targets securities of US companies traded on the NYSE, NYSE MKT (formerly AMEX), and Nasdaq Global Market with market capitalizations above the 1,000th-largest company whose relative price is in the bottom 30% of the Dimensional US Large Cap Index after the exclusion of utilities, companies lacking financial data, and companies with negative relative price. The index emphasizes securities with higher profitability, lower relative price, and lower market capitalization. Profitability is measured as operating income before depreciation and amortization minus interest expense scaled by book. Exclusions: non-US companies, REITs, UITs, and investment companies. The index has been retroactively calculated by Dimensional and did not exist prior to March 2007. The calculation methodology for the Dimensional US Large Cap Value Index was amended in January 2014 to include direct profitability as a factor in selecting securities for inclusion in the index. Prior to January 1975: Targets securities of US companies traded on the NYSE, NYSE MKT (formerly AMEX), and Nasdaq Global Market with market capitalizations above the 1,000th-largest company whose relative price is in the bottom 20% of the Dimensional US Large Cap Index after the exclusion of utilities, companies lacking financial data, and companies with negative relative price. Dimensional US Small Cap Index was created by Dimensional in March 2007 and is compiled by Dimensional. It represents a market-capitalization-weighted index of securities of the smallest US companies whose market capitalization falls in the lowest 8% of the total market capitalization of the Eligible Market. The Eligible Market is composed of securities of US companies traded on the NYSE, NYSE MKT (formerly AMEX), and Nasdaq Global Market. Exclusions: Non-US companies, REITs, UITs, and investment companies. From January 1975 to the present, the index also excludes companies with the lowest profitability and highest relative price within the small cap universe. Profitability is measured as operating income before depreciation and amortization minus interest expense scaled by book. Source: CRSP and Compustat. The index monthly returns are computed as the simple average of the monthly returns of 12 sub-indices, each one reconstituted once a year at the end of a different month of the year. The calculation methodology for the Dimensional US Small Cap Index was amended on January 1, 2014, to include profitability as a factor in selecting securities for inclusion in the index. Dimensional US Small Cap Value Index is compiled by Dimensional from CRSP and Compustat data. Targets securities of US companies traded on the NYSE, NYSE MKT (formerly AMEX), and Nasdaq Global Market whose relative price is in the bottom 35% of the Dimensional US Small Cap Index after the exclusion of utilities, companies lacking financial data, and companies with negative relative price. The index emphasizes securities with higher profitability, lower relative price, and lower market capitalization. Profitability is measured as operating income before depreciation and amortization minus interest expense scaled by book. Exclusions: non-US companies, REITs, UITs, and investment companies. The index has been retroactively calculated by Dimensional and did not exist prior to March 2007. The calculation methodology for the Dimensional US Small Cap Value Index was amended in January 2014 to include direct profitability as a factor in selecting securities for inclusion in the index. Prior to January 1975: Targets securities of US companies traded on the NYSE, NYSE MKT (formerly AMEX), and Nasdaq Global Market whose relative price is in the bottom 25% of the Dimensional US Small Cap Index after the exclusion of utilities, companies lacking financial data, and companies with negative relative price. Dimensional International Marketwide Value Index is compiled by Dimensional from Bloomberg securities data. The index consists of companies whose relative price is in the bottom 33% of their country’s companies after the exclusion of utilities and companies with either negative or missing relative price data. The index emphasizes companies with smaller capitalization, lower relative price, and higher profitability. The index also excludes those companies with the lowest profitability and highest relative price within their country’s value universe. Profitability is measured as operating income before depreciation and amortization minus interest expense scaled by book. Exclusions: REITs and investment companies. The index has been retroactively calculated by Dimensional and did not exist prior to April 2008. The calculation methodology for the Dimensional International Marketwide Value Index was amended in January 2014 to include direct profitability as a factor in selecting securities for inclusion in the index. #44915-0315
  • 26. Descriptions of Dimensional Indices Dimensional International Small Cap Index was created by Dimensional in April 2008 and is compiled by Dimensional. July 1981–December 1993: It Includes non- US developed securities in the bottom 10% of market capitalization in each eligible country. All securities are market capitalization weighted. Each country is capped at 50%. Rebalanced semiannually. January 1994–Present: Market-capitalization- weighted index of small company securities in the eligible markets excluding those with the lowest profitability and highest relative price within the small cap universe. Profitability is measured as operating income before depreciation and amortization minus interest expense scaled by book. The index monthly returns are computed as the simple average of the monthly returns of four sub-indices, each one reconstituted once a year at the end of a different quarter of the year. Prior to July 1981, the index is 50% UK and 50% Japan. The calculation methodology for the Dimensional International Small Cap Index was amended on January 1, 2014, to include profitability as a factor in selecting securities for inclusion in the index. Dimensional International Small Cap Value Index is defined as companies whose relative price is in the bottom 35% of their country’s respective constituents in the Dimensional International Small Cap Index after the exclusion of utilities and companies with either negative or missing relative price data. The index also excludes those companies with the lowest profitability within their country’s small value universe. Profitability is measured as operating income before depreciation and amortization minus interest expense scaled by book. Exclusions: REITs and investment companies. The index has been retroactively calculated by Dimensional and did not exist prior to April 2008. The calculation methodology for the Dimensional International Small Cap Value Index was amended in January 2014 to include direct profitability as a factor in selecting securities for inclusion in the index. Prior to January 1994: Created by Dimensional; includes securities of MSCI EAFE countries in the top 30% of book-to-market by market capitalization conditional on the securities being in the bottom 10% of market capitalization, excluding the bottom 1%. All securities are market-capitalization weighted. Each country is capped at 50%; rebalanced semiannually. Dimensional Emerging Markets Index is compiled by Dimensional from Bloomberg securities data. Market-capitalization-weighted index of all securities in the eligible markets. The index has been retroactively calculated by Dimensional and did not exist prior to April 2008. Dimensional Emerging Markets Value Index is compiled by Dimensional from Bloomberg securities data. The index consists of companies whose relative price is in the bottom 33% of their country’s companies after the exclusion of utilities and companies with either negative or missing relative price data. The index emphasizes companies with smaller capitalization, lower relative price, and higher profitability. The index also excludes those companies with the lowest profitability and highest relative price within their country’s value universe. Profitability is measured as operating income before depreciation and amortization minus interest expense scaled by book. Exclusions: REITs and investment companies. The index has been retroactively calculated by Dimensional and did not exist prior to April 2008. The calculation methodology for the Dimensional Emerging Markets Value Index was amended in January 2014 to include profitability as a factor in selecting securities for inclusion in the index. Prior to January 1994: Fama/French Emerging Markets Value Index. Dimensional Emerging Markets Small Cap Index was created by Dimensional in April 2008 and is compiled by Dimensional. January 1989–December 1993: Fama/French Emerging Markets Small Cap Index. January 1994–Present: Dimensional Emerging Markets Small Index Composition: Market-capitalization- weighted index of small company securities in the eligible markets excluding those with the lowest profitability and highest relative price within the small cap universe. Profitability is measured as operating income before depreciation and amortization minus interest expense scaled by book. The index monthly returns are computed as the simple average of the monthly returns of four sub-indices, each one reconstituted once a year at the end of a different quarter of the year. Source: Bloomberg. The calculation methodology for the Dimensional Emerging Markets Small Cap Index was amended on January 1, 2014, to include profitability as a factor in selecting securities for inclusion in the index. #44915-0315