Q1Quarterly Market Review
First Quarter 2018
Quarterly Market Review
First Quarter 2018
Overview:
Market Summary
World Stock Market Performance
World Asset Classes
US Stocks
International Developed Stocks
Emerging Markets Stocks
Select Country Performance
Select Currency Performance vs. US Dollar
Real Estate Investment Trusts (REITs)
Commodities
Fixed Income
Impact of Diversification
Quarterly Topic: Sailing with the Tides
This report features world capital market performance
and a timeline of events for the past quarter. It begins
with a global overview, then features the returns of
stock and bond asset classes in the US and
international markets.
The report also illustrates the impact of globally
diversified portfolios and features a quarterly topic.
2
Market Summary
Past performance is not a guarantee of future results. Indices are not available for direct investment. Index performance does not reflect the expenses associated with the management of an actual portfolio.
Market segment (index representation) as follows: US Stock Market (Russell 3000 Index), International Developed Stocks (MSCI World ex USA Index [net div.]), Emerging Markets (MSCI Emerging Markets Index [net div.]),
Global Real Estate (S&P Global REIT Index [net div.]), US Bond Market (Bloomberg Barclays US Aggregate Bond Index and Bloomberg Barclays Global Aggregate ex-USD Bond Index [hedged to USD]). S&P data copyright
2018 S&P Dow Jones Indices LLC, a division of S&P Global. All rights reserved. Frank Russell Company is the source and owner of the trademarks, service marks, and copyrights related to the Russell Indexes. MSCI data ©
MSCI 2018, all rights reserved. Bloomberg Barclays data provided by Bloomberg. FTSE fixed income © 2018 FTSE Fixed Income LLC, all rights reserved.
Index Returns
US Stock
Market
International
Developed
Stocks
Emerging
Markets
Stocks
Global
Real
Estate
US Bond
Market
Global
Bond
Market
ex US
Q1 2018 STOCKS BONDS
-0.64% -2.04% 1.42% -5.79% -1.46% 0.94%
Since Jan. 2001
Avg. Quarterly Return 1.9% 1.5% 3.2% 2.5% 1.1% 1.1%
Best 16.8% 25.9% 34.7% 32.3% 4.6% 4.6%
Quarter
Q2 2009 Q2 2009 Q2 2009 Q3 2009 Q3 2001 Q4 2008
Worst -22.8% -21.2% -27.6% -36.1% -3.0% -2.7%
Quarter
Q4 2008 Q4 2008 Q4 2008 Q4 2008 Q4 2016 Q2 2015
3
210
220
230
240
250
260
270
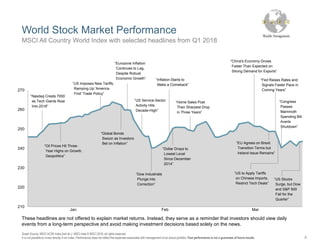
World Stock Market Performance
Graph Source: MSCI ACWI Index [net div.]. MSCI data © MSCI 2018, all rights reserved.
It is not possible to invest directly in an index. Performance does not reflect the expenses associated with management of an actual portfolio. Past performance is not a guarantee of future results.
MSCI All Country World Index with selected headlines from Q1 2018
These headlines are not offered to explain market returns. Instead, they serve as a reminder that investors should view daily
events from a long-term perspective and avoid making investment decisions based solely on the news.
Jan Feb Mar
4
“Nasdaq Crests 7000
as Tech Giants Roar
Into 2018”
“Inflation Starts to
Make a Comeback”
“Dollar Drops to
Lowest Level
Since December
2014”
“Home Sales Post
Their Sharpest Drop
in Three Years”
“Congress
Passes
Mammoth
Spending Bill,
Averts
Shutdown”
“Oil Prices Hit Three-
Year Highs on Growth,
Geopolitics”
“US Imposes New Tariffs,
Ramping Up 'America
First' Trade Policy”
“Global Bonds
Swoon as Investors
Bet on Inflation”
“Eurozone Inflation
Continues to Lag,
Despite Robust
Economic Growth”
“US Service-Sector
Activity Hits
Decade-High”
“Dow Industrials
Plunge into
Correction”
“China's Economy Grows
Faster Than Expected on
Strong Demand for Exports”
“EU Agrees on Brexit
Transition Terms but
Ireland Issue Remains”
“US to Apply Tariffs
on Chinese Imports,
Restrict Tech Deals”
“Fed Raises Rates and
Signals Faster Pace in
Coming Years”
“US Stocks
Surge, but Dow
and S&P 500
Fall for the
Quarter”
150
160
170
180
190
200
210
220
230
240
250
260
270
Mar-2017 Jun-2017 Sep-2017 Dec-2017 Mar-2018
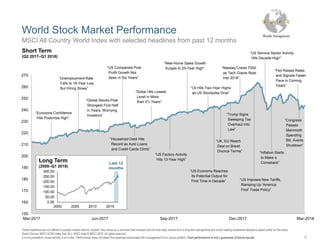
World Stock Market Performance
These headlines are not offered to explain market returns. Instead, they serve as a reminder that investors should view daily events from a long-term perspective and avoid making investment decisions based solely on the news.
Graph Source: MSCI ACWI Index [net div.]. MSCI data © MSCI 2018, all rights reserved.
It is not possible to invest directly in an index. Performance does not reflect the expenses associated with management of an actual portfolio. Past performance is not a guarantee of future results.
MSCI All Country World Index with selected headlines from past 12 months
Short Term
(Q2 2017–Q1 2018)
Long Term
(2000–Q1 2018)
0.00
50.00
100.00
150.00
200.00
250.00
300.00
2000 2005 2010 2015
Last 12
months
“Eurozone Confidence
Hits Postcrisis High”
“Global Stocks Post
Strongest First Half
in Years, Worrying
Investors”
“Unemployment Rate
Falls to 16-Year Low,
But Hiring Slows”
“US Companies Post
Profit Growth Not
Seen in Six Years”
“Household Debt Hits
Record as Auto Loans
and Credit Cards Climb”
“Dollar Hits Lowest
Level in More
than 2½ Years”
“US Factory Activity
Hits 13-Year High”
5
“New-Home Sales Growth
Surges to 25-Year High”
“Oil Hits Two-Year Highs
as US Stockpiles Drop”
“US Economy Reaches
Its Potential Output for
First Time in Decade”
“UK, EU Reach
Deal on Brexit
Divorce Terms”
“Trump Signs
Sweeping Tax
Overhaul Into
Law”
“Nasdaq Crests 7000
as Tech Giants Roar
Into 2018”
“Inflation Starts
to Make a
Comeback”
“Congress
Passes
Mammoth
Spending
Bill, Averts
Shutdown”
“US Imposes New Tariffs,
Ramping Up 'America
First' Trade Policy”
“US Service-Sector Activity
Hits Decade-High”
“Fed Raises Rates
and Signals Faster
Pace in Coming
Years”
World Asset Classes
Past performance is not a guarantee of future results. Indices are not available for direct investment. Index performance does not reflect the expenses associated with the management of an actual portfolio.
Frank Russell Company is the source and owner of the trademarks, service marks, and copyrights related to the Russell Indexes. MSCI data © MSCI 2018, all rights reserved. Dow Jones data copyright 2018 S&P Dow Jones
Indices LLC, a division of S&P Global. All rights reserved. S&P data copyright 2018 S&P Dow Jones Indices LLC, a division of S&P Global. All rights reserved. Bloomberg Barclays data provided by Bloomberg. Treasury bills ©
Stocks, Bonds, Bills, and Inflation Yearbook™, Ibbotson Associates, Chicago (annually updated work by Roger G. Ibbotson and Rex A. Sinquefield).
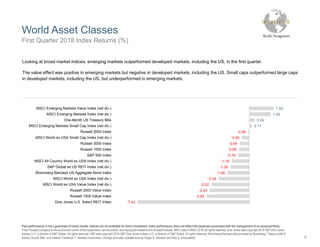
Looking at broad market indices, emerging markets outperformed developed markets, including the US, in the first quarter.
The value effect was positive in emerging markets but negative in developed markets, including the US. Small caps outperformed large caps
in developed markets, including the US, but underperformed in emerging markets.
First Quarter 2018 Index Returns (%)
-0.08
-0.50
-0.64
-0.69
-0.76
-1.18
-1.26
-1.46
-2.04
-2.52
-2.64
-2.83
-7.43
1.62
1.42
0.34
0.17
MSCI Emerging Markets Value Index (net div.)
MSCI Emerging Markets Index (net div.)
One-Month US Treasury Bills
MSCI Emerging Markets Small Cap Index (net div.)
Russell 2000 Index
MSCI World ex USA Small Cap Index (net div.)
Russell 3000 Index
Russell 1000 Index
S&P 500 Index
MSCI All Country World ex USA Index (net div.)
S&P Global ex US REIT Index (net div.)
Bloomberg Barclays US Aggregate Bond Index
MSCI World ex USA Index (net div.)
MSCI World ex USA Value Index (net div.)
Russell 2000 Value Index
Russell 1000 Value Index
Dow Jones U.S. Select REIT Index
6
US Stocks
First Quarter 2018 Index Returns
Past performance is not a guarantee of future results. Indices are not available for direct investment. Index performance does not reflect the expenses associated with the management of an actual portfolio.
Market segment (index representation) as follows: Marketwide (Russell 3000 Index), Large Cap (Russell 1000 Index), Large Cap Value (Russell 1000 Value Index), Large Cap Growth (Russell 1000 Growth Index), Small Cap
(Russell 2000 Index), Small Cap Value (Russell 2000 Value Index), and Small Cap Growth (Russell 2000 Growth Index). World Market Cap represented by Russell 3000 Index, MSCI World ex USA IMI Index, and MSCI
Emerging Markets IMI Index. Russell 3000 Index is used as the proxy for the US market. Frank Russell Company is the source and owner of the trademarks, service marks, and copyrights related to the Russell Indexes. MSCI
data © MSCI 2018, all rights reserved.
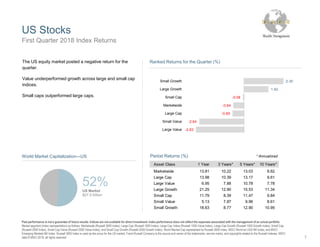
The US equity market posted a negative return for the
quarter.
Value underperformed growth across large and small cap
indices.
Small caps outperformed large caps.
World Market Capitalization—US
52%US Market
$27.0 trillion
Period Returns (%) * Annualized
Asset Class 1 Year 3 Years** 5 Years** 10 Years**
Marketwide 13.81 10.22 13.03 9.62
Large Cap 13.98 10.39 13.17 9.61
Large Value 6.95 7.88 10.78 7.78
Large Growth 21.25 12.90 15.53 11.34
Small Cap 11.79 8.39 11.47 9.84
Small Value 5.13 7.87 9.96 8.61
Small Growth 18.63 8.77 12.90 10.95
-0.08
-0.64
-0.69
-2.64
-2.83
2.30
1.42
Small Growth
Large Growth
Small Cap
Marketwide
Large Cap
Small Value
Large Value
Ranked Returns for the Quarter (%)
7
International Developed Stocks
First Quarter 2018 Index Returns
Past performance is not a guarantee of future results. Indices are not available for direct investment. Index performance does not reflect the expenses associated with the management of an actual portfolio.
Market segment (index representation) as follows: Large Cap (MSCI World ex USA Index), Small Cap (MSCI World ex USA Small Cap Index), Value (MSCI World ex USA Value Index), and Growth (MSCI World ex USA
Growth). All index returns are net of withholding tax on dividends. World Market Cap represented by Russell 3000 Index, MSCI World ex USA IMI Index, and MSCI Emerging Markets IMI Index. MSCI World ex USA IMI Index is
used as the proxy for the International Developed market. MSCI data © MSCI 2018, all rights reserved. Frank Russell Company is the source and owner of the trademarks, service marks, and copyrights related to the Russell
Indexes.
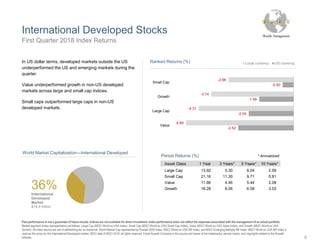
In US dollar terms, developed markets outside the US
underperformed the US and emerging markets during the
quarter.
Value underperformed growth in non-US developed
markets across large and small cap indices.
Small caps outperformed large caps in non-US
developed markets.
Period Returns (%) * Annualized
Asset Class 1 Year 3 Years** 5 Years** 10 Years**
Large Cap 13.92 5.30 6.04 2.59
Small Cap 21.16 11.30 9.71 5.81
Value 11.66 4.46 5.44 2.08
Growth 16.28 6.06 6.58 3.0336%International
Developed
Market
$18.9 trillion
World Market Capitalization—International Developed
-2.96
-3.74
-4.31
-4.89
-0.50
-1.56
-2.04
-2.52
Small Cap
Growth
Large Cap
Value
Ranked Returns (%) Local currency US currency
8
Emerging Markets Stocks
First Quarter 2018 Index Returns
Past performance is not a guarantee of future results. Indices are not available for direct investment. Index performance does not reflect the expenses associated with the management of an actual portfolio.
Market segment (index representation) as follows: Large Cap (MSCI Emerging Markets Index), Small Cap (MSCI Emerging Markets Small Cap Index), Value (MSCI Emerging Markets Value Index), and Growth (MSCI
Emerging Markets Growth Index). All index returns are net of withholding tax on dividends. World Market Cap represented by Russell 3000 Index, MSCI World ex USA IMI Index, and MSCI Emerging Markets IMI Index. MSCI
Emerging Markets IMI Index used as the proxy for the emerging market portion of the market. MSCI data © MSCI 2018, all rights reserved. Frank Russell Company is the source and owner of the trademarks, service marks,
and copyrights related to the Russell Indexes.
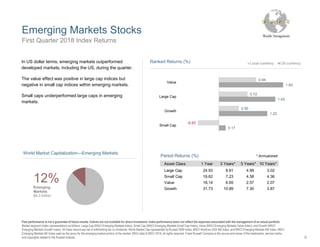
In US dollar terms, emerging markets outperformed
developed markets, including the US, during the quarter.
The value effect was positive in large cap indices but
negative in small cap indices within emerging markets.
Small caps underperformed large caps in emerging
markets.
0.94
0.72
0.50
-0.53
1.62
1.42
1.22
0.17
Value
Large Cap
Growth
Small Cap
Ranked Returns (%) Local currency US currency
Period Returns (%) * Annualized
Asset Class 1 Year 3 Years** 5 Years** 10 Years**
Large Cap 24.93 8.81 4.99 3.02
Small Cap 18.62 7.23 4.58 4.36
Value 18.14 6.65 2.57 2.07
Growth 31.73 10.89 7.30 3.87
12%Emerging
Markets
$6.3 trillion
World Market Capitalization—Emerging Markets
9
-0.04
-0.92
-1.04
-3.52
-3.71
-4.40
-5.53
-8.02
-8.36
-10.68
12.97
11.61
9.43
9.26
8.63
6.91
6.90
5.85
4.96
3.88
2.75
1.91
1.55
0.86
Egypt
Brazil
Peru
Russia
Pakistan
Malaysia
Thailand
Czech Republic
Taiwan
Colombia
Qatar
China
Mexico
Chile
South Korea
Hungary
UAE
South Africa
Turkey
Greece
Indonesia
India
Poland
Philippines
Ranked Emerging Markets Returns (%)
-0.69
-0.74
-1.14
-1.54
-2.44
-3.24
-3.25
-3.50
-3.65
-4.11
-5.87
-7.47
6.45
4.70
3.00
2.70
2.59
2.34
1.06
1.05
0.80
0.66
0.24
Finland
Italy
Singapore
Norway
Austria
Portugal
Japan
New Zealand
Netherlands
Belgium
France
Denmark
US
Spain
Hong Kong
Sweden
Ireland
Germany
UK
Israel
Switzerland
Australia
Canada
Ranked Developed Markets Returns (%)
Select Country Performance
Past performance is not a guarantee of future results. Indices are not available for direct investment. Index performance does not reflect the expenses associated with the management of an actual portfolio.
Country performance based on respective indices in the MSCI World ex US IMI Index (for developed markets), MSCI USA IMI Index (for US), and MSCI Emerging Markets IMI Index. All returns in USD and net of withholding
tax on dividends. MSCI data © MSCI 2018, all rights reserved. UAE and Qatar have been reclassified as emerging markets by MSCI, effective May 2014.
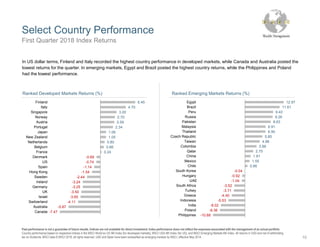
In US dollar terms, Finland and Italy recorded the highest country performance in developed markets, while Canada and Australia posted the
lowest returns for the quarter. In emerging markets, Egypt and Brazil posted the highest country returns, while the Philippines and Poland
had the lowest performance.
First Quarter 2018 Index Returns
10
-0.20
-1.45
-2.14
-4.29
-4.33
-4.38
7.19
6.85
4.63
4.48
4.22
3.50
3.00
2.06
1.89
1.77
1.45
0.85
0.44
0.42
0.12
Mexican peso (MXP)
Colombian peso (COP)
Malaysian ringgit (MYR)
South African rand (ZAR)
Thailand baht (THB)
Chinese yuan (CNY)
Czech koruna (CZK)
Taiwanese NT dollar (TWD)
Chilean peso (CLP)
Hungary forint (HUF)
Poland new zloty (PLZ)
Egyptian pound (EGP)
South Korean won (KRW)
Peru new sol (PEI)
Russian ruble (RUB)
Brazilian real (BRC)
Indonesia rupiah (IDR)
Indian rupee (INR)
Turkish new lira (TRY)
Philippine peso (PHP)
Pakistani rupee (PKR)
Ranked Emerging Markets (%)
-0.39
-1.12
-1.93
-2.24
-2.82
5.92
4.18
3.70
2.42
2.30
1.91
1.76
1.43
Japanese yen (JPY)
Norwegian krone (NOK)
British pound (GBP)
Euro (EUR)
Danish krone (DKK)
Singapore dollar (SGD)
Swiss franc (CHF)
New Zealand dollar (NZD)
Hong Kong dollar (HKD)
Israel shekel (ILS)
Australian dollar (AUD)
Swedish krona (SEK)
Canadian dollar (CAD)
Ranked Developed Markets (%)
Select Currency Performance vs. US Dollar
Past performance is not a guarantee of future results. Indices are not available for direct investment. Index performance does not reflect the expenses associated with the management of an actual portfolio.
MSCI data © MSCI 2018, all rights reserved.
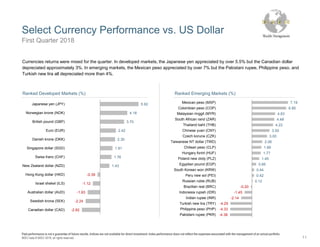
Currencies returns were mixed for the quarter. In developed markets, the Japanese yen appreciated by over 5.5% but the Canadian dollar
depreciated approximately 3%. In emerging markets, the Mexican peso appreciated by over 7% but the Pakistani rupee, Philippine peso, and
Turkish new lira all depreciated more than 4%.
First Quarter 2018
11
Real Estate Investment Trusts (REITs)
First Quarter 2018 Index Returns
Past performance is not a guarantee of future results. Indices are not available for direct investment. Index performance does not reflect the expenses associated with the management of an actual portfolio.
Number of REIT stocks and total value based on the two indices. All index returns are net of withholding tax on dividends. Total value of REIT stocks represented by Dow Jones US Select REIT Index and the S&P Global ex US
REIT Index. Dow Jones US Select REIT Index used as proxy for the US market, and S&P Global ex US REIT Index used as proxy for the World ex US market. Dow Jones data copyright 2018 S&P Dow Jones Indices LLC, a
division of S&P Global. All rights reserved. S&P data copyright 2018 S&P Dow Jones Indices LLC, a division of S&P Global. All rights reserved.
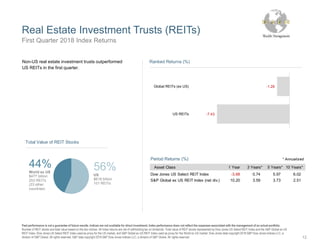
Non-US real estate investment trusts outperformed
US REITs in the first quarter.
-1.26
-7.43
Global REITs (ex US)
US REITs
Ranked Returns (%)
Period Returns (%) * Annualized
Asset Class 1 Year 3 Years** 5 Years** 10 Years**
Dow Jones US Select REIT Index -3.68 0.74 5.97 6.02
S&P Global ex US REIT Index (net div.) 10.20 3.59 3.73 2.51
56%
US
$618 billion
101 REITs
44%
World ex US
$477 billion
253 REITs
(23 other
countries)
Total Value of REIT Stocks
12
Commodities
First Quarter 2018 Index Returns
Past performance is not a guarantee of future results. Index is not available for direct investment. Index performance does not reflect the expenses associated with the management of an actual portfolio.
Commodities returns represent the return of the Bloomberg Commodity Total Return Index. Individual Commodities are sub-index values of the Bloomberg Commodity Total Return Index. Data provided by Bloomberg.
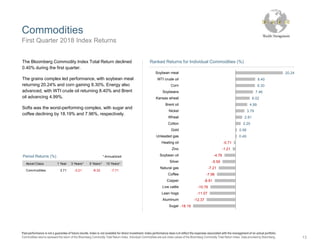
The Bloomberg Commodity Index Total Return declined
0.40% during the first quarter.
The grains complex led performance, with soybean meal
returning 20.24% and corn gaining 8.30%. Energy also
advanced, with WTI crude oil returning 8.40% and Brent
oil advancing 4.99%.
Softs was the worst-performing complex, with sugar and
coffee declining by 18.19% and 7.96%, respectively.
Period Returns (%)
Asset Class 1 Year 3 Years** 5 Years** 10 Years**
Commodities 3.71 -3.21 -8.32 -7.71
* Annualized
-0.71
-1.21
-4.76
-5.59
-7.21
-7.96
-8.91
-10.76
-11.07
-12.37
-18.19
20.24
8.40
8.30
7.46
6.02
4.99
3.79
2.81
2.20
0.56
0.49
Soybean meal
WTI crude oil
Corn
Soybeans
Kansas wheat
Brent oil
Nickel
Wheat
Cotton
Gold
Unleaded gas
Heating oil
Zinc
Soybean oil
Silver
Natural gas
Coffee
Copper
Live cattle
Lean hogs
Aluminum
Sugar
Ranked Returns for Individual Commodities (%)
13
2.74
3.23 3.32
3.88
10-Year US
Treasury
Municipals AAA-AA
Corporates
A-BBB
Corporates
Bond Yields across Issuers (%)
Fixed Income
One basis point equals 0.01%. Past performance is not a guarantee of future results. Indices are not available for direct investment. Index performance does not reflect the expenses associated with the
management of an actual portfolio. Yield curve data from Federal Reserve. State and local bonds are from the S&P National AMT-Free Municipal Bond Index. AAA-AA Corporates represent the Bank of America Merrill Lynch
US Corporates, AA-AAA rated. A-BBB Corporates represent the Bank of America Merrill Lynch US Corporates, BBB-A rated. Bloomberg Barclays data provided by Bloomberg. US long-term bonds, bills, inflation, and fixed
income factor data © Stocks, Bonds, Bills, and Inflation (SBBI) Yearbook™, Ibbotson Associates, Chicago (annually updated work by Roger G. Ibbotson and Rex A. Sinquefield). FTSE fixed income indices © 2018 FTSE Fixed
Income LLC, all rights reserved. ICE BofAML index data © 2018 ICE Data Indices, LLC.
First Quarter 2018 Index Returns
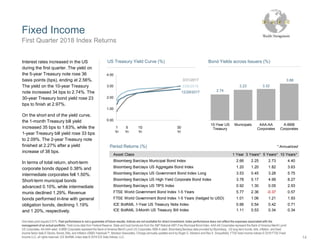
Interest rates increased in the US
during the first quarter. The yield on
the 5-year Treasury note rose 36
basis points (bps), ending at 2.56%.
The yield on the 10-year Treasury
note increased 34 bps to 2.74%. The
30-year Treasury bond yield rose 23
bps to finish at 2.97%.
On the short end of the yield curve,
the 1-month Treasury bill yield
increased 35 bps to 1.63%, while the
1-year Treasury bill yield rose 33 bps
to 2.09%. The 2-year Treasury note
finished at 2.27% after a yield
increase of 38 bps.
In terms of total return, short-term
corporate bonds dipped 0.38% and
intermediate corporates fell 1.50%.
Short-term municipal bonds
advanced 0.10%, while intermediate
munis declined 1.29%. Revenue
bonds performed in-line with general
obligation bonds, declining 1.19%
and 1.20%, respectively.
Period Returns (%)
Asset Class 1 Year 3 Years** 5 Years** 10 Years**
Bloomberg Barclays Municipal Bond Index 2.66 2.25 2.73 4.40
Bloomberg Barclays US Aggregate Bond Index 1.20 1.20 1.82 3.63
Bloomberg Barclays US Government Bond Index Long 3.53 0.45 3.28 5.75
Bloomberg Barclays US High Yield Corporate Bond Index 3.78 5.17 4.99 8.27
Bloomberg Barclays US TIPS Index 0.92 1.30 0.05 2.93
FTSE World Government Bond Index 1-5 Years 5.77 2.36 -0.37 0.57
FTSE World Government Bond Index 1-5 Years (hedged to USD) 1.01 1.06 1.21 1.93
ICE BofAML 1-Year US Treasury Note Index 0.66 0.54 0.42 0.71
ICE BofAML 3-Month US Treasury Bill Index 1.11 0.53 0.34 0.34
* Annualized
3/31/2017
12/29/2017
3/29/2018
0.00
1.00
2.00
3.00
4.00
US Treasury Yield Curve (%)
1
Yr
5
Yr
10
Yr
30
Yr
14
$0
$20,000
$40,000
$60,000
$80,000
$100,000
$120,000
12/1988 12/1993 12/1998 12/2003 12/2008 12/2013
Growth of Wealth: The Relationship between Risk and Return
Stock/Bond Mix
Impact of Diversification
First Quarter 2018 Index Returns
1. STDEV (standard deviation) is a measure of the variation or dispersion of a set of data points. Standard deviations are often used to quantify the historical return volatility of a security or portfolio.
Diversification does not eliminate the risk of market loss. Past performance is not a guarantee of future results. Indices are not available for direct investment. Index performance does not reflect expenses associated
with the management of an actual portfolio. Asset allocations and the hypothetical index portfolio returns are for illustrative purposes only and do not represent actual performance. Global Stocks represented by MSCI All
Country World Index (gross div.) and Treasury Bills represented by US One-Month Treasury Bills. Globally diversified allocations rebalanced monthly, no withdrawals. Data © MSCI 2018, all rights reserved. Treasury bills ©
Stocks, Bonds, Bills, and Inflation Yearbook™, Ibbotson Associates, Chicago (annually updated work by Roger G. Ibbotson and Rex A. Sinquefield).
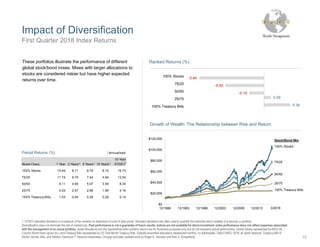
These portfolios illustrate the performance of different
global stock/bond mixes. Mixes with larger allocations to
stocks are considered riskier but have higher expected
returns over time.
-0.19
-0.50
-0.84
0.34
0.09
100% Treasury Bills
25/75
50/50
75/25
100% Stocks
Ranked Returns (%)
Asset Class 1 Year 3 Years** 5 Years**10 Years**
10-Year
STDEV1
100% Stocks 15.44 8.71 9.79 6.15 16.72
75/25 11.74 6.70 7.44 4.94 12.54
50/50 8.11 4.65 5.07 3.55 8.35
25/75 4.54 2.57 2.68 1.99 4.16
100% Treasury Bills 1.03 0.45 0.28 0.28 0.14
Period Returns (%) * Annualized
100% Stocks
75/25
50/50
25/75
100% Treasury Bills
15
3/2018
Sailing with the Tides
16
Adapted from “Sailing with the Tides,” Outside the Flags by Jim Parker, March 2018. Past performance is no guarantee of future results. There is no guarantee an investing strategy will be successful. Diversification does not eliminate the
risk of market loss. All expressions of opinion are subject to change. This article is distributed for informational purposes, and it is not to be construed as an offer, solicitation, recommendation, or endorsement of any particular security,
products, or services. Dimensional Fund Advisors LP is an investment advisor registered with the Securities and Exchange Commission.
Embarking on a financial plan is like sailing around the world.
The voyage won’t always go to plan, and there’ll be rough seas.
But the odds of reaching your destination increase greatly
if you are prepared, flexible, patient, and well-advised.
A mistake many inexperienced sailors make is not having a plan at all.
They embark without a clear sense of their destination. And once they do
decide, they often find themselves lost at sea in the wrong boat with
inadequate provisions.
Likewise, in planning an investment journey, you need to decide on your goal.
A first step might be to consider whether the goal is realistic and achievable.
For instance, while you may long to retire in the south of France, you may not
be prepared to sacrifice your needs today to satisfy that distant desire.
Once you are set on a realistic destination, you need to ensure you have the
right portfolio to get you there. Have you planned for multiple contingencies?
What degree of “bad weather” can your plan withstand along the way?
Key to a successful voyage is a good navigator. A trusted advisor is like that,
regularly taking coordinates and making adjustments, if necessary. If your
circumstances change, the advisor may suggest you replot your course.
As with the weather at sea, markets can be unpredictable. A sudden squall
can whip up waves of volatility, tides can shift, and strong currents can
threaten to blow you off course. Like a seasoned sailor, an experienced
advisor will work with the conditions.
Once the storm passes, you can pick up speed again. Just as a sturdy
vessel will help you withstand most conditions at sea, a well-diversified
portfolio can act as a bulwark against the sometimes tempestuous conditions
in markets.
Circumnavigating the globe is not exciting every day. Patience is required with
local customs and paperwork as you pull into different ports. Likewise, a lack
of attention to costs and taxes is the enemy of many a long-term financial plan.
Distractions can also send investors, like sailors, off course. In the face of “hot”
investment trends, it takes discipline not to veer from your chosen plan. Like
the sirens of Greek mythology, media pundits can also be diverting, tempting
you to change tack and act on news that is already priced in to markets.
A lack of flexibility is another impediment to a successful investment journey.
If it doesn’t look as though you’ll make your destination in time, you may have
to extend your voyage, take a different route to get there, or even moderate
your goal.
The important point is that you become comfortable with the idea that
uncertainty is inherent to the investment journey, just as it is with any sea
voyage. That is why preparation and planning are so critical. While you can’t
control every outcome, you can be prepared for the range of possibilities and
understand that you have clear choices if things don’t go according to plan.
If you can’t live with the volatility, you can change your plan. If the goal looks
unachievable, you can lower your sights. If it doesn’t look as if you’ll arrive on
time, you can extend your journey.
Of course, not everyone’s journey is the same. Neither is everyone’s
destination. We take different routes to different places, and we meet a range
of challenges and opportunities along the way.
But for all of us, it’s critical that we are prepared for our journeys in the right
vessel, keep our destinations in mind, stick with the plans, and have a trusted
navigator to chart our courses and keep us on target.
First Quarter 2018