The Future of Wind Power in the Gulf of Mexico
•
1 like•44 views

The energy vision for the U.S. calls for dramatic increases in the use of wind power by the year 2050. The use of offshore wind farms will play a vital role in achieving this goal. Even though there are some challenges with implementing wind power in the Gulf of Mexico, the advantages and benefits should allow the U.S. to overcome these challenges.

Recommended
Recommended
More Related Content
What's hot
What's hot (17)
Similar to The Future of Wind Power in the Gulf of Mexico
Similar to The Future of Wind Power in the Gulf of Mexico (20)
More from International Journal of Modern Research in Engineering and Technology
More from International Journal of Modern Research in Engineering and Technology (20)
Recently uploaded
Recently uploaded (20)
The Future of Wind Power in the Gulf of Mexico
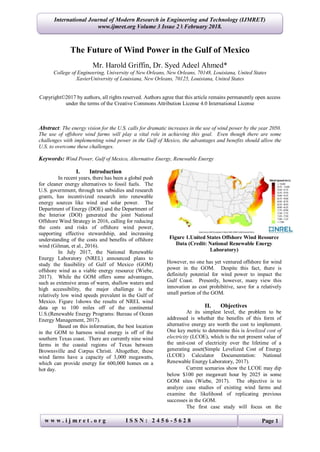
- 1. International Journal of Modern Research in Engineering and Technology (IJMRET) www.ijmret.org Volume 3 Issue 2 ǁ February 2018. w w w . i j m r e t . o r g I S S N : 2 4 5 6 - 5 6 2 8 Page 1 The Future of Wind Power in the Gulf of Mexico Mr. Harold Griffin, Dr. Syed Adeel Ahmed* College of Engineering, University of New Orleans, New Orleans, 70148, Louisiana, United States XavierUniversity of Louisiana, New Orleans, 70125, Louisiana, United States Copyright©2017 by authors, all rights reserved. Authors agree that this article remains permanently open access under the terms of the Creative Commons Attribution License 4.0 International License Abstract: The energy vision for the U.S. calls for dramatic increases in the use of wind power by the year 2050. The use of offshore wind farms will play a vital role in achieving this goal. Even though there are some challenges with implementing wind power in the Gulf of Mexico, the advantages and benefits should allow the U.S. to overcome these challenges. Keywords: Wind Power, Gulf of Mexico, Alternative Energy, Renewable Energy I. Introduction In recent years, there has been a global push for cleaner energy alternatives to fossil fuels. The U.S. government, through tax subsidies and research grants, has incentivized research into renewable energy sources like wind and solar power. The Department of Energy (DOE) and the Department of the Interior (DOI) generated the joint National Offshore Wind Strategy in 2016, calling for reducing the costs and risks of offshore wind power, supporting effective stewardship, and increasing understanding of the costs and benefits of offshore wind (Gilman, et al., 2016). In July 2017, the National Renewable Energy Laboratory (NREL) announced plans to study the feasibility of Gulf of Mexico (GOM) offshore wind as a viable energy resource (Wiebe, 2017). While the GOM offers some advantages, such as extensive areas of warm, shallow waters and high accessibility, the major challenge is the relatively low wind speeds prevalent in the Gulf of Mexico. Figure 1shows the results of NREL wind data up to 100 miles off of the continental U.S.(Renewable Energy Programs: Bureau of Ocean Energy Management, 2017). Based on this information, the best location in the GOM to harness wind energy is off of the southern Texas coast. There are currently nine wind farms in the coastal regions of Texas between Brownsville and Corpus Christi. Altogether, these wind farms have a capacity of 3,000 megawatts, which can provide energy for 600,000 homes on a hot day. Figure 1.United States Offshore Wind Resource Data (Credit: National Renewable Energy Laboratory) However, no one has yet ventured offshore for wind power in the GOM. Despite this fact, there is definitely potential for wind power to impact the Gulf Coast. Presently, however, many view this innovation as cost prohibitive, save for a relatively small portion of the GOM. II. Objectives At its simplest level, the problem to be addressed is whether the benefits of this form of alternative energy are worth the cost to implement. One key metric to determine this is levelized cost of electricity (LCOE), which is the net present value of the unit-cost of electricity over the lifetime of a generating asset(Simple Levelized Cost of Energy (LCOE) Calculator Documentation: National Renewable Energy Laboratory, 2017). Current scenarios show the LCOE may dip below $100 per megawatt hour by 2025 in some GOM sites (Wiebe, 2017). The objective is to analyze case studies of existing wind farms and examine the likelihood of replicating previous successes in the GOM. The first case study will focus on the
- 2. International Journal of Modern Research in Engineering and Technology (IJMRET) www.ijmret.org Volume 3 Issue 2 ǁ February 2018. w w w . i j m r e t . o r g I S S N : 2 4 5 6 - 5 6 2 8 Page 48 European offshore wind industry, including the methods and technology that has contributed to its success. The other case study investigates the currently operating offshore wind farm in the U.S. By looking at previous successes and current operations, a comparison and analysis may reveal how viable wind power can be for the Gulf Coast. III. Wind Power Basics Wind turbines convert the kinetic energy in wind into mechanical power (Wind Energy Guide: Wind Energy Development Programmatic EIS, 2017). Inside the hub (nacelle) of a wind turbine, a generator creates the mechanical power through rotation caused by the wind. This electrical power can be classified as utility (large-scale) or distributed (small scale) power, depending on the rating of the turbine. Utility-scale wind turbines are typically part of a “wind farm,” an interconnected group which functions as a single power plant that puts electricity into the grid (Wind Power 101: American Wind Energy Association, 2017). Offshore wind farms are mostly utility-scale systems, with more sophisticated components than land-based systems. 3.1. Met Tower A meteorological mast, or met tower is necessary to collect wind data at multiple heights for testing, evaluation, and estimating operation maintenance management. 3.2. Support Structure The support system refers mainly to the foundation, but also includes the transition piece and scour protection1 in an offshore wind turbine. This is one of the major distinctions between an offshore system and a land-based wind turbine. Instead of considering only maximum wind speed, offshore wind turbines must be designed to withstand wave heights, currents, and water depth. In addition, offshore wind turbines in the GOM will need to be able to withstand hurricane force maximum winds. Currently, there are four types of foundations in use: monopile, jacket, tripod and gravity systems. The cheapest option is the monopile, but it is depth limited (approximately 75 feet maximum). At approximately 150 feet, jackets are required. StatoilHydro is currently developing a floating structure (Hywind) for use in deeper waters, which may help reduce costs in certain areas (Kaiser & Snyder, 2012). 1 Scour refers to the removal of sediment around the base of the structure. 3.3.Electricity Collection and Transmission The turbines in a wind farm are connected by inter-array cables, and possibly to an offshore substation. From there, transmission to shore is through export cables, where power is metered and typically purchased with a local utility. All offshore wind farms require substations, but not all substations are located offshore. Substations increase the voltage of the generated electricity in order to minimize transmission losses. The size of the substation depends on the appropriate power rating of the wind farm (Kaiser & Snyder, 2012). IV. Offshore Wind Power in Europe In 1991, DONG Energy built the first offshore wind farm off the coast of Denmark as a demonstration project. Known as the Vindeby Offshore Wind Farm, it has since been dismantled and recycled(Frangoul, 2017).This innovation has since propelled the European offshore wind power industry to the point that as of December 2016, there were 3,589 grid-connected wind turbines with a capacity of 12,631 megawatts. There are currently 11 offshore projects under construction that will increase capacity by 4.8 gigawatts (Ho & Mbistrova, 2017). Despite the successes of the European offshore wind industry, the LCOE of offshore wind farms continues to be elevated. A group from the Copernicus Institute of Sustainable Development at Utrecht University studied 46 operational wind farms commissioned after 2000. Their study revealed that the development of average LCOE increased from 120 Euro/megawatt-hour in 2000 to 190 Euro/megawatt-hour in 2014. The Utrecht study discovered that the greatest component in keeping the LCOE elevated was capital expenditures (CAPEX). Their results showed that the increase in CAPEX was directly linked to the distance to shore, water depth, and commodity prices. Other factors that may have contributed to the rise in LCOE were the limited competition in the turbine market and national policy frameworks of the various European countries. V. Offshore Wind Power in the U.S. The U.S. saw its first offshore wind farm spring to life off the coast of Rhode Island in December 2016 with the commissioning of the Block Island Wind Farm. It currently provides 90 percent of the island’s electricity needs, and is capable of powering 17,000 homes (Schlossberg, 2016). More projects are in the planning stages, mostly in the Northeast and Mid-Atlantic regions.
- 3. International Journal of Modern Research in Engineering and Technology (IJMRET) www.ijmret.org Volume 3 Issue 2 ǁ February 2018. w w w . i j m r e t . o r g I S S N : 2 4 5 6 - 5 6 2 8 Page 49 However, the first offshore lease in the GOM, approximately seven miles south of Galveston, TX, has finally been granted after more than 10 years of planning. Galveston-Offshore Wind, a division of Wind Energy System Technology, will construct two met towers that will gather pertinent data for the 11,355-acre lease. Once completed, they expect the offshore wind farm to produce enough electricity to power 40,000 homes (Galveston Offshore Wind: Wind Energy Partners, 2017). Overall, wind power in the U.S. is continuing to grow rapidly. For calendar year 2016, wind power supplied226.5 terawatt-hours, or 5.55% of all power generated in the U.S.(Electric Power Monthly, 2015). The U.S. DOE envisions that wind power can potentially provide up to 35% of electrical power generation in the U.S. by the year 2050(Zayas, 2017). One scenario forecasts that offshore wind power may provide as much as 86 gigawatts of electricity, which would provide 14% of the total electricity for the Great Lakes and coastal areas. VI. Challenges So why has it taken so long for offshore wind power to take root in the U.S.? Based on accessibility and cost, companies will likely choose to invest in land-based wind farms for the time being. When compared to land-based wind farms, offshore wind farms face two major challenges, both of which will increase the LCOE for offshore wind power: the environment and transmission. In order to maximize the efficiency of a wind turbine, the center of rotation will be positioned at a certain elevation above the ground, based on data obtained from met towers. For an offshore wind turbine, this height must be increased to account for not only the depth of the water, but also the softer soil. Also, the foundation of an offshore wind turbine is susceptible to scour, which is the erosion of the soil near the base of the foundation. For this reason, the foundations of offshore wind turbines must contain some means of scour prevention. For an offshore wind turbine, the diameter of the monopile must undergo additional analyses to account for wave and current loading, likely resulting in a greater diameter than a comparable land-based wind turbine. All wind turbines are designed for a maximum wind speed, called the survival speed, above which they will be damaged. The survival speed of commercial wind turbines is in the range of 89 MPH to 161 MPH (Weston, 2017).Offshore wind turbines in the GOM would be susceptible to hurricane-force winds, and would likely require careful scrutiny to prevent damage. As shown by the Utrecht study, the distance from shore has a direct effect on CAPEX; the greater the distance, the more it will cost. Once the power gets to shore, it must then be transmitted to an appropriate point where it can be connected to the grid. Direct current (DC) incurs much lower transmission losses than alternating current (AC), so offshore wind power is typically transmitted to shore via high voltage direct current (HVDC) cables. Unfortunately, HVDC terminals have higher capital costs than AC substations due to the need for power conversion equipment (Baring-Gould, 2014). VII. Benefits Despite the challenges inherent to large- scale implementation of offshore wind power, the GOM is not without its advantages. The GOM has a far-reaching continental shelf, in some areas extending 80 miles while having water depths less than 150 feet (Schellstede, 2007). This feature can potentially allow for a uniform design for an entire array, keeping design and fabrication costs to a minimum. Also, due to the remote locations of the offshore wind turbines, noise abatement will not be a concern. Another opportunity exists in the area of infrastructure. An offshore wind farm needs a substation, which is usually placed on an electric service platform (ESP). There are nearly 2,000 active platforms (Enforcement, 2017)in the GOM in water depths under 200 meters. This number is forecast to decrease as more offshore oil and gas operators move further into deepwater for oil and gas exploration and production. When operators are no longer producing from a platform, the current regulations require the decommissioning of the platform, 2 which is extremely costly. Instead of removing these platforms, they may be acceptable to be used for ESP installation, or even for placement of wind turbines, provided they are of sufficient size. If existing oil and gas producers choose to add offshore wind power to their portfolios, they may be able to drastically reduce decommissioning costs while simultaneously reducing installation costs for implementing wind power. VIII. Conclusions As the demand for electricity grows in the U.S., the diminishing reserves of fossil fuels and the rising costs for mineral extraction dictate the need for alternative, renewable energy sources. Wind power, being an infinite resource, will likely 2 BOEM’s “Rigs to Reefs” program is an option for some operators, but it is usually a costly process.
- 4. International Journal of Modern Research in Engineering and Technology (IJMRET) www.ijmret.org Volume 3 Issue 2 ǁ February 2018. w w w . i j m r e t . o r g I S S N : 2 4 5 6 - 5 6 2 8 Page 50 represent a significant portion of the future energy portfolio. One favorable aspect is that the LCOE may drop below $100/megawatt-hour in the GOM within the next 10 years (Gilman, et al., 2016). With advances in technology, increased competition, and private-public collaboration, the GOM should figure to be a major component in the offshore wind power sector in the coming years. References [1.] Baring-Gould, I. (2014, July 29-30). NREL Offshore Wind Plant Electrical Systems: Bureau of Ocean Energy Management. Retrieved from Bureau of Ocean Energy Management: https://www.boem.gov/NREL-Offshore- Wind-Plant-Electrical-Systems/ [2.] (2015). Electric Power Monthly. Washington, DC: U.S. Department of Energy. [3.] Enforcement, B. o. (2017, December 1). Offshore Statistics by Water Depth. Washington, DC, U.S./Gulf of Mexico Region. [4.] Frangoul, A. (2017, September 8). Special Report: CNBC. Retrieved from CNBC: https://www.cnbc.com/2017/09/08/the- worlds-first-ever-offshore-wind-farm-has- been-dismantled-and-its-parts- recycled.html [5.] Galveston Offshore Wind: Wind Energy Partners. (2017, December 1). Retrieved from Wind Energy Partners: http://www.windenergypartners.biz/gow.ht ml# [6.] Gilman, P., Maurer, B., Feinberg, L., Duerr, A., Peterson, L., Musial, W., . . . Moore, A. (2016). National Offshore Wind Strategy. Washington, DC: Department of Energy, Department of Interior. [7.] Ho, A., & Mbistrova, A. (2017, Janaury). About Wind - Statistics: Wind Europe. Brussels: Wind Europe. Retrieved from Wind Europe: https://windeurope.org/wp- content/uploads/files/about- wind/statistics/WindEurope-Annual- Offshore-Statistics-2016.pdf [8.] Kaiser, M., & Snyder, B. (2012). Offshore Wind Energy Cost Modeling: Installation and Decommissioning. London: Springer- Verlag London. [9.] Renewable Energy Programs: Bureau of Ocean Energy Management. (2017, December 1). Retrieved from Bureau of Ocean Energy Management: https://www.boem.gov/Offshore-Wind- Energy/ [10.] Schellstede, H. (2007). Wind Power: Wind Farms of the Northern Gulf of Mexico. Offshore Technology Conference. Houston: Offshore Technology Conference. [11.] Schlossberg, T. (2016, December 14). Science: The New York Times. Retrieved from The New York Times: https://www.nytimes.com/2016/12/14/scien ce/wind-power-block-island.html [12.] Simple Levelized Cost of Energy (LCOE) Calculator Documentation: National Renewable Energy Laboratory. (2017, December 1). Retrieved from National Renewable Energy Laboratory: https://www.nrel.gov/analysis/tech-lcoe- documentation.html [13.] Weston, D. (2017). Vestas scales up to 4.2 MW. Windpower Monthly. [14.] Wiebe, J. (2017, July 11). About: National Renewable Energy Laboratory. Retrieved from National Renewable Energy Laboratory: https://www.nrel.gov/news/program/2017/g ulf-coast-renewable-energy-survey-to- explore-potential-of-offshore-wind.html [15.] Wind Energy Guide: Wind Energy Development Programmatic EIS. (2017, December 1). Retrieved from Wind Energy Development Programmatic EIS: http://windeis.anl.gov/guide/index.cfm [16.] Wind Power 101: American Wind Energy Association. (2017, December 1). Retrieved from American Wind Energy Association: https://www.awea.org/wind-power-101 [17.] Zayas, J. (2017). Milestones on the Road to the Wind Vision. Washington, DC: U.S. Dept of Energy.