Download to read offline
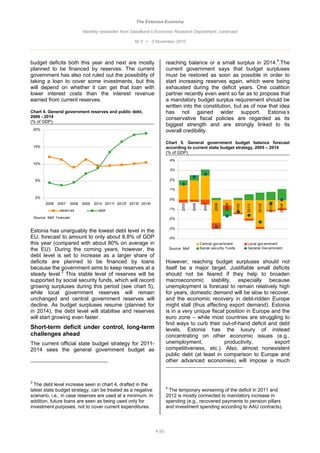

Estonia's economy has shown resilience following its recent crisis, maintaining a strong fiscal position and meeting Maastricht criteria for euro adoption due to rapid recovery and effective government measures. The 2010 budget reflects better-than-expected revenue growth, allowing for a controlled deficit of 1.3% of GDP, and anticipates further increases in revenues, despite some challenges in the labor market. The government's conservative fiscal policies and previous budget surpluses have supported stability, with debt levels remaining low in comparison to other EU countries.


