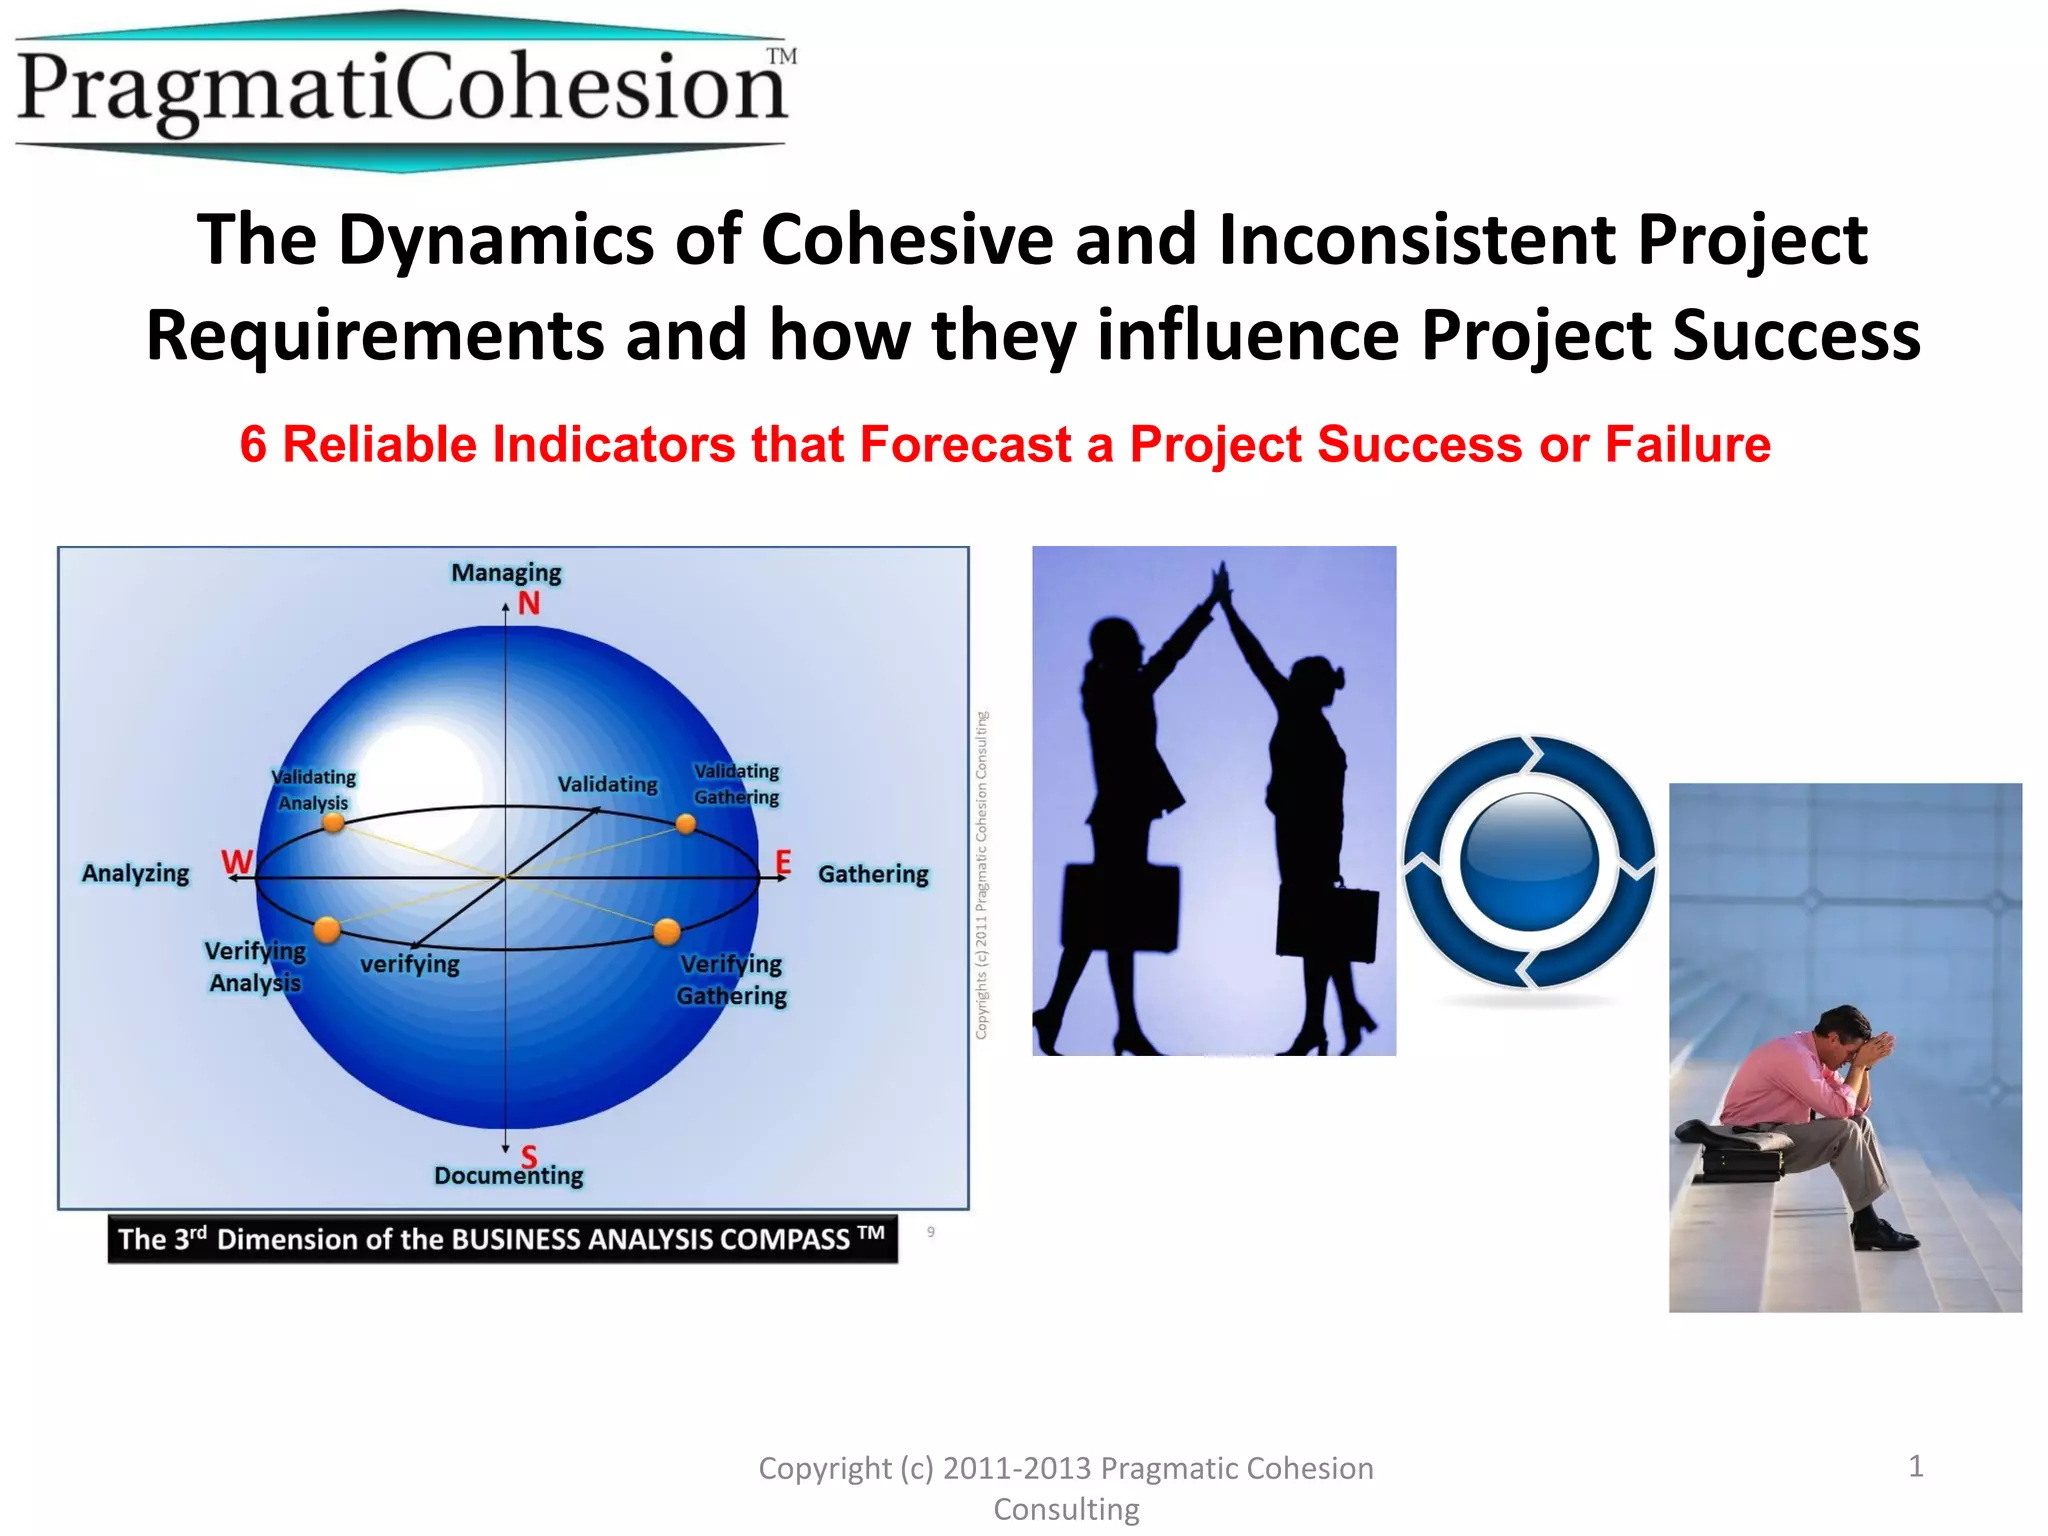
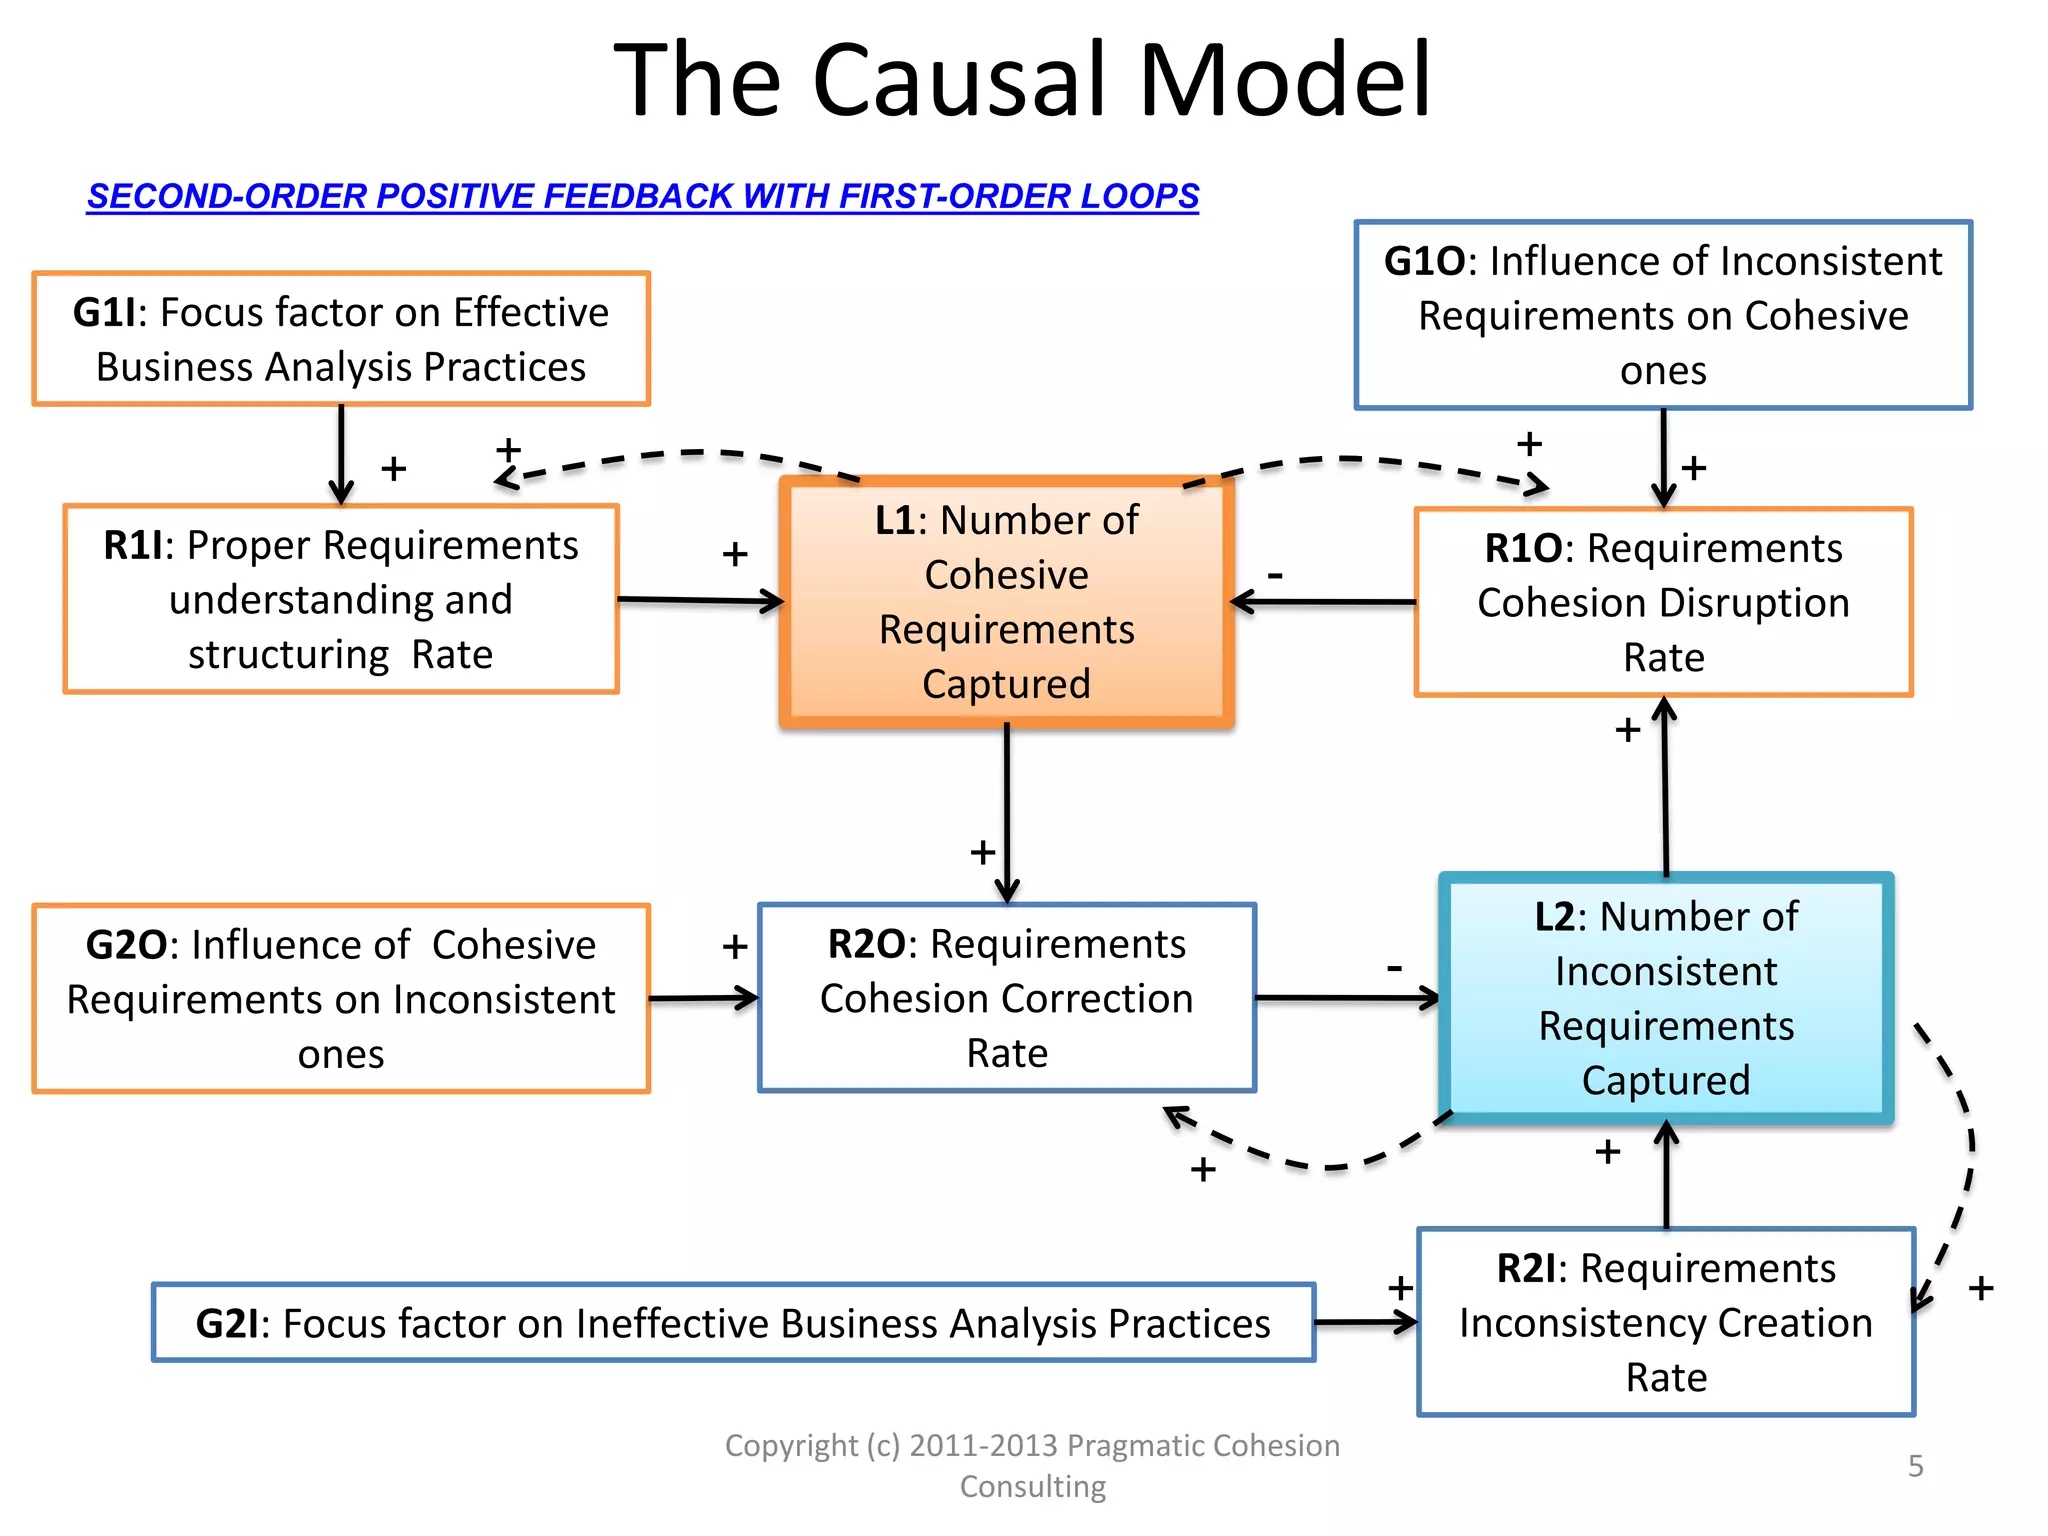
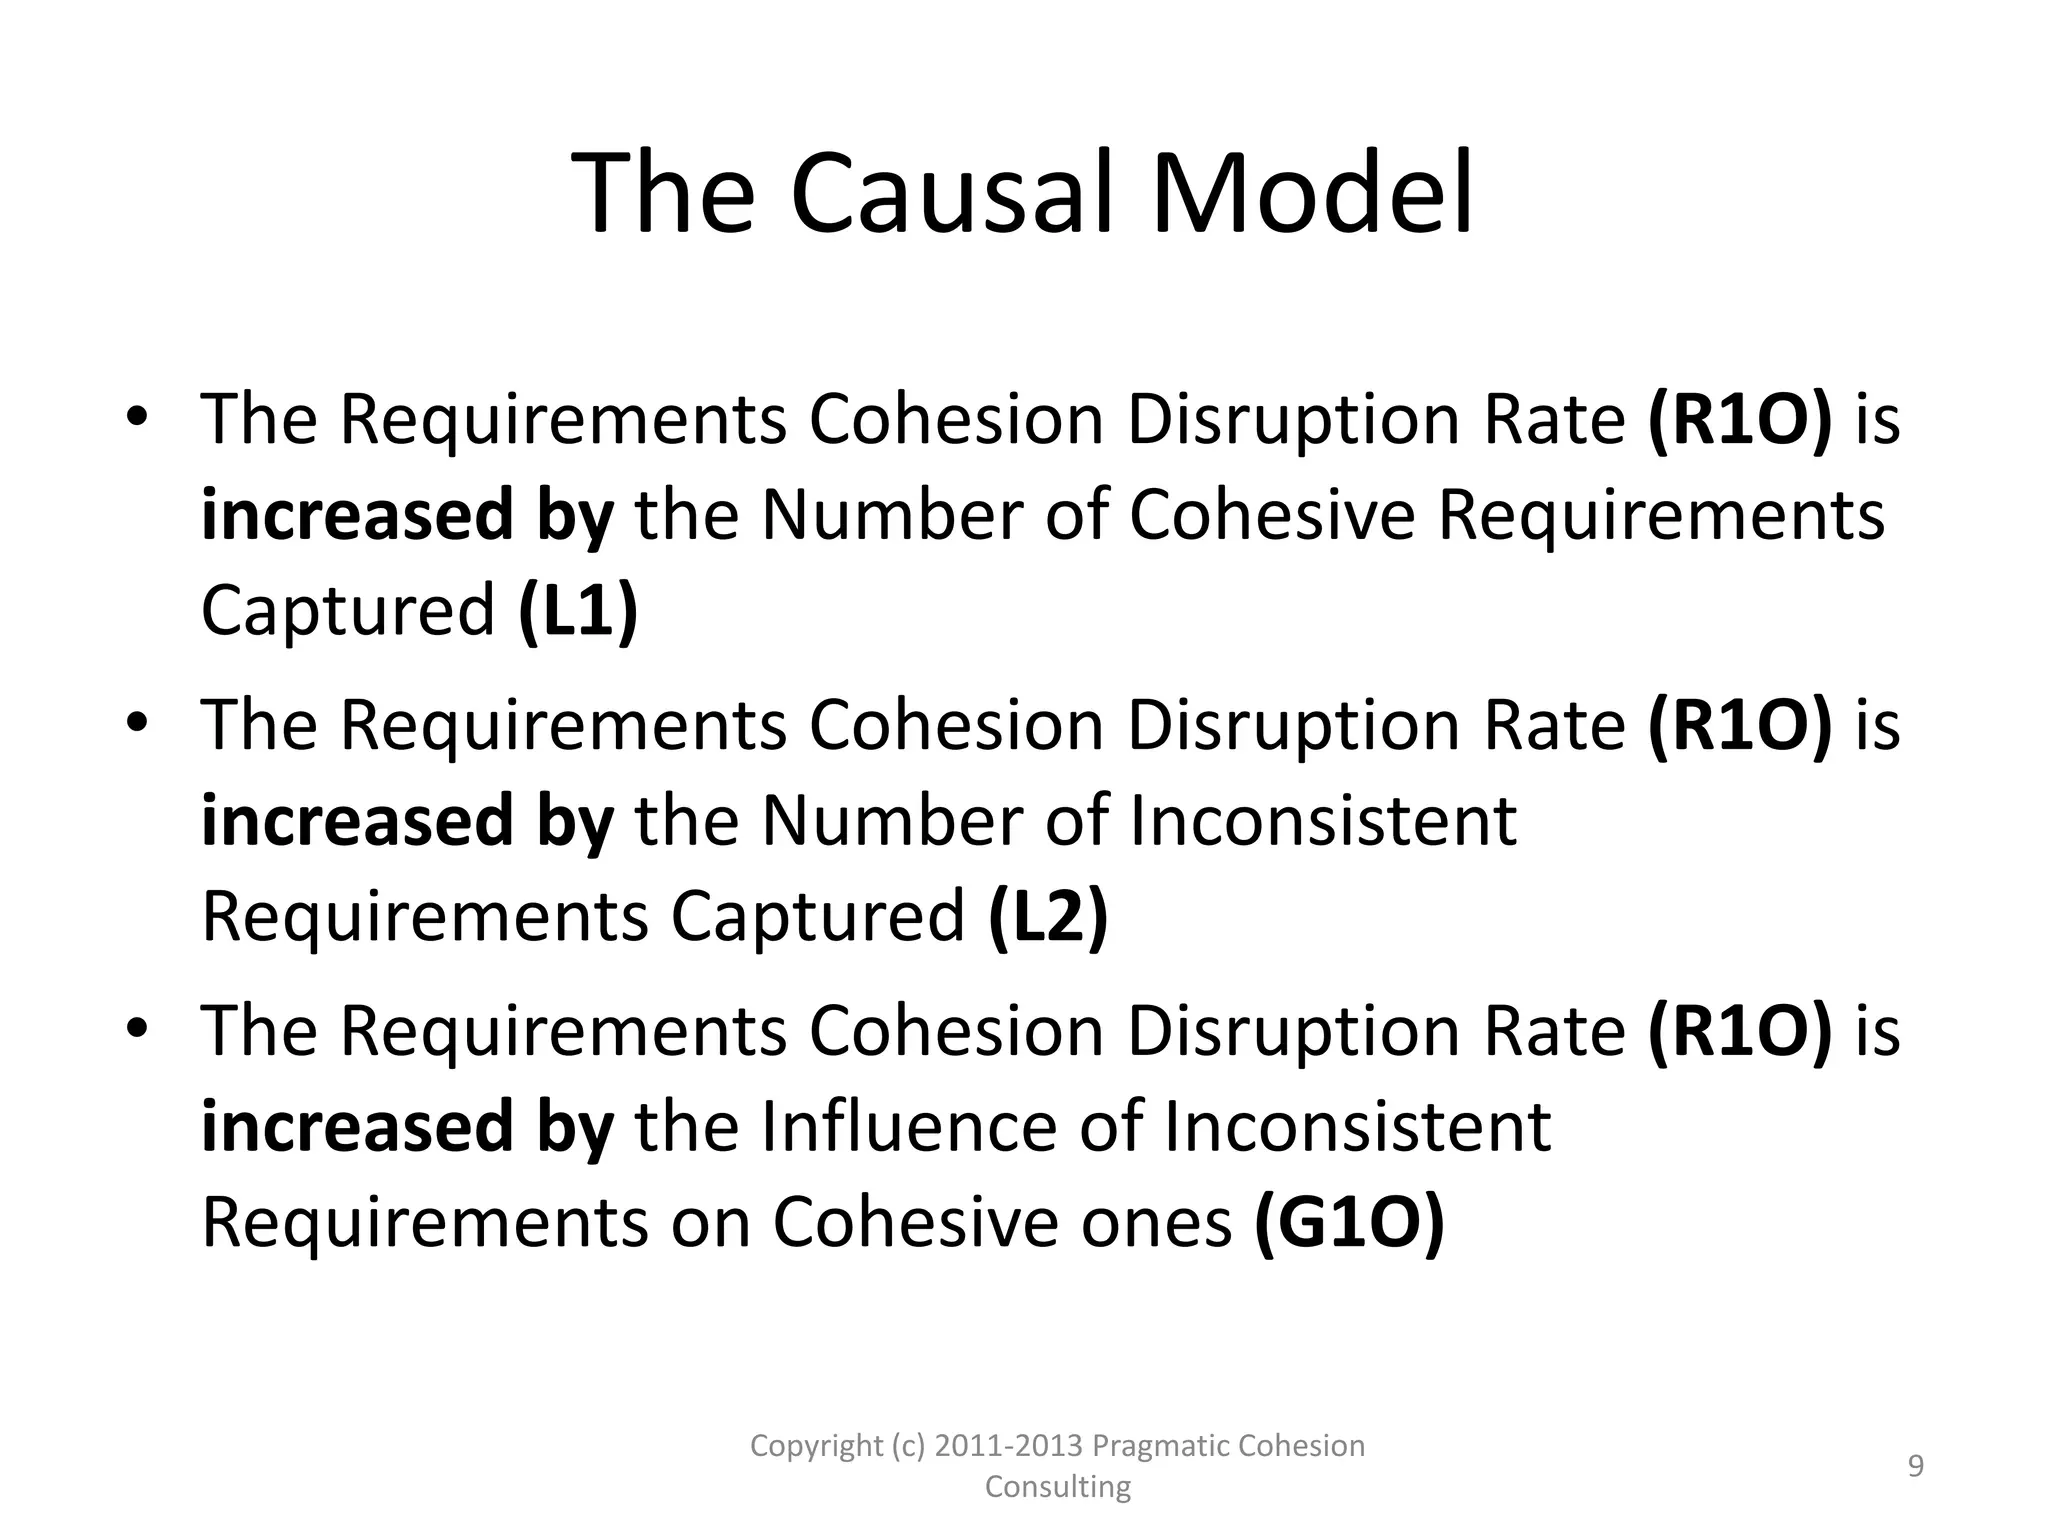
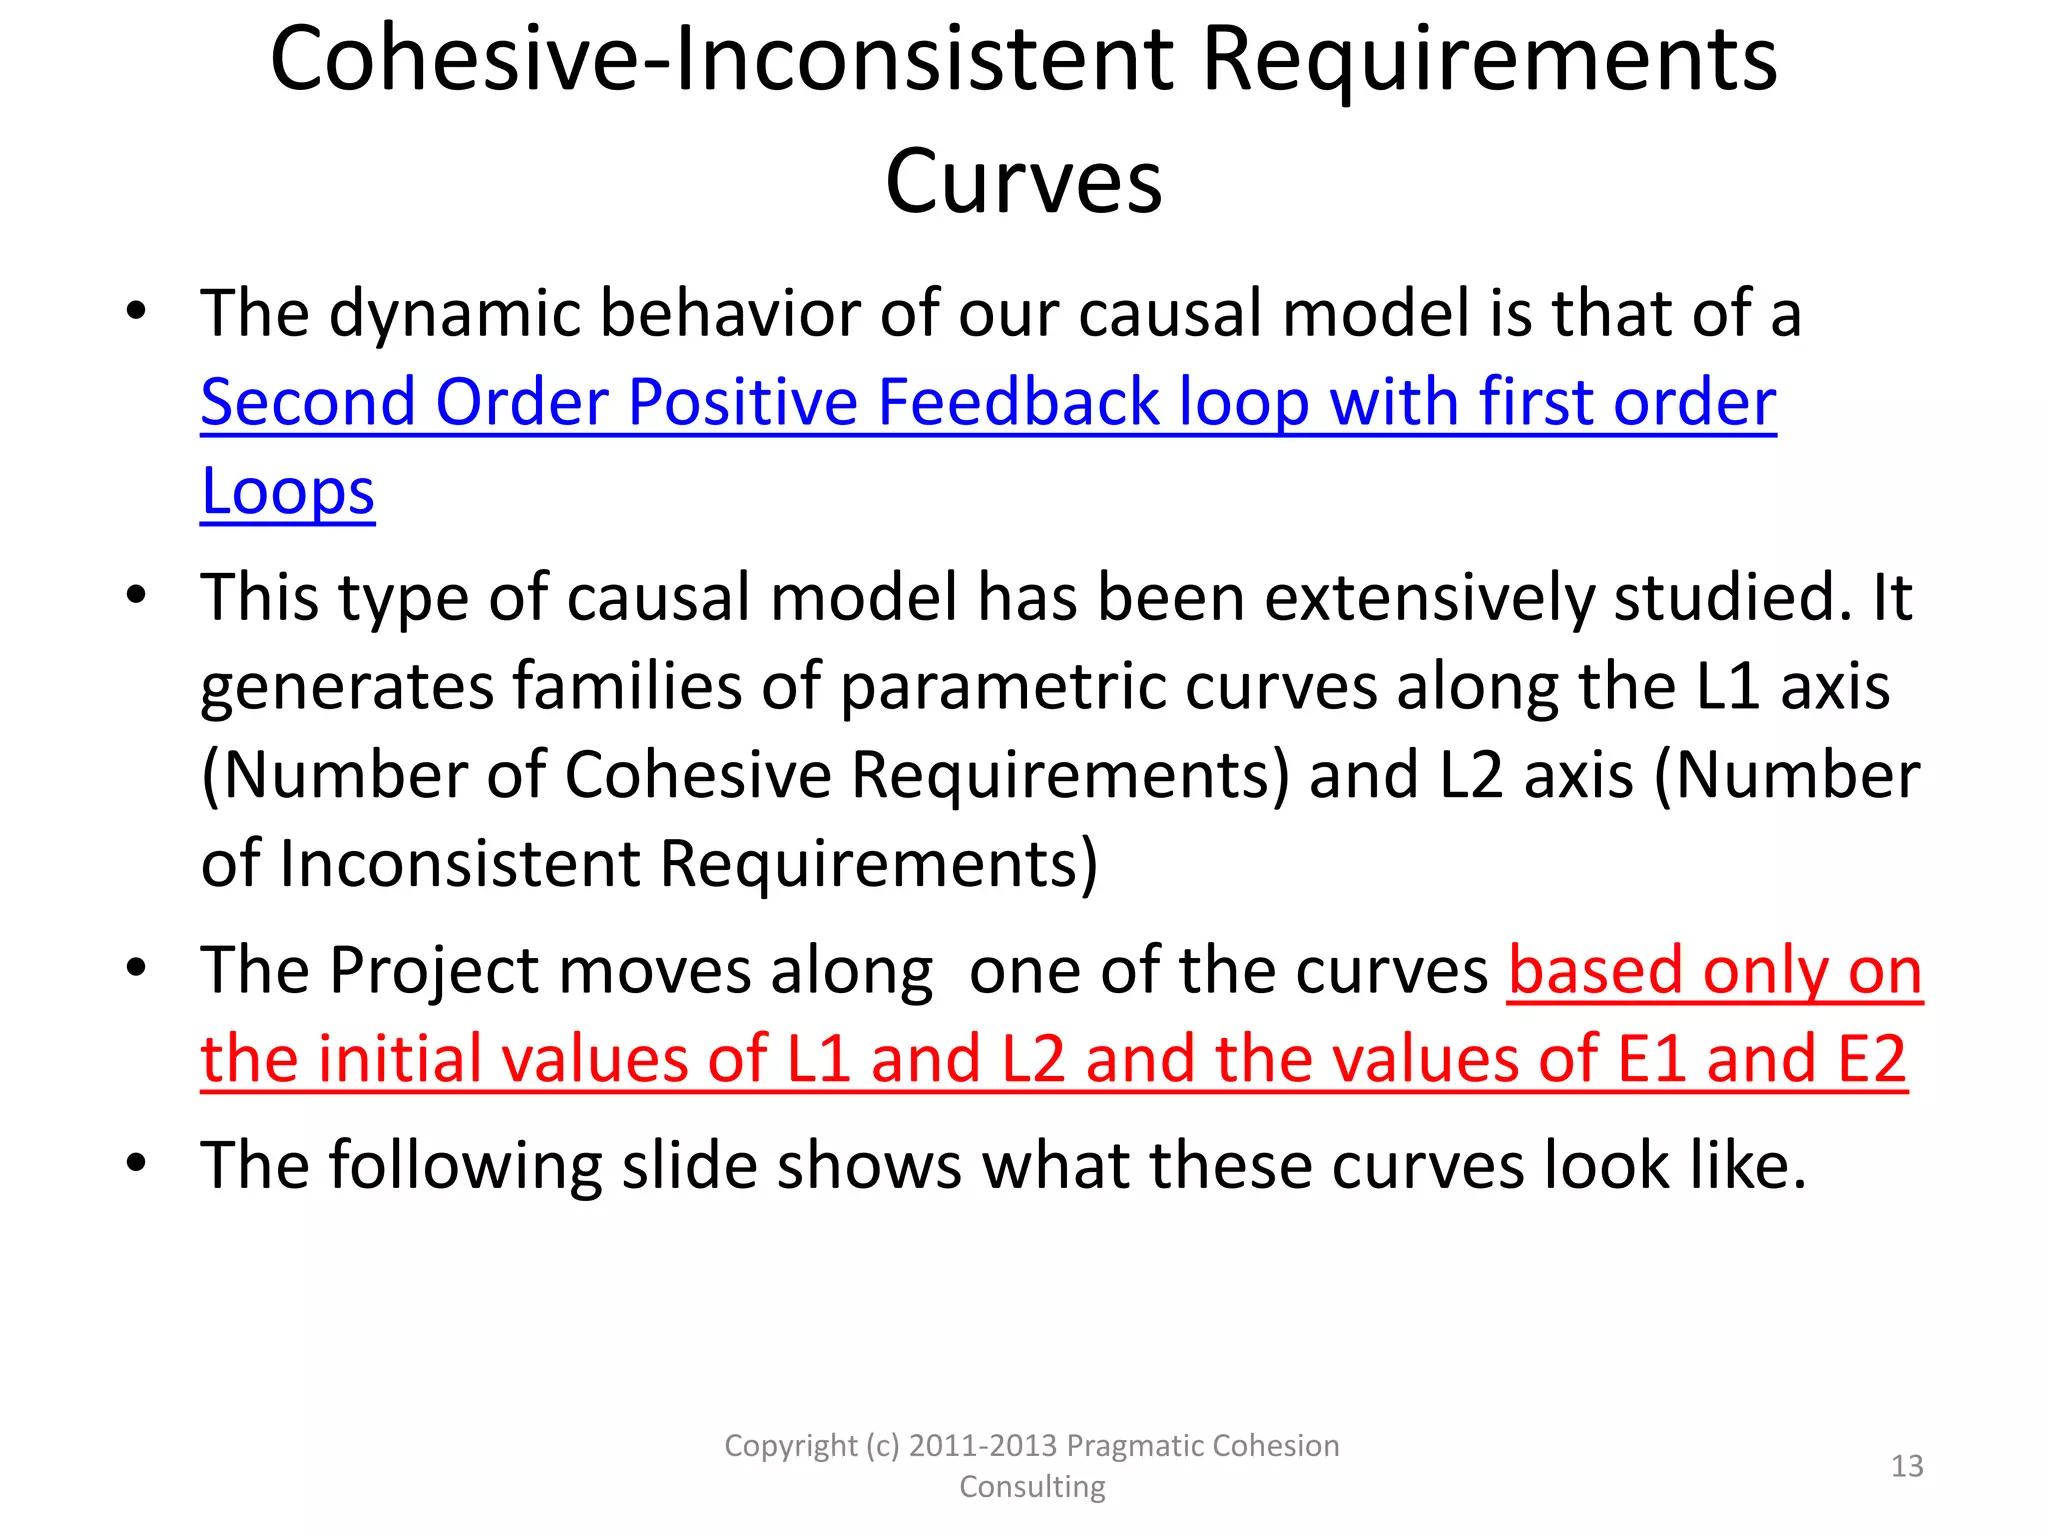
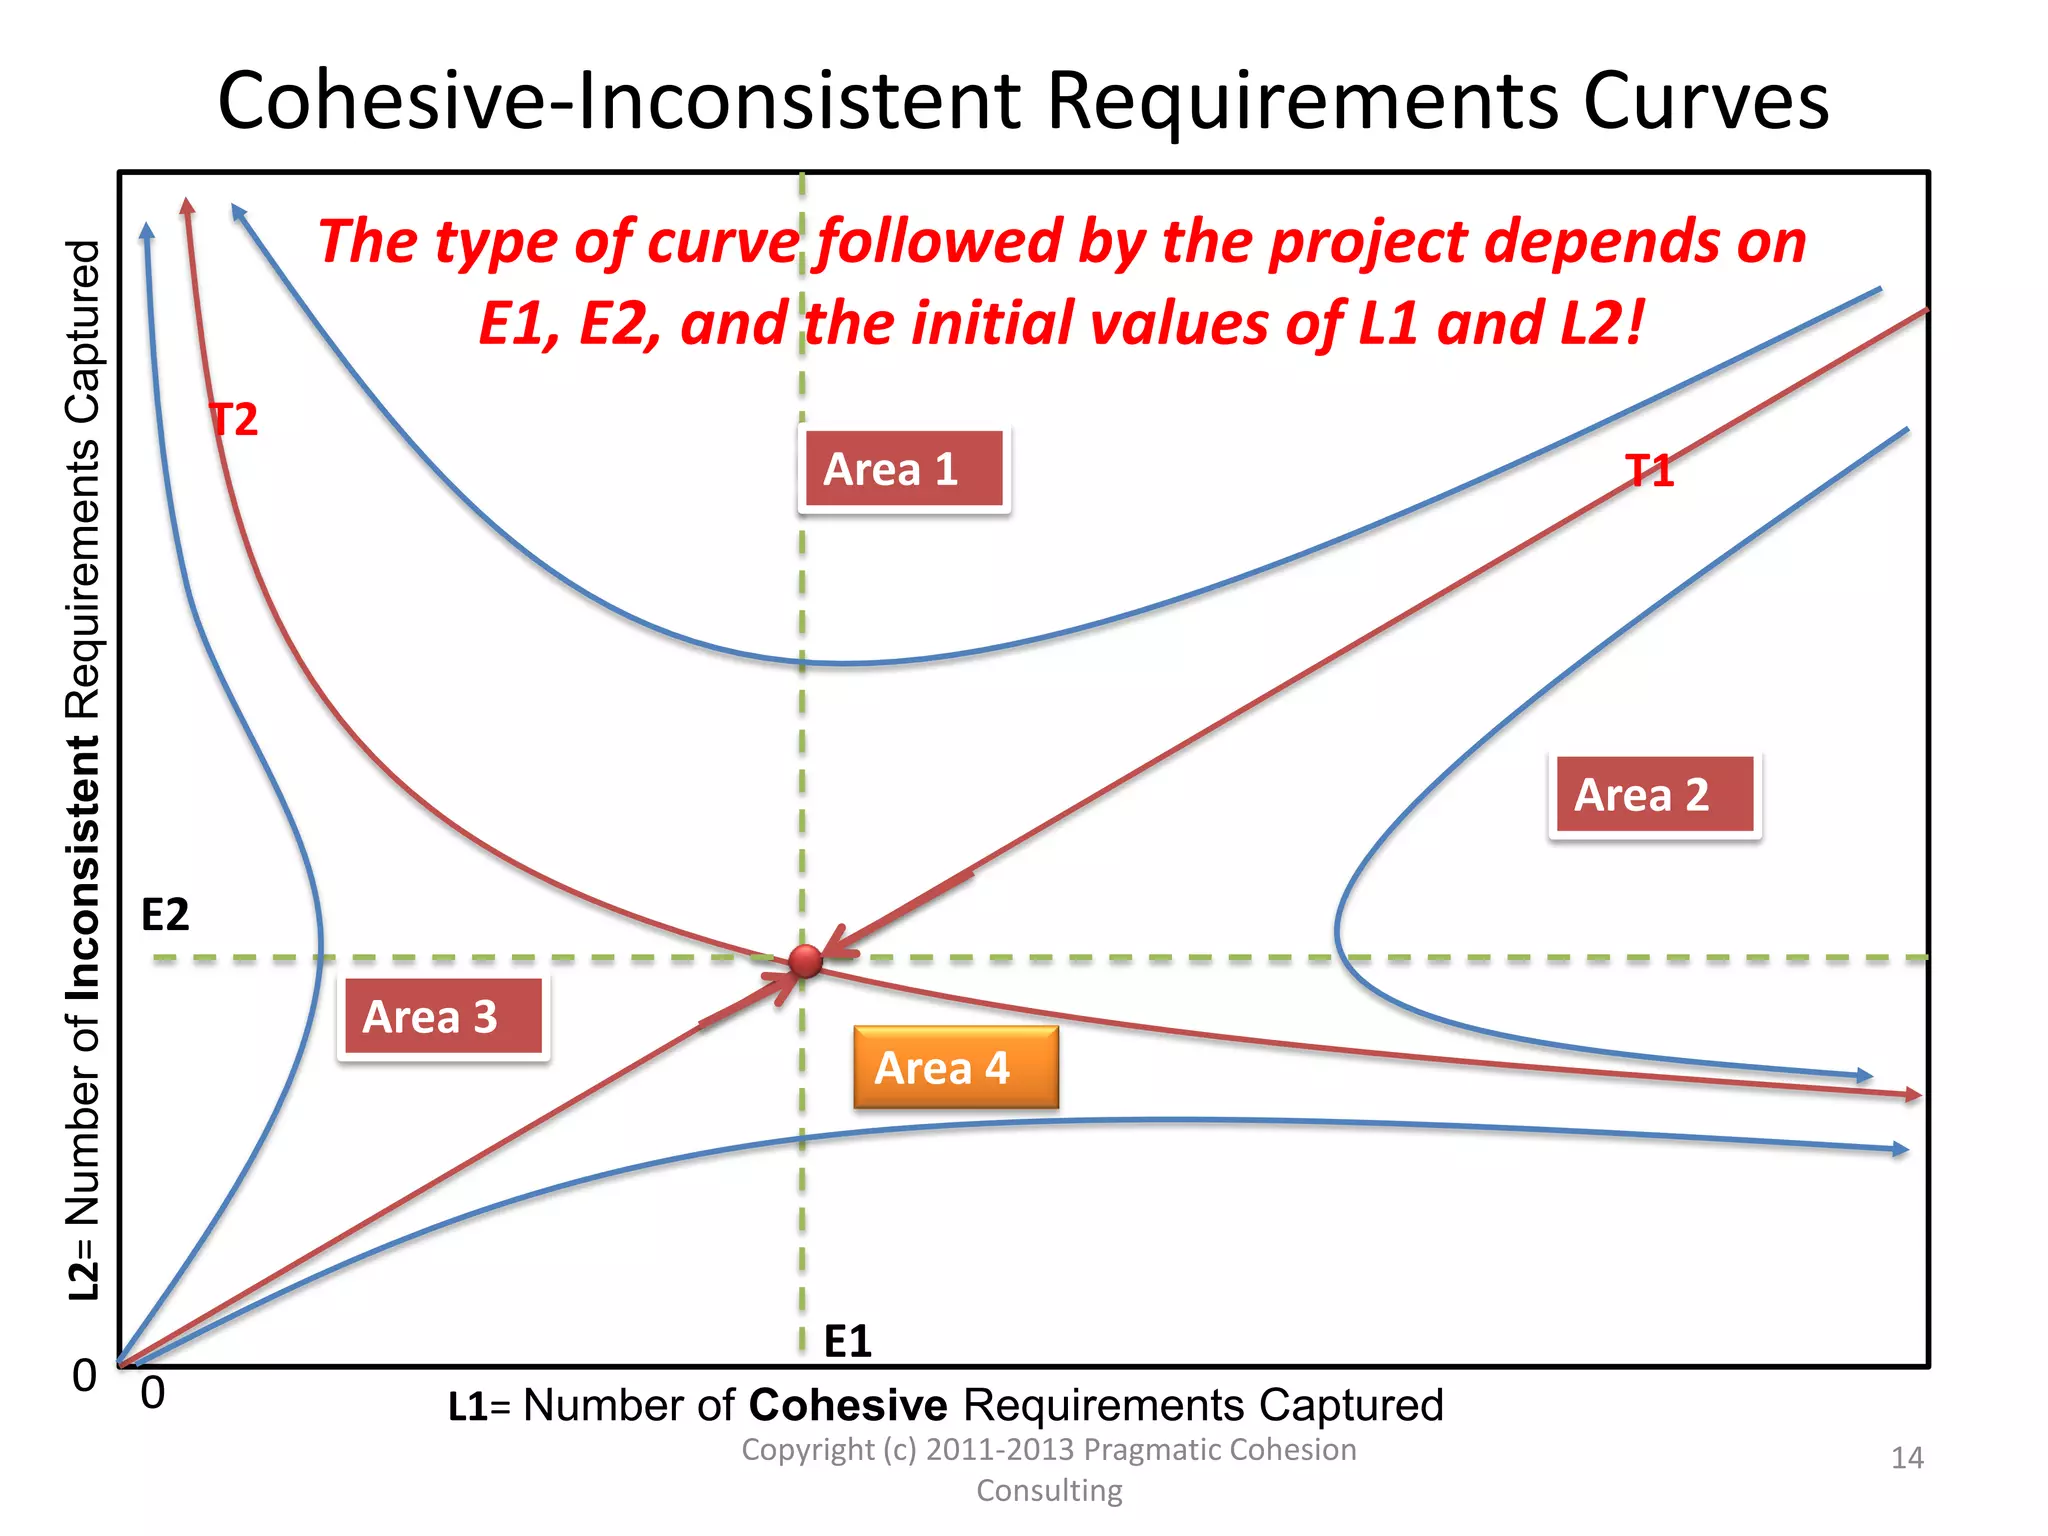
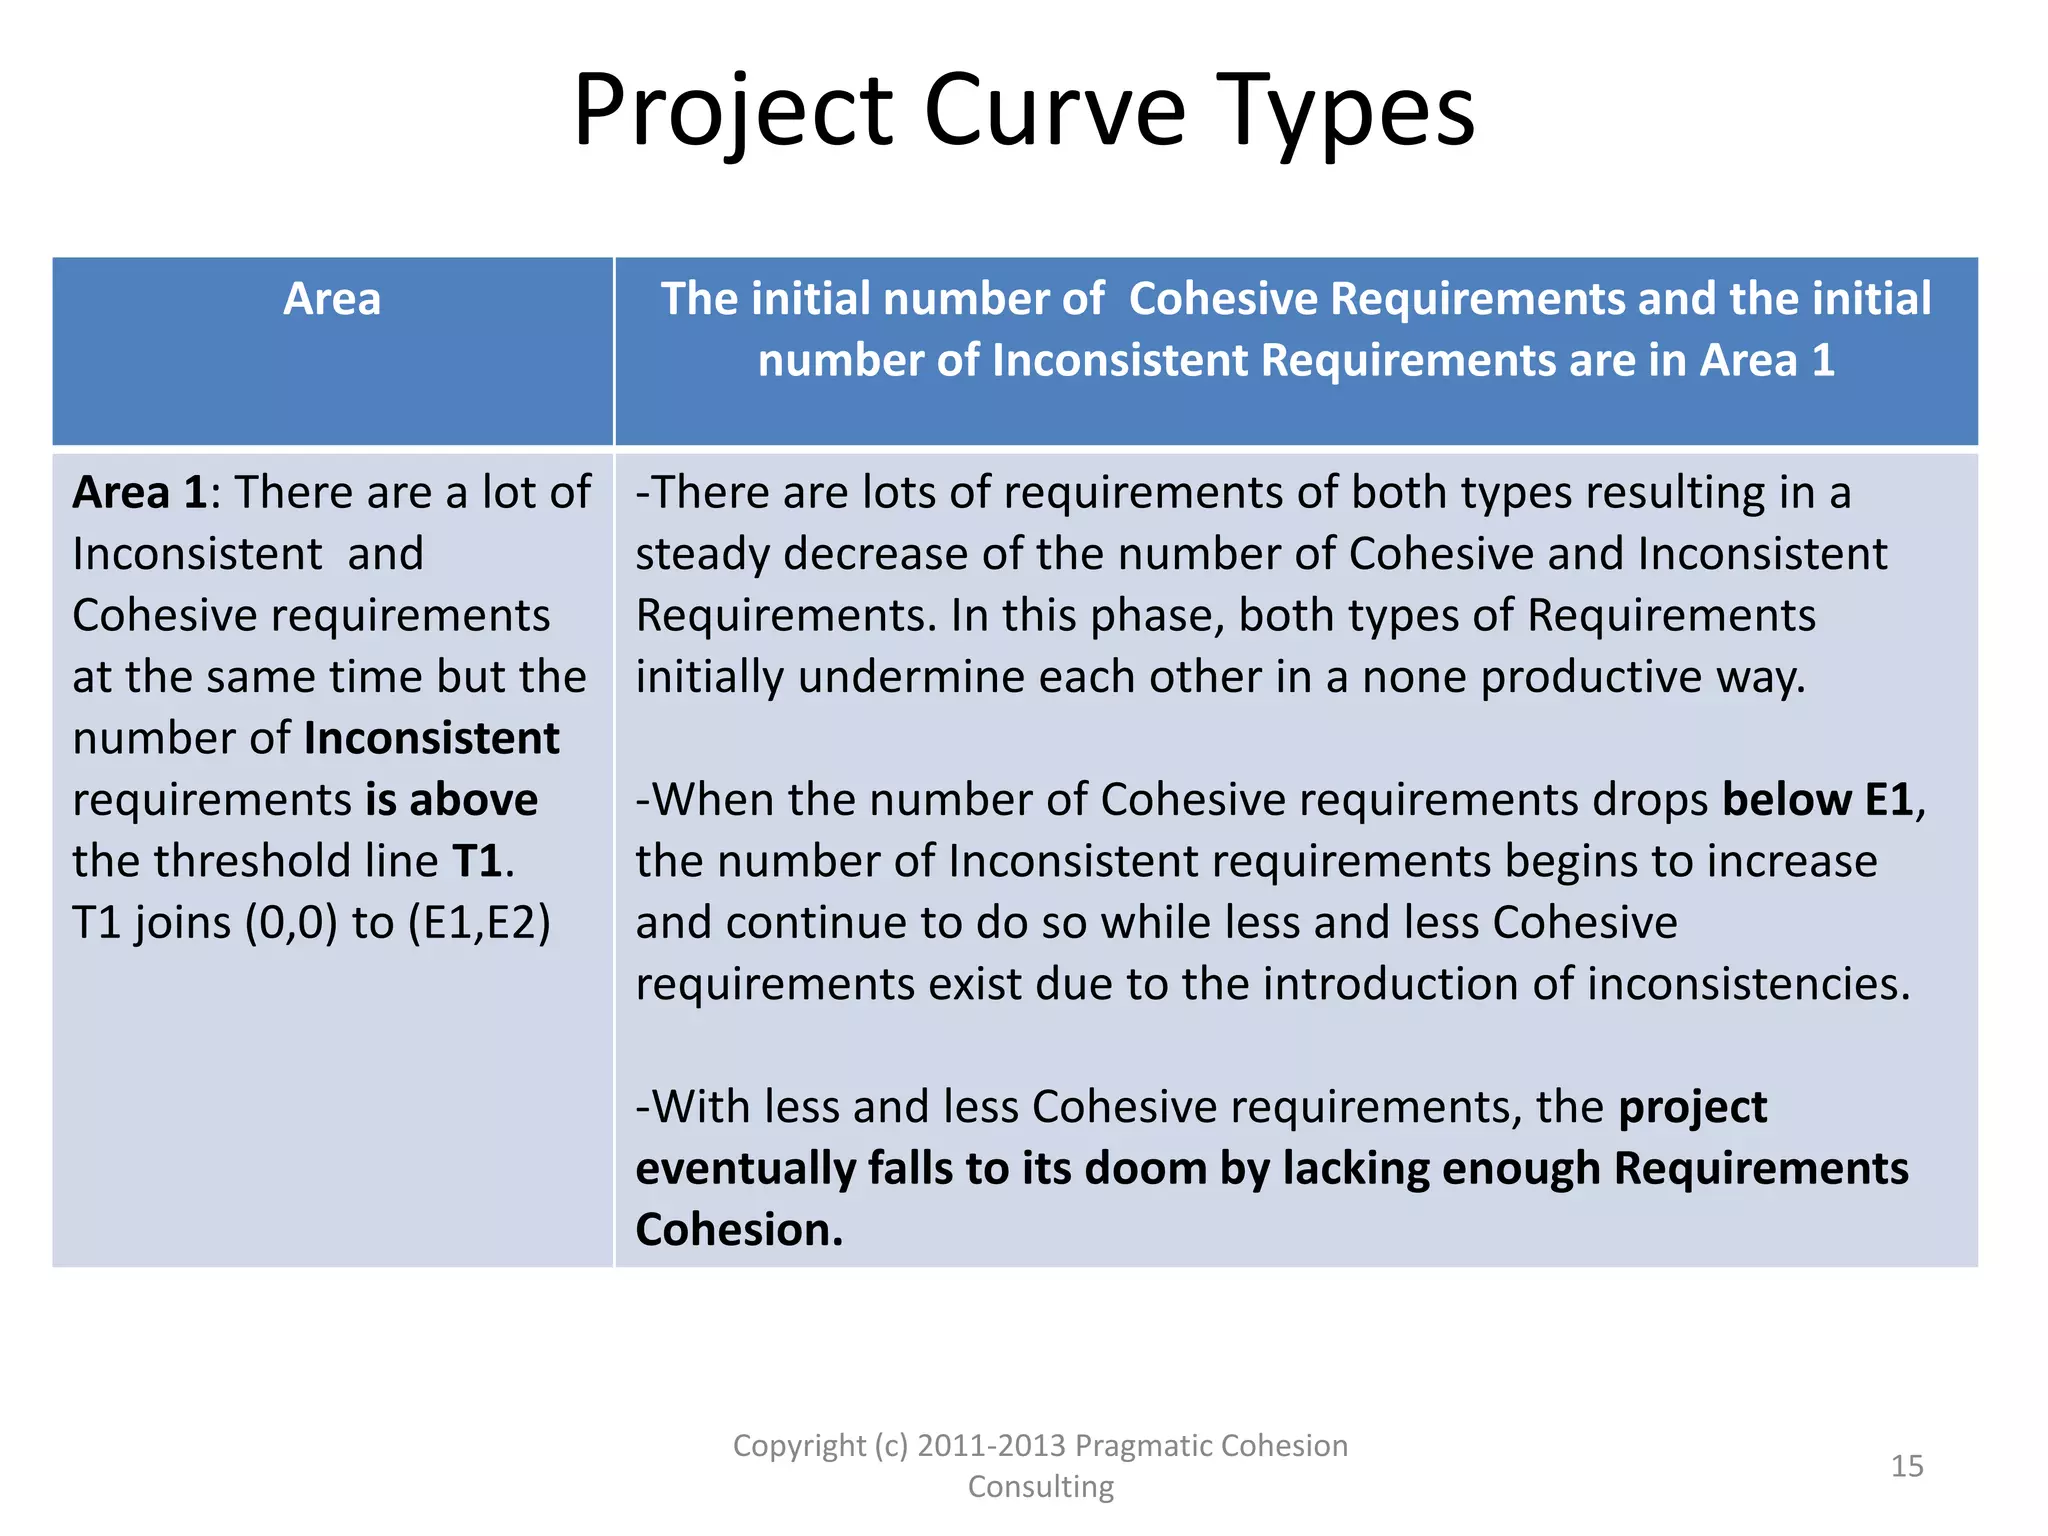
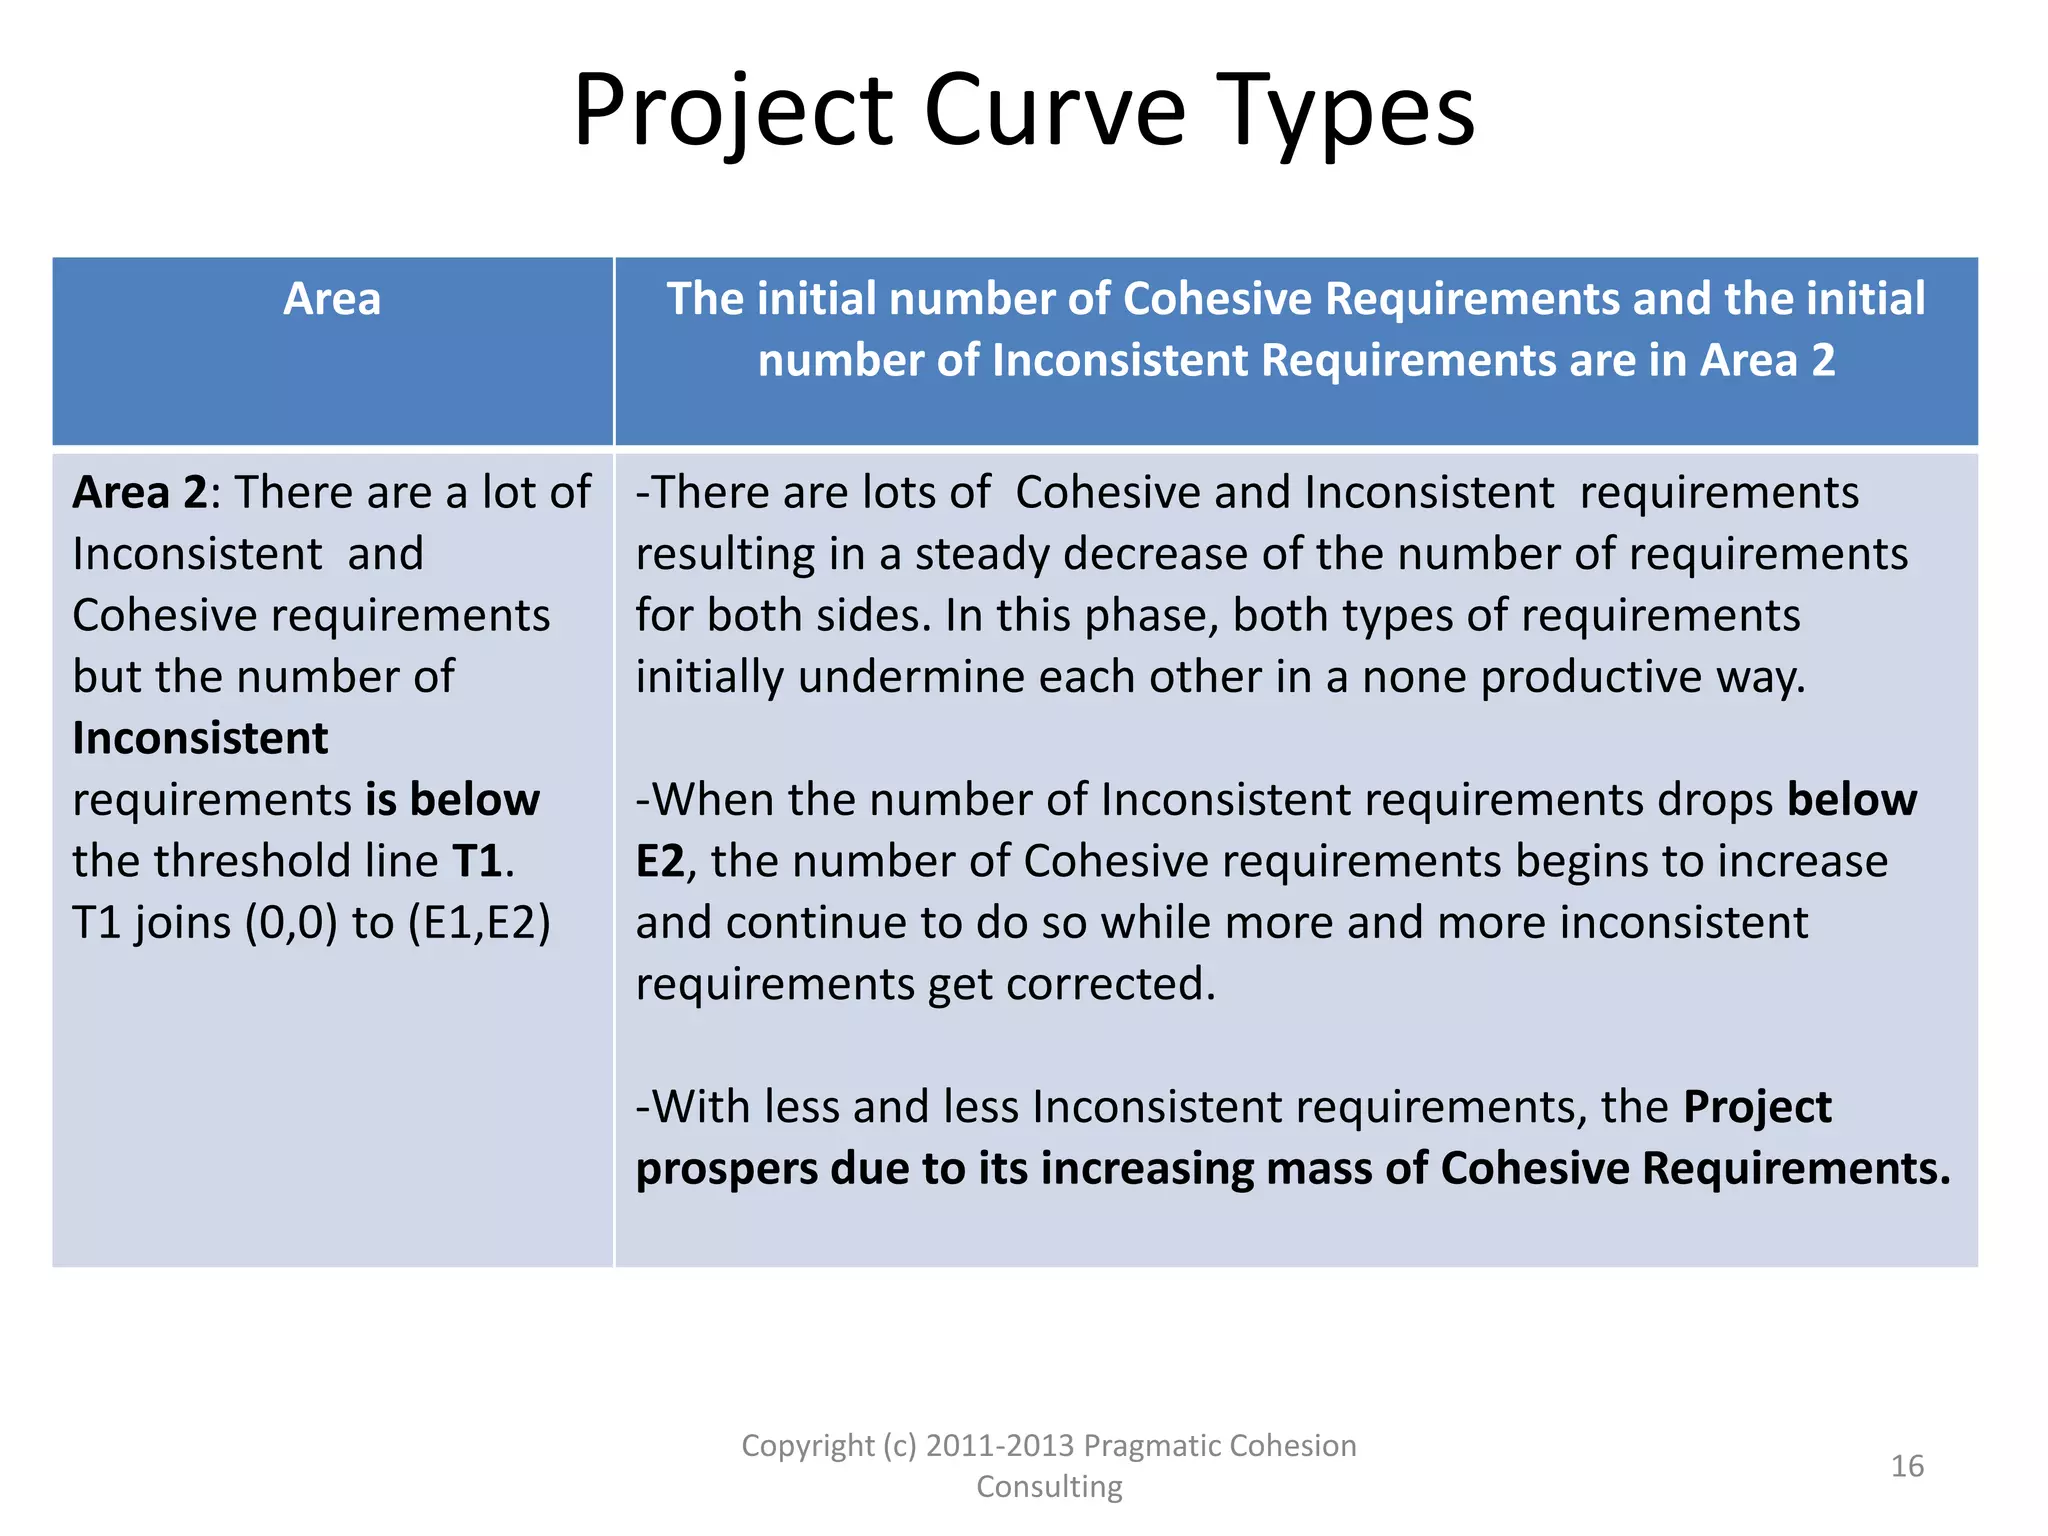
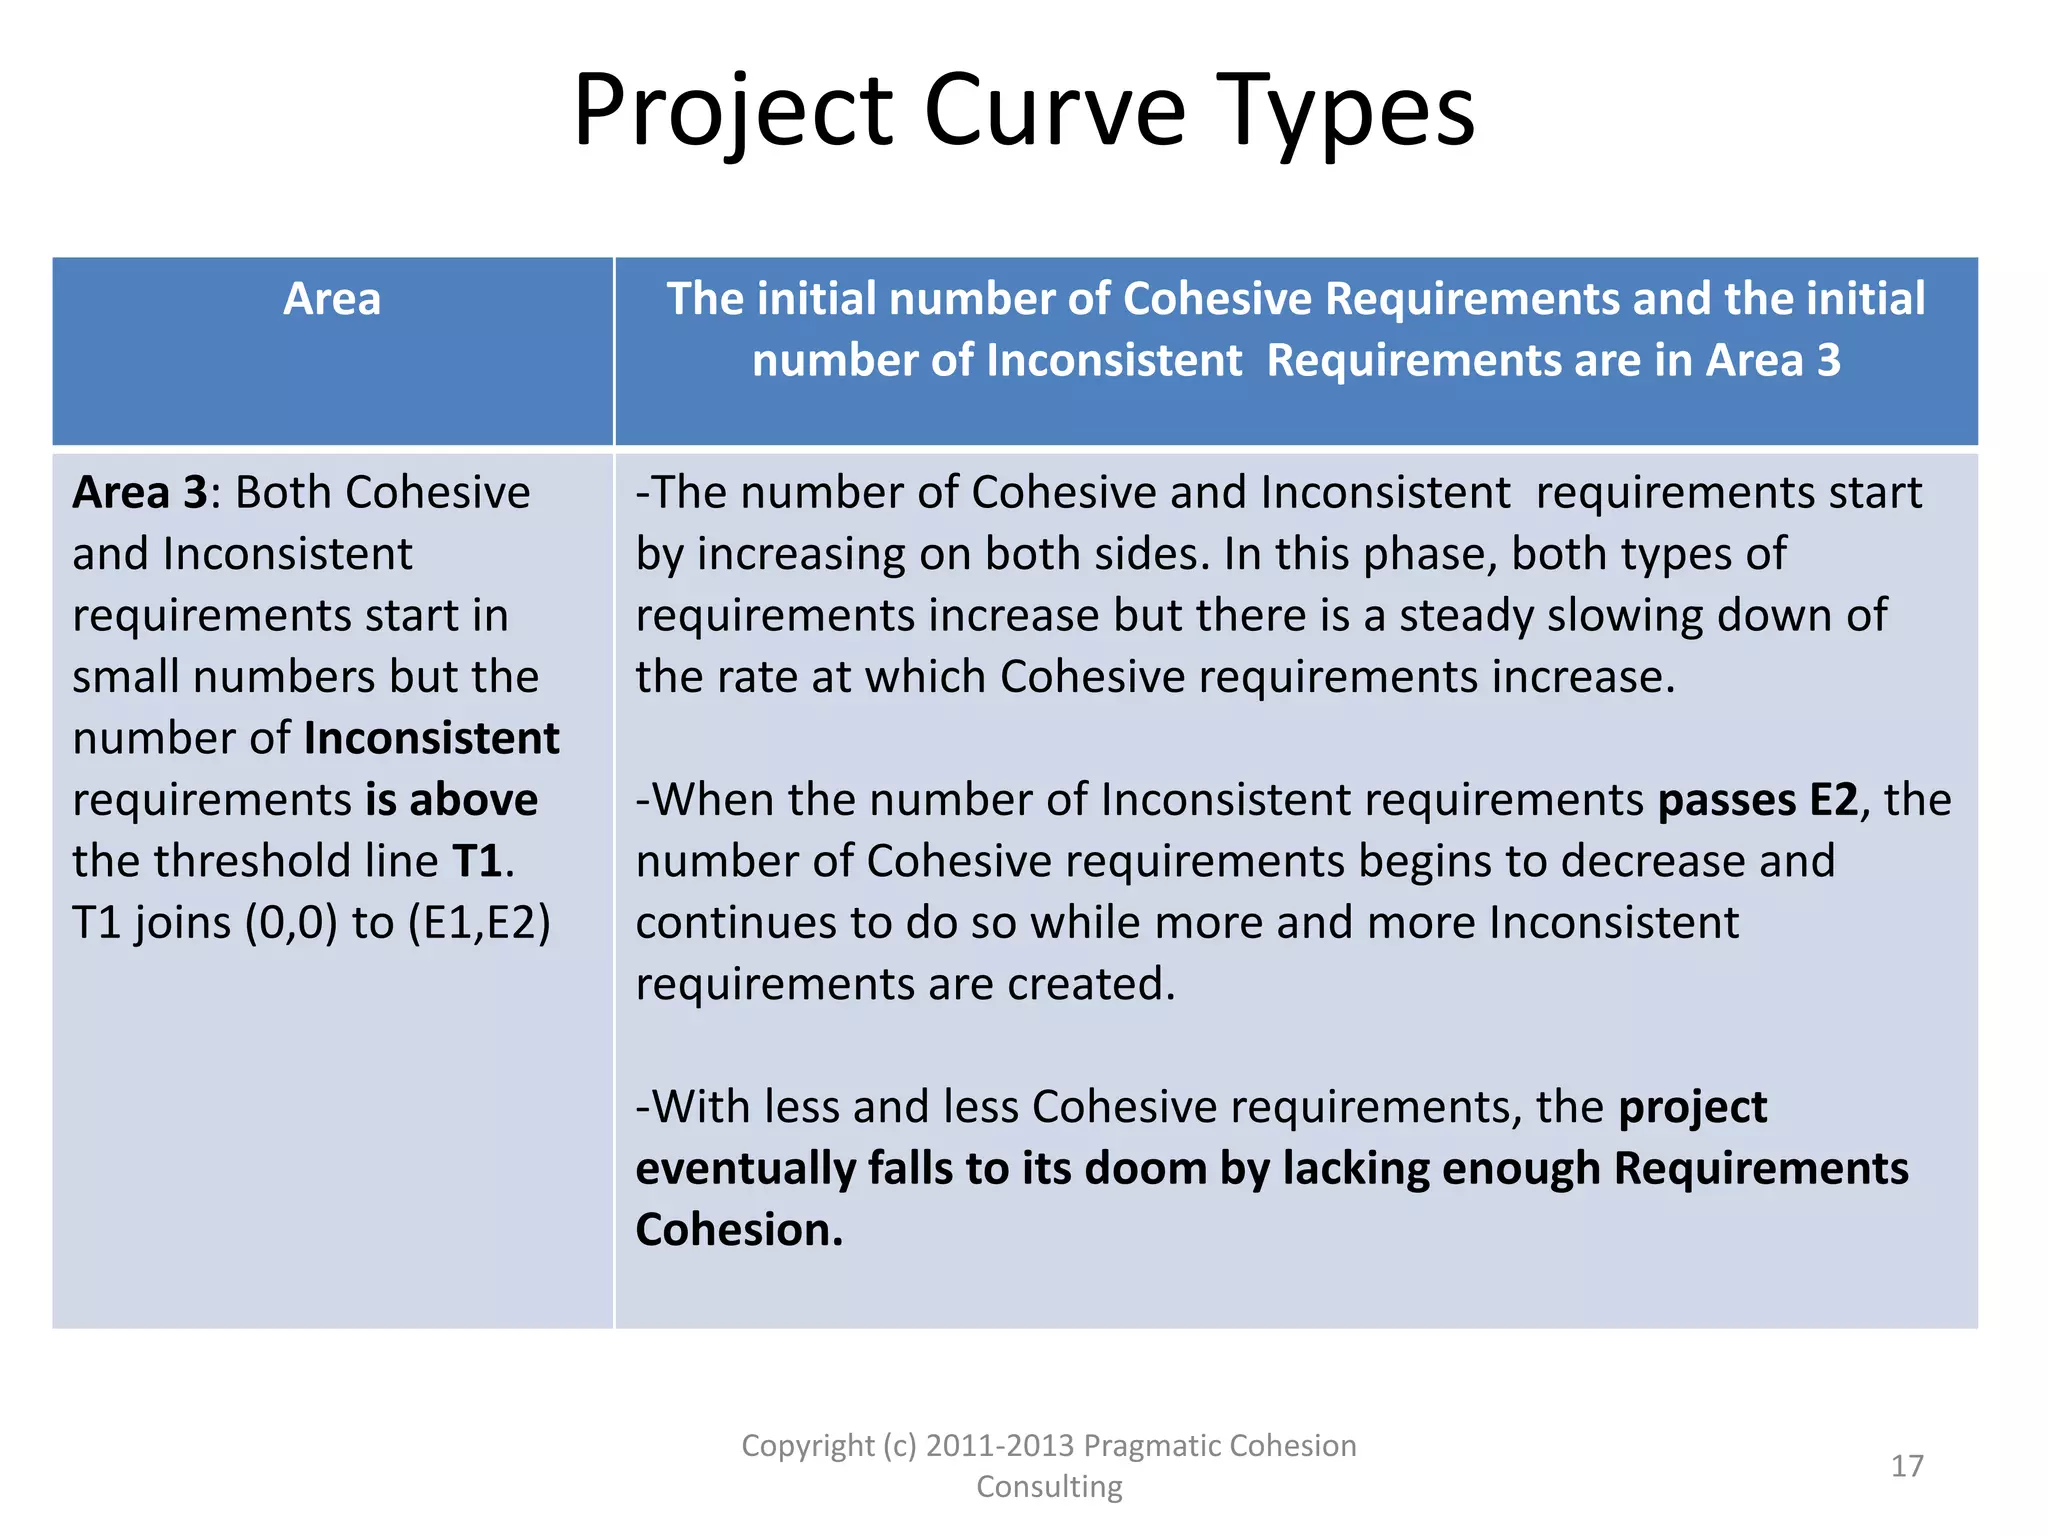
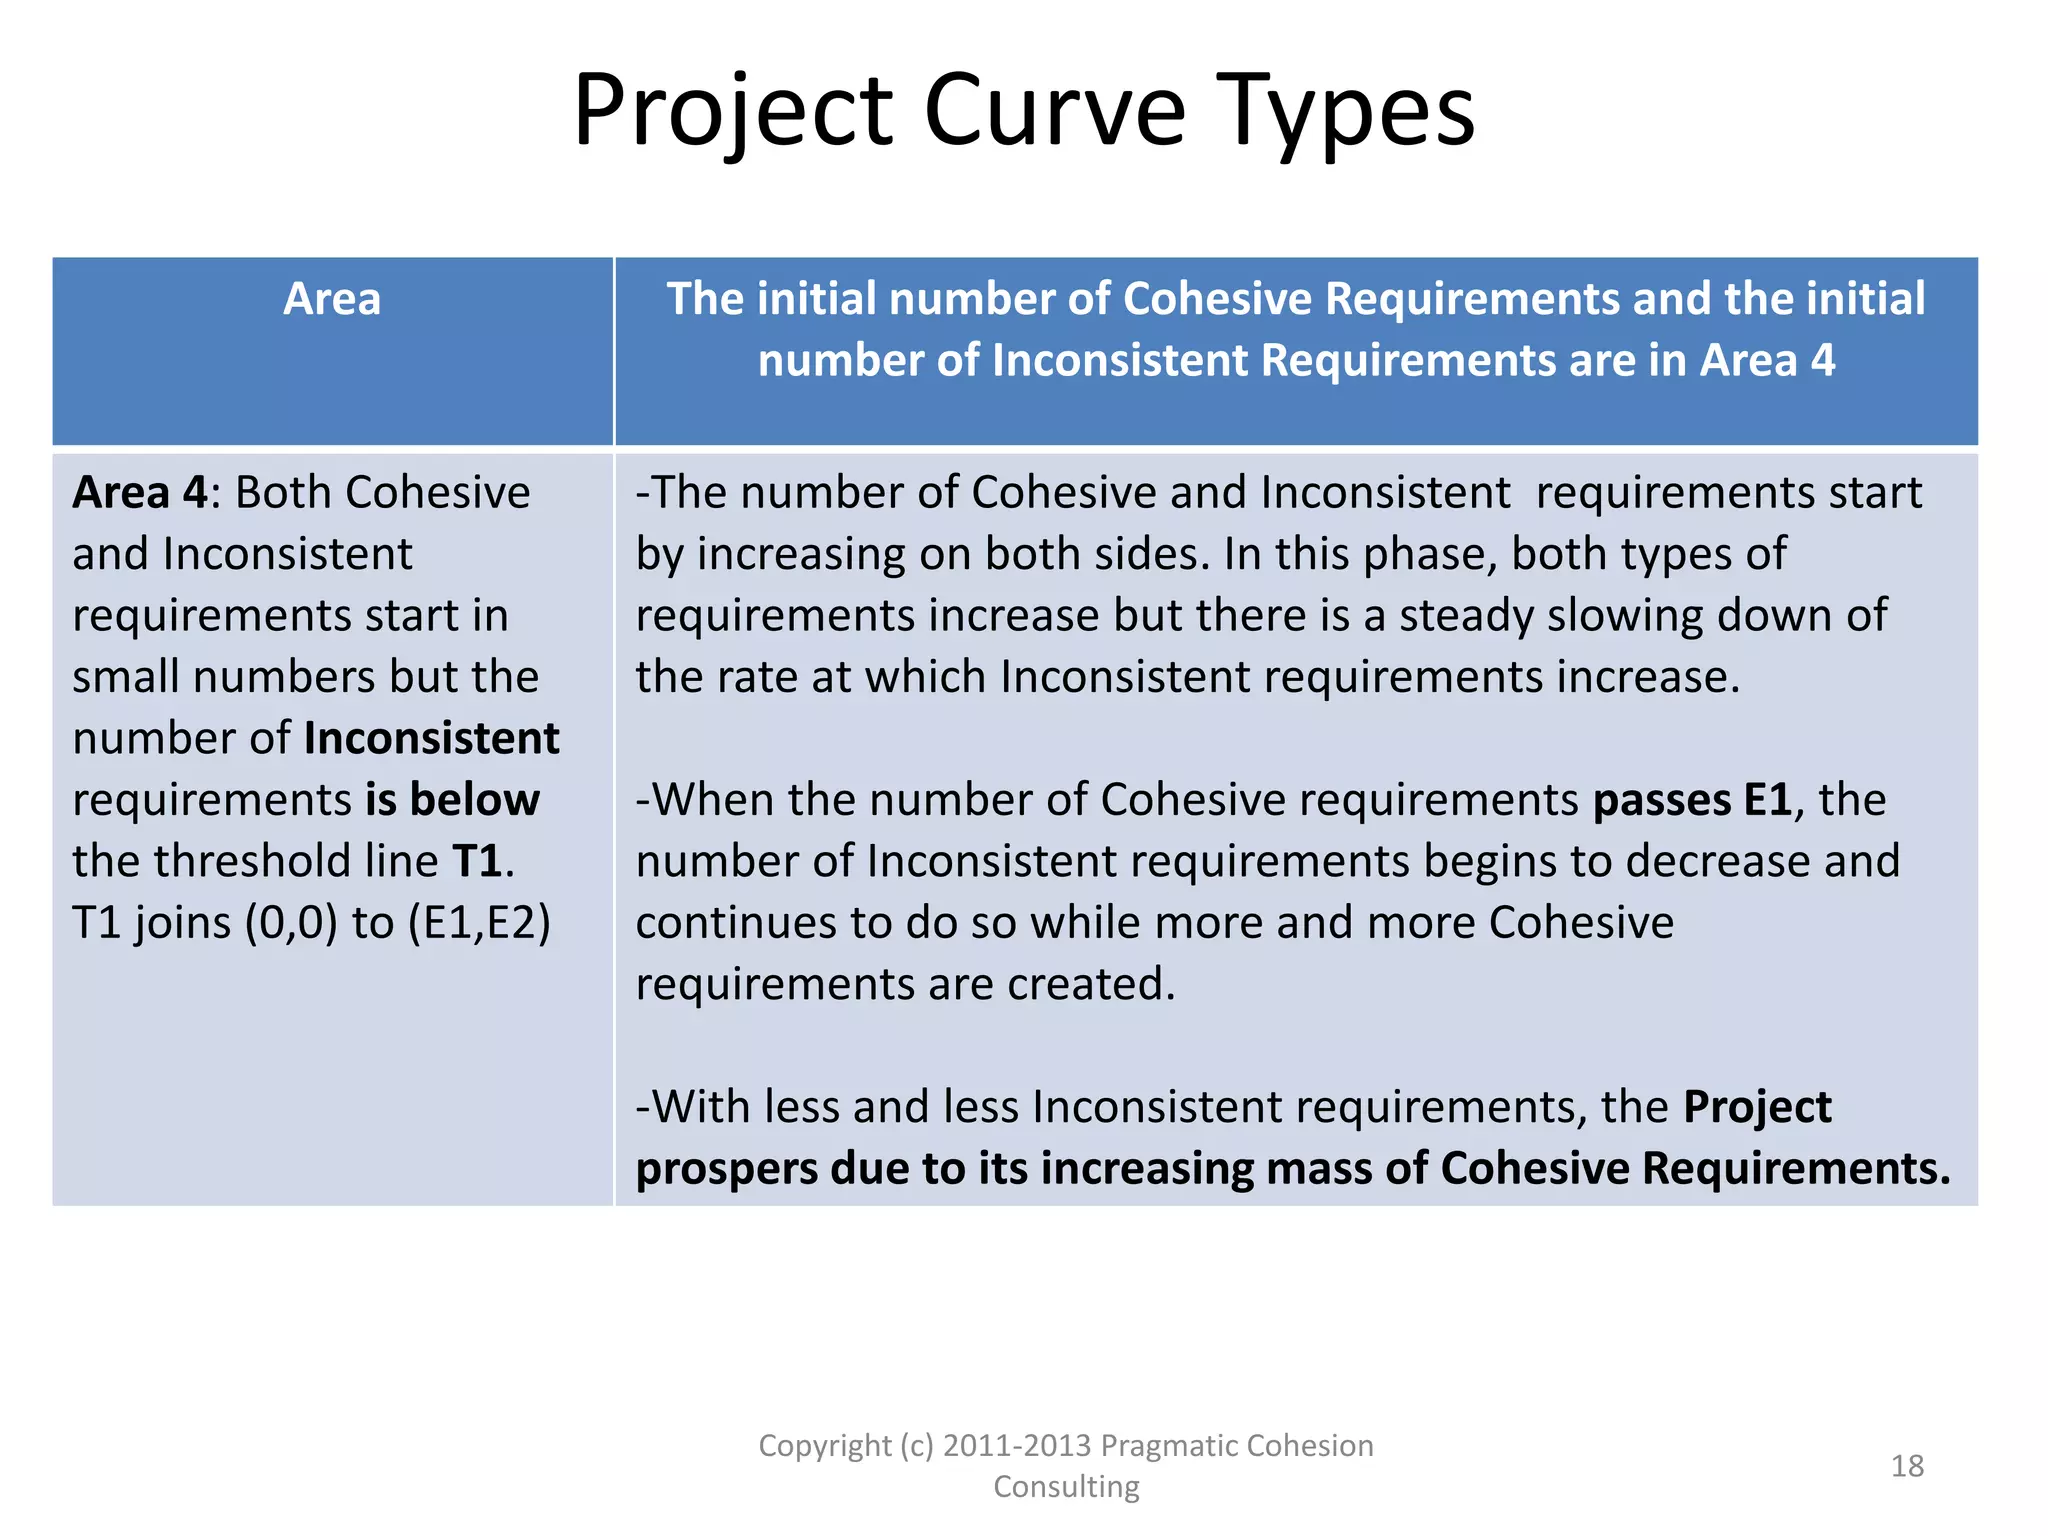
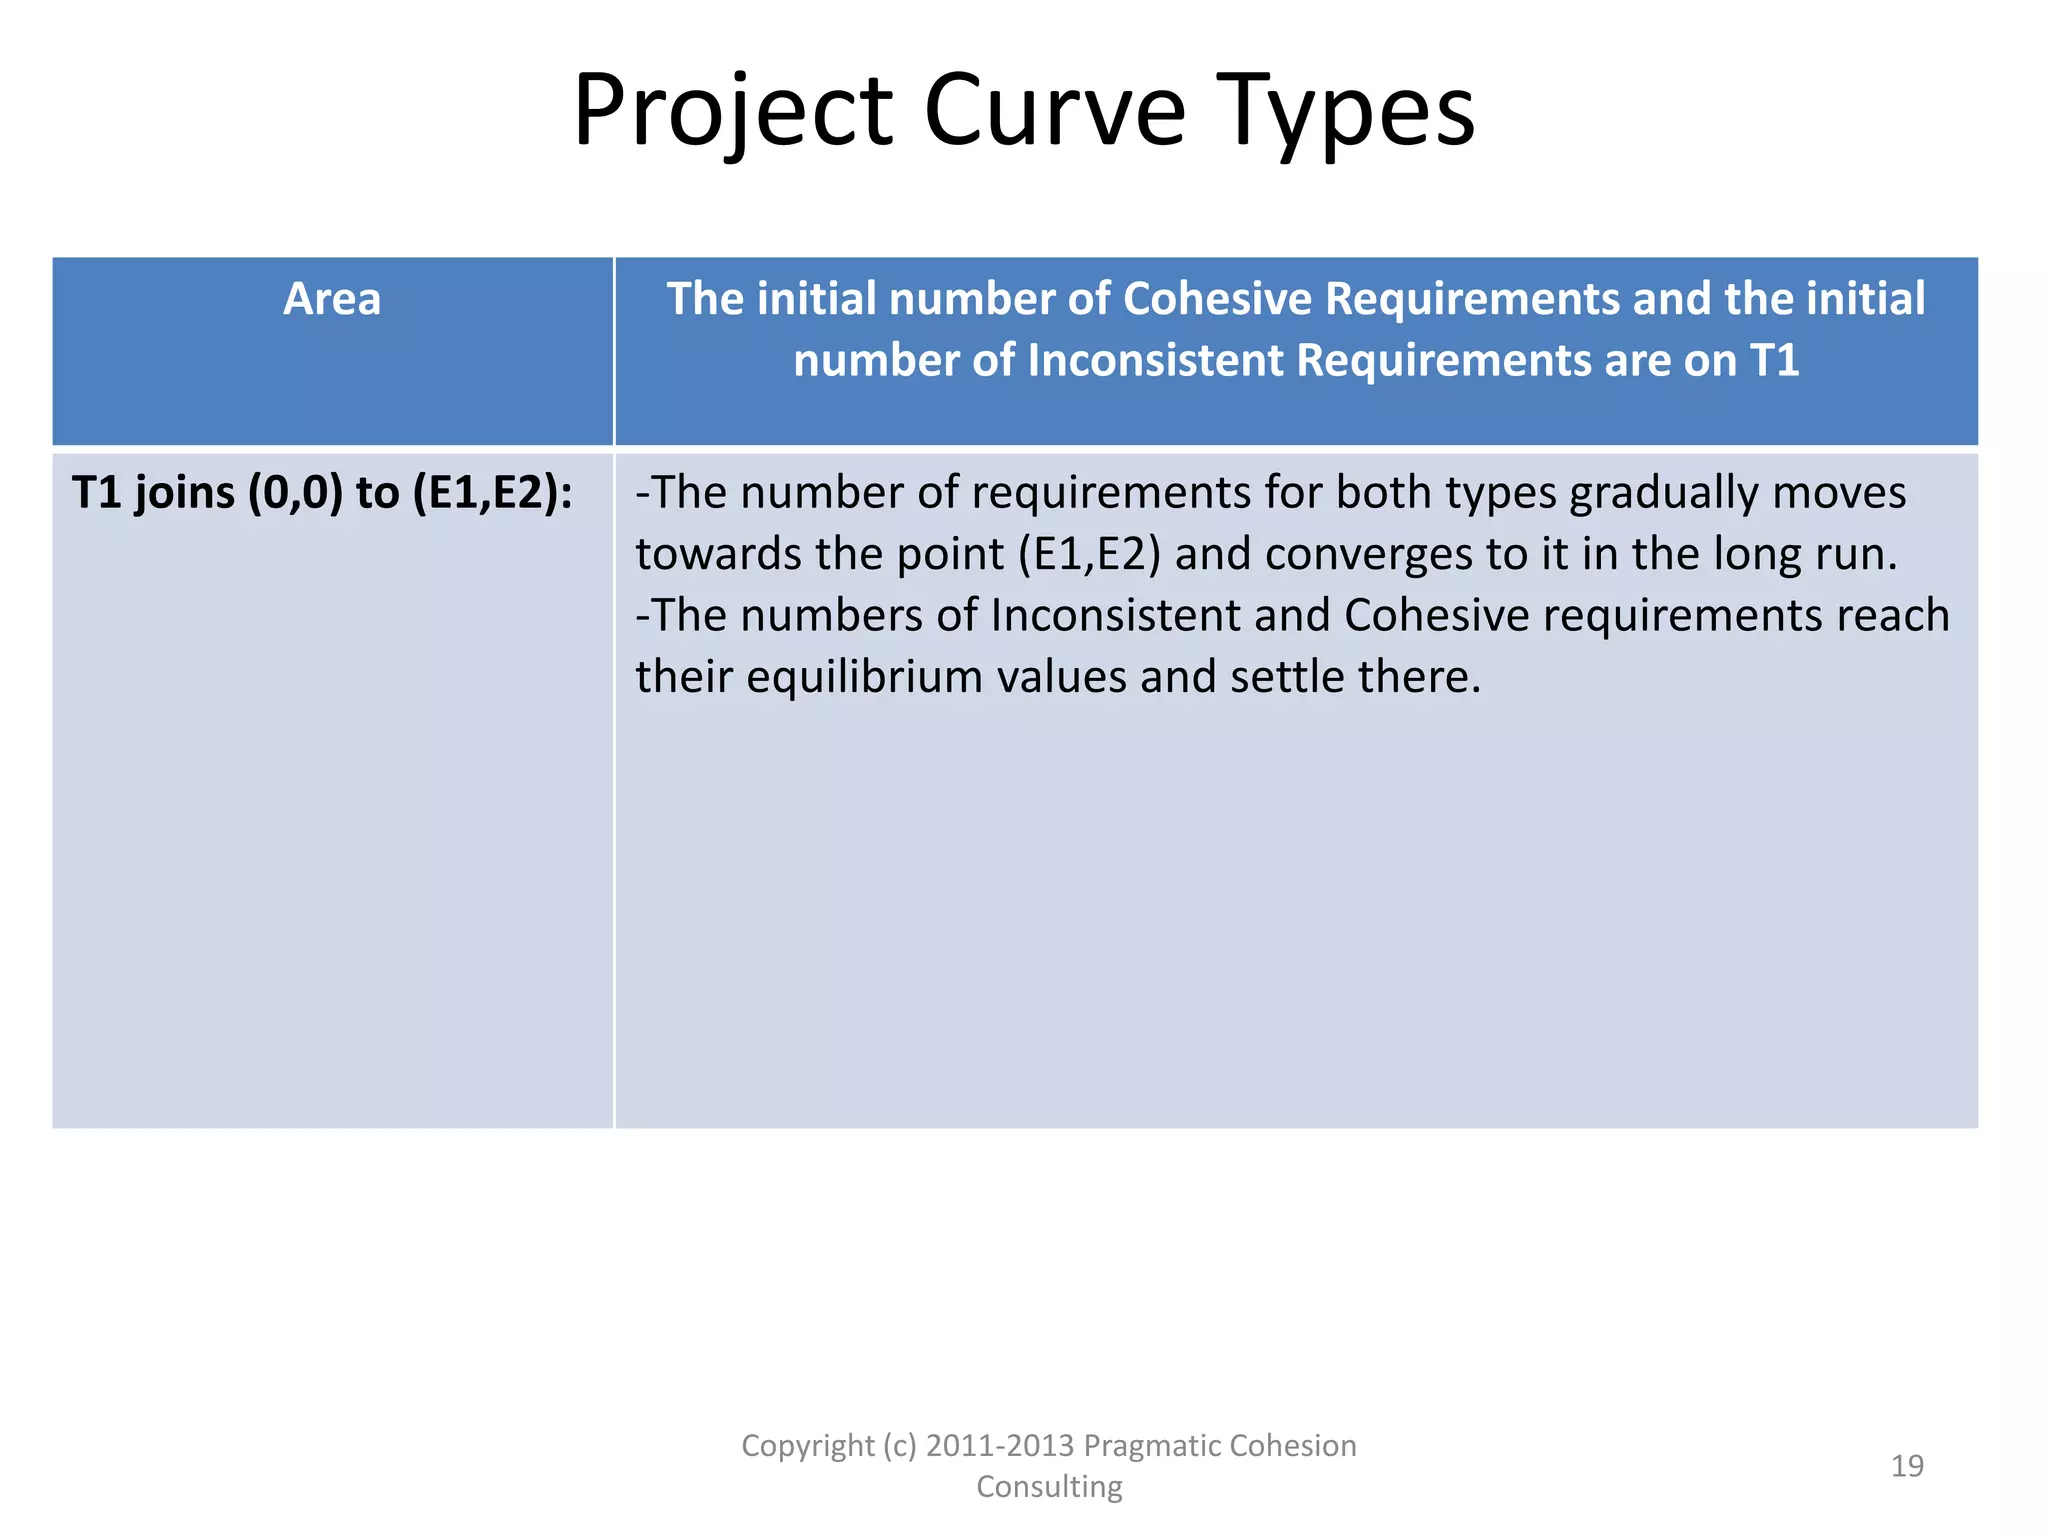
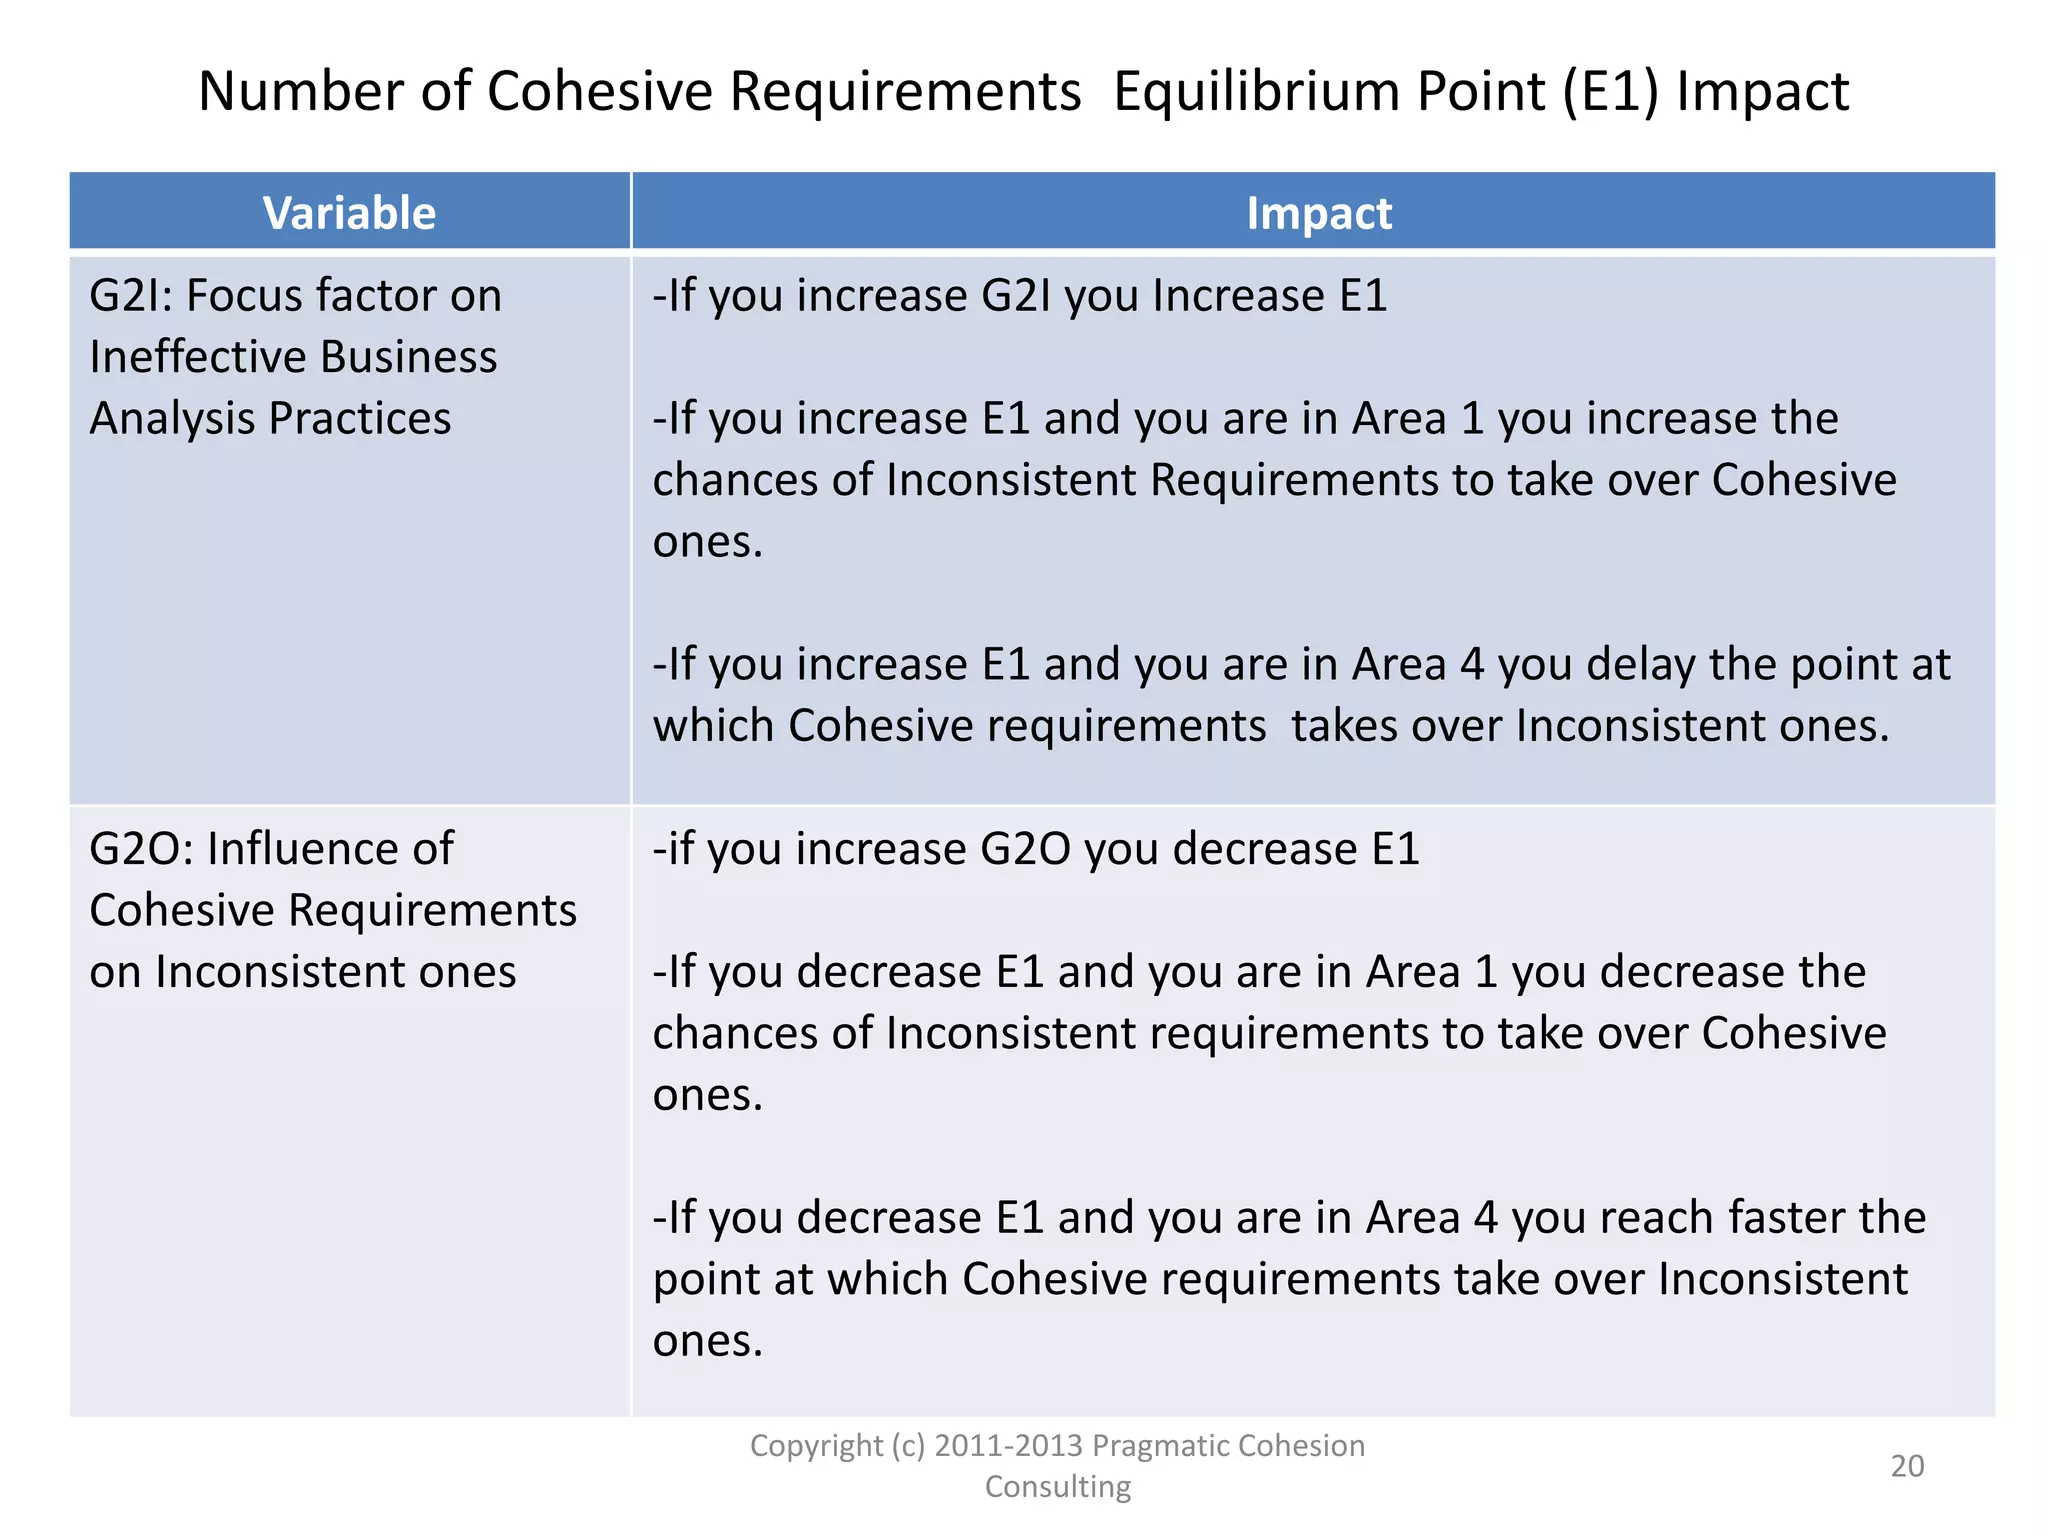
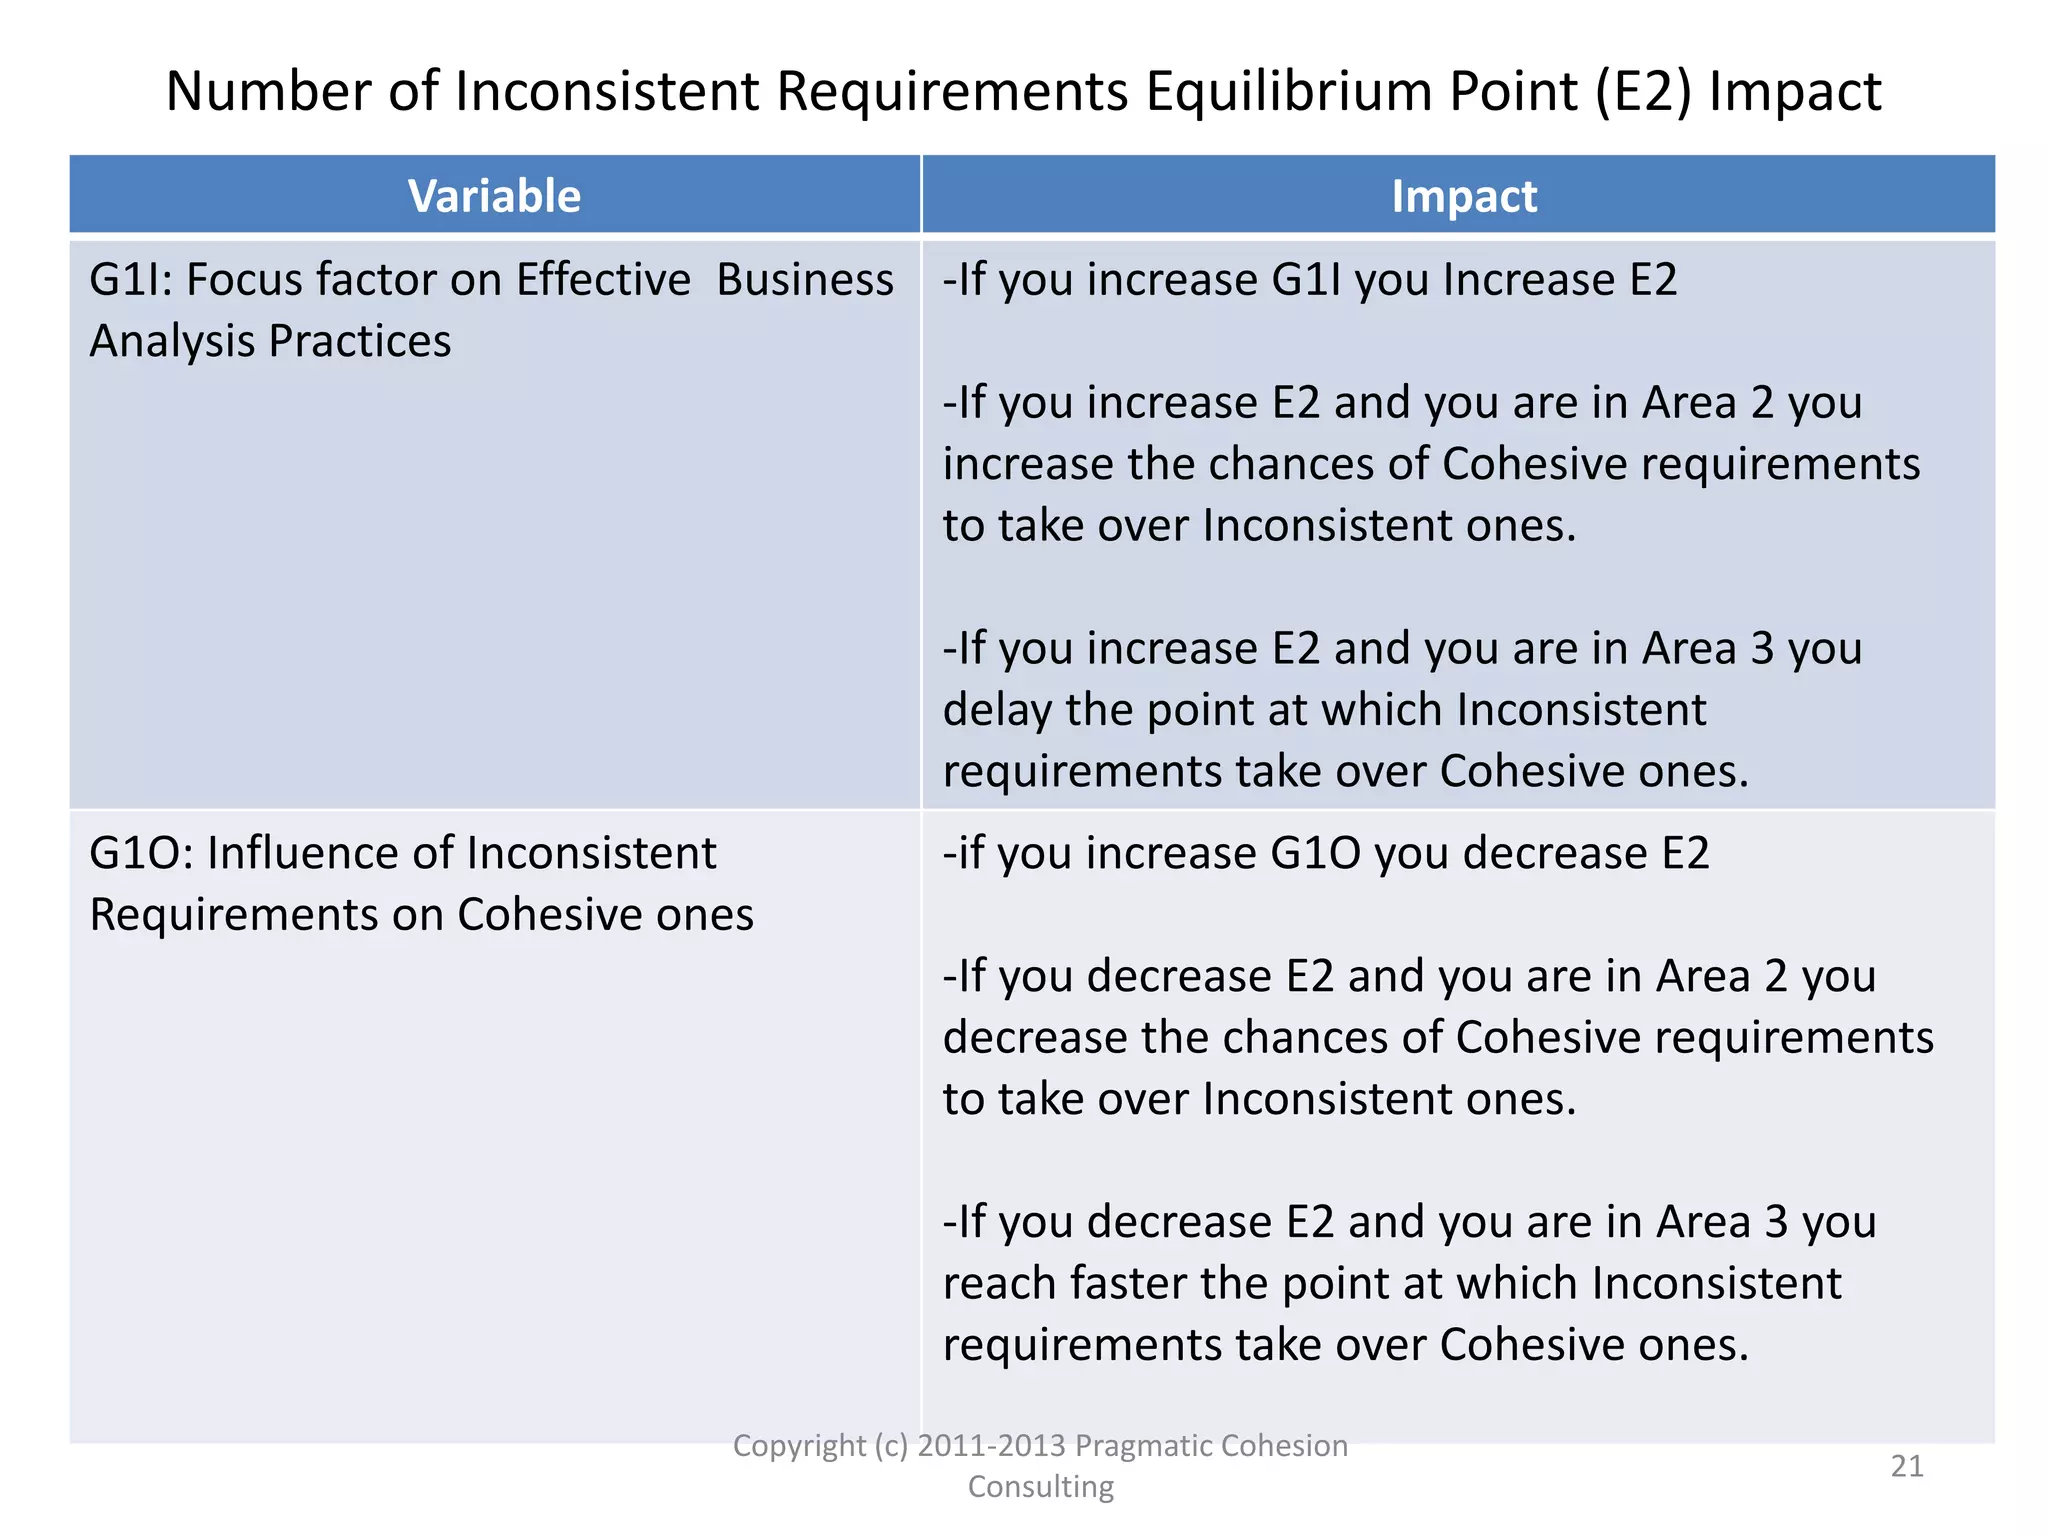
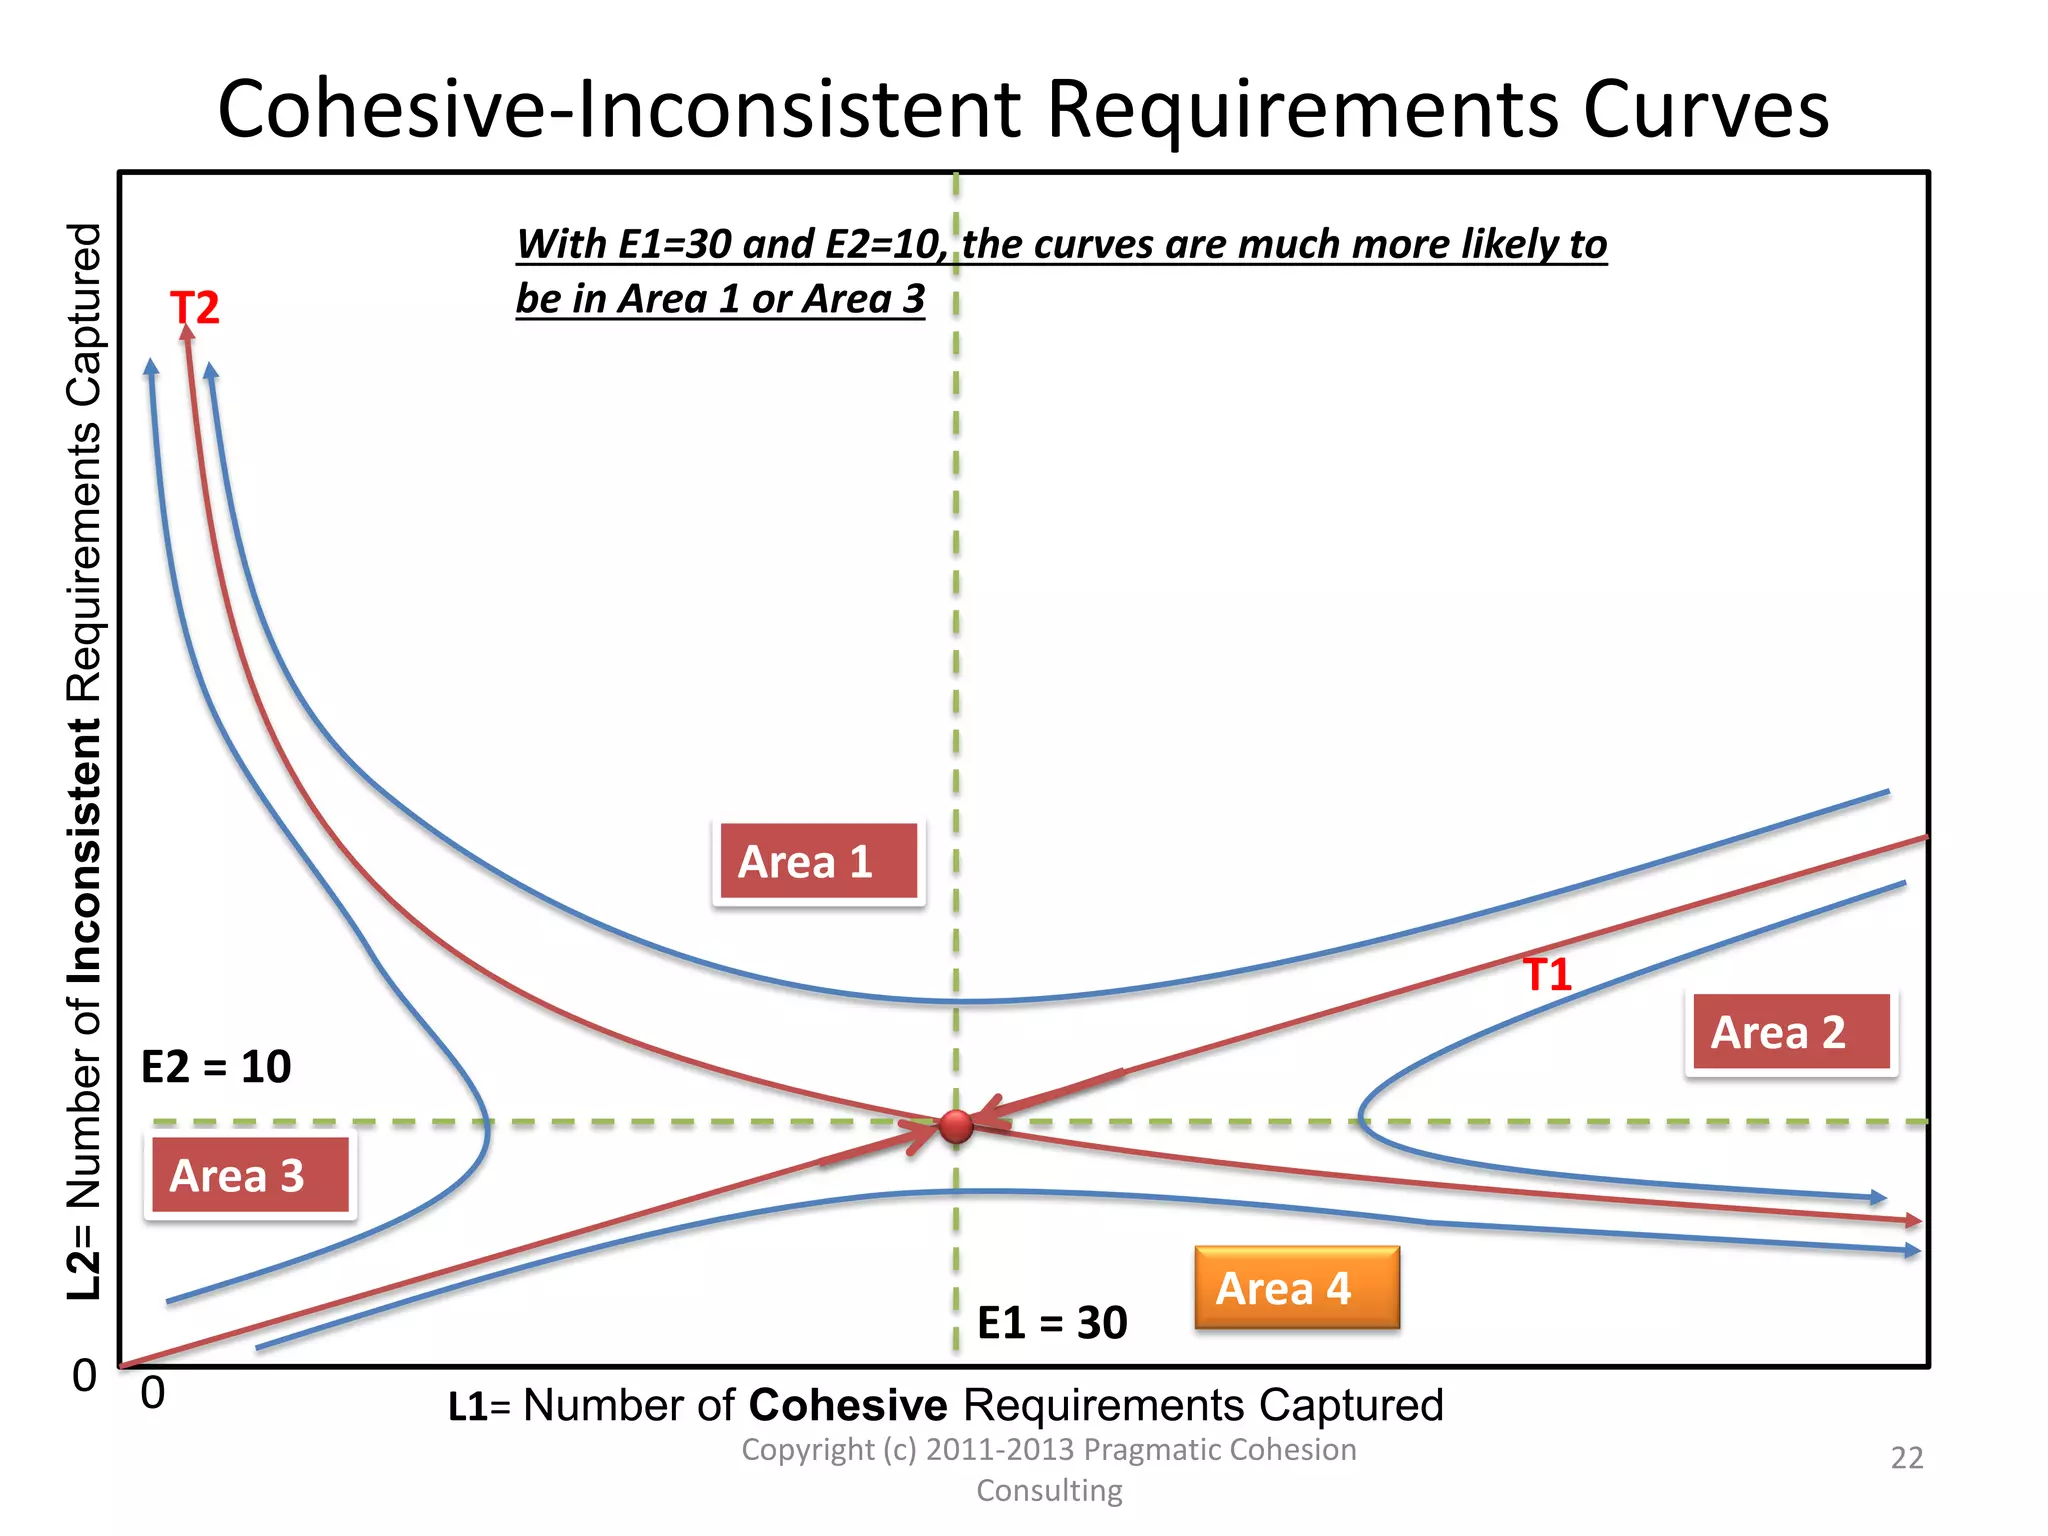
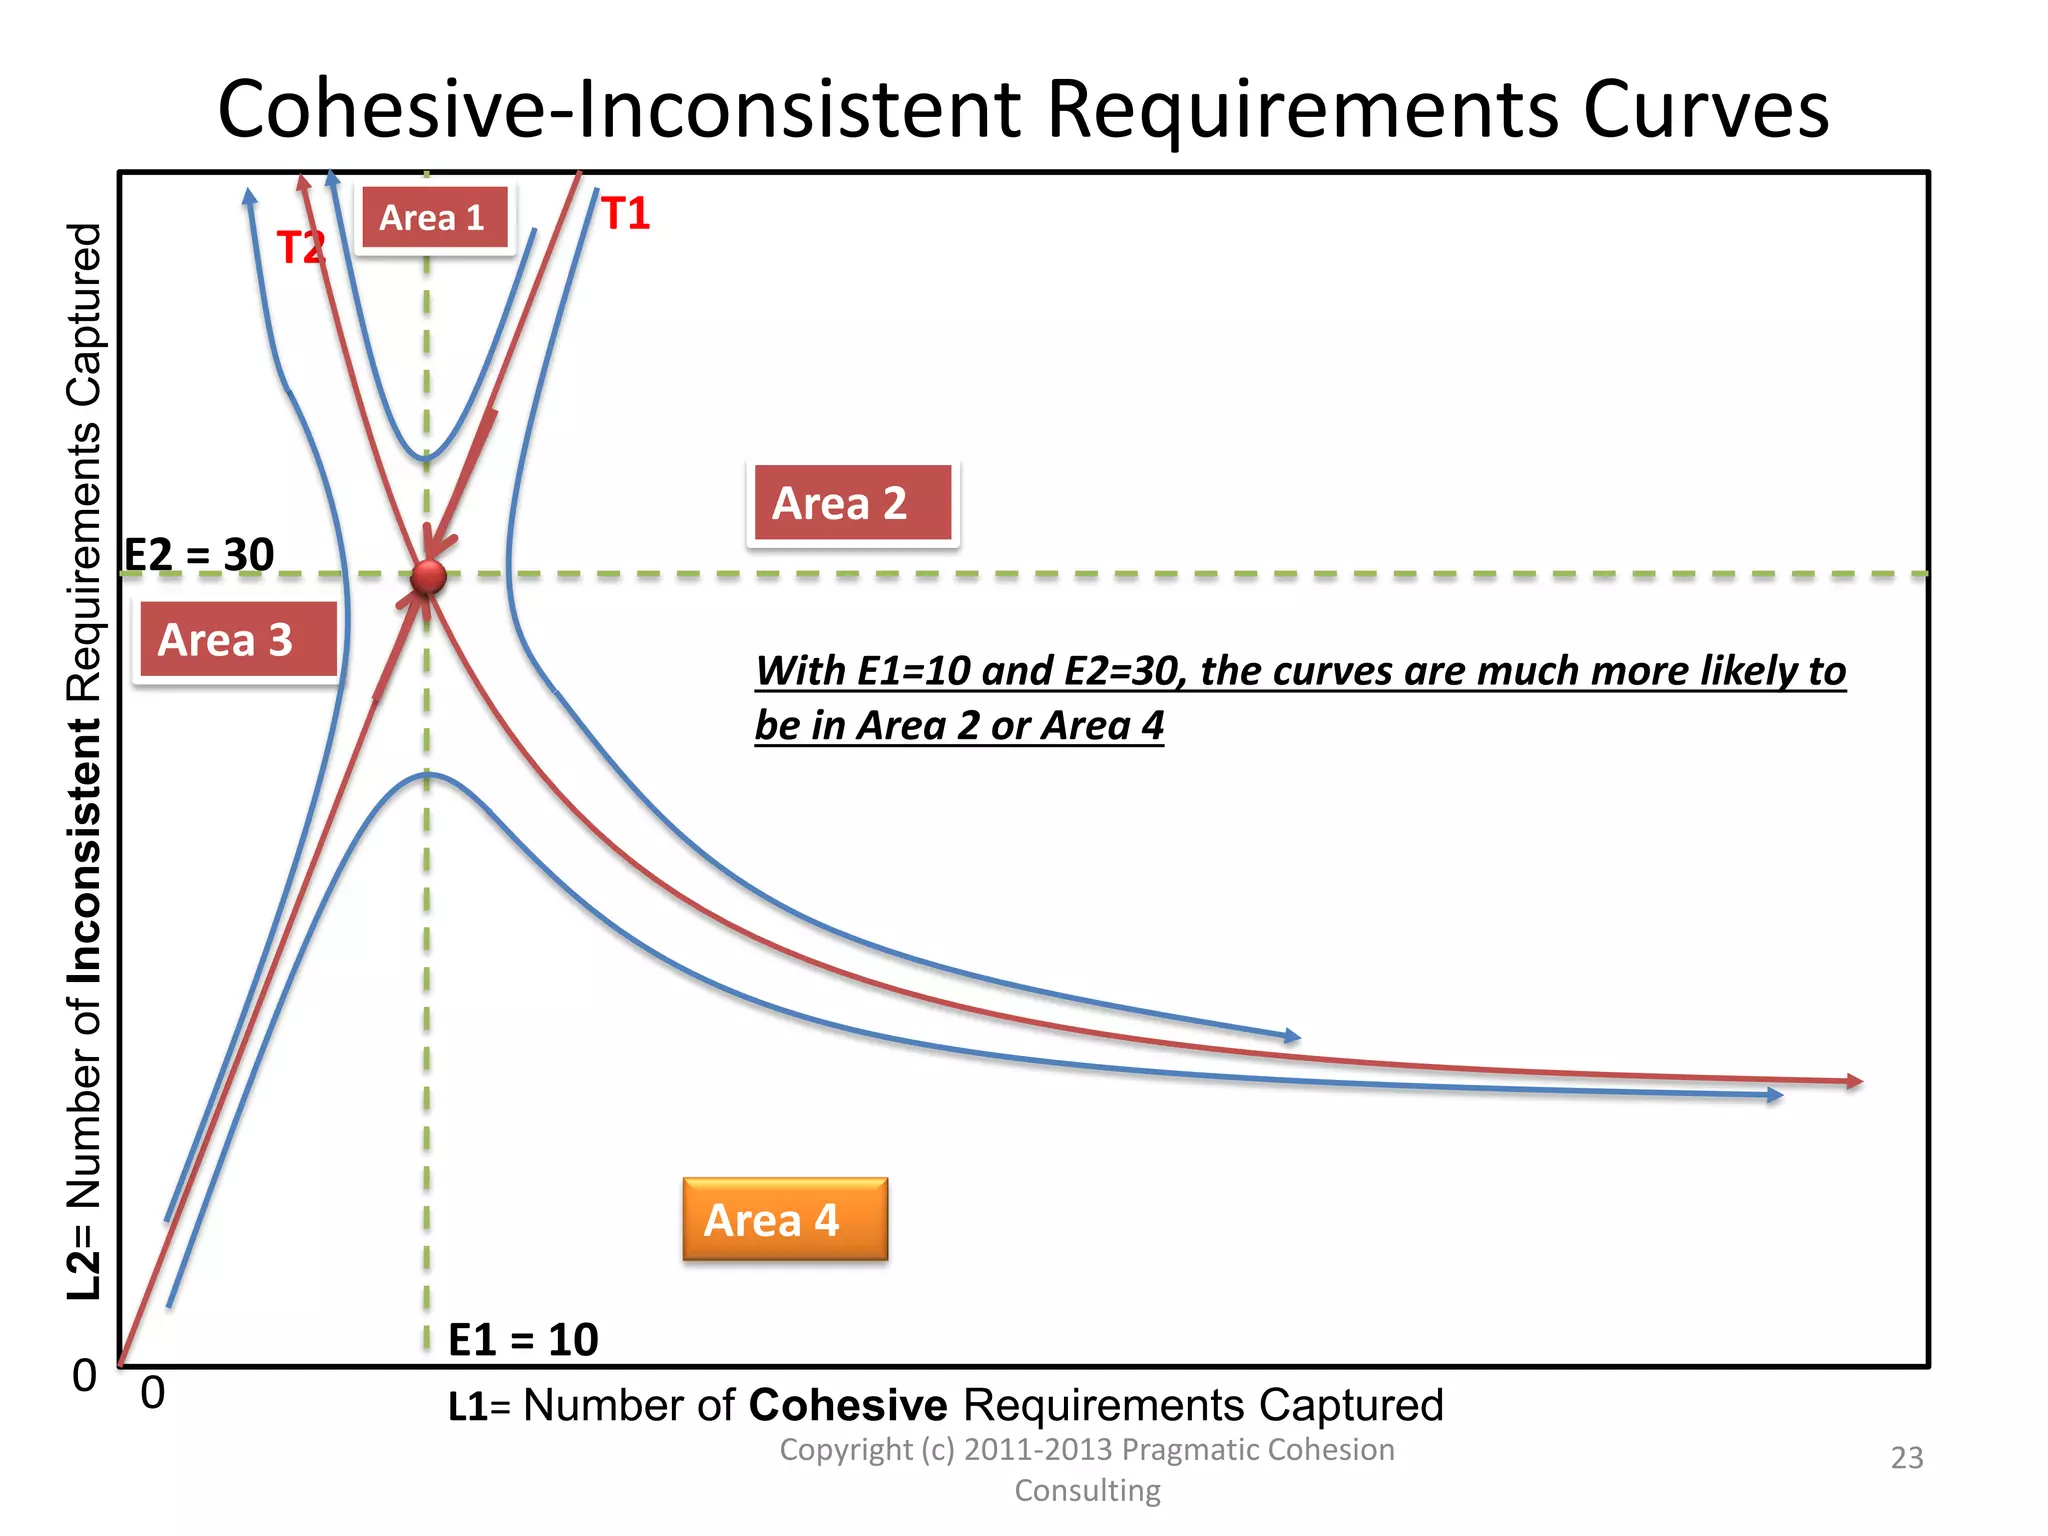
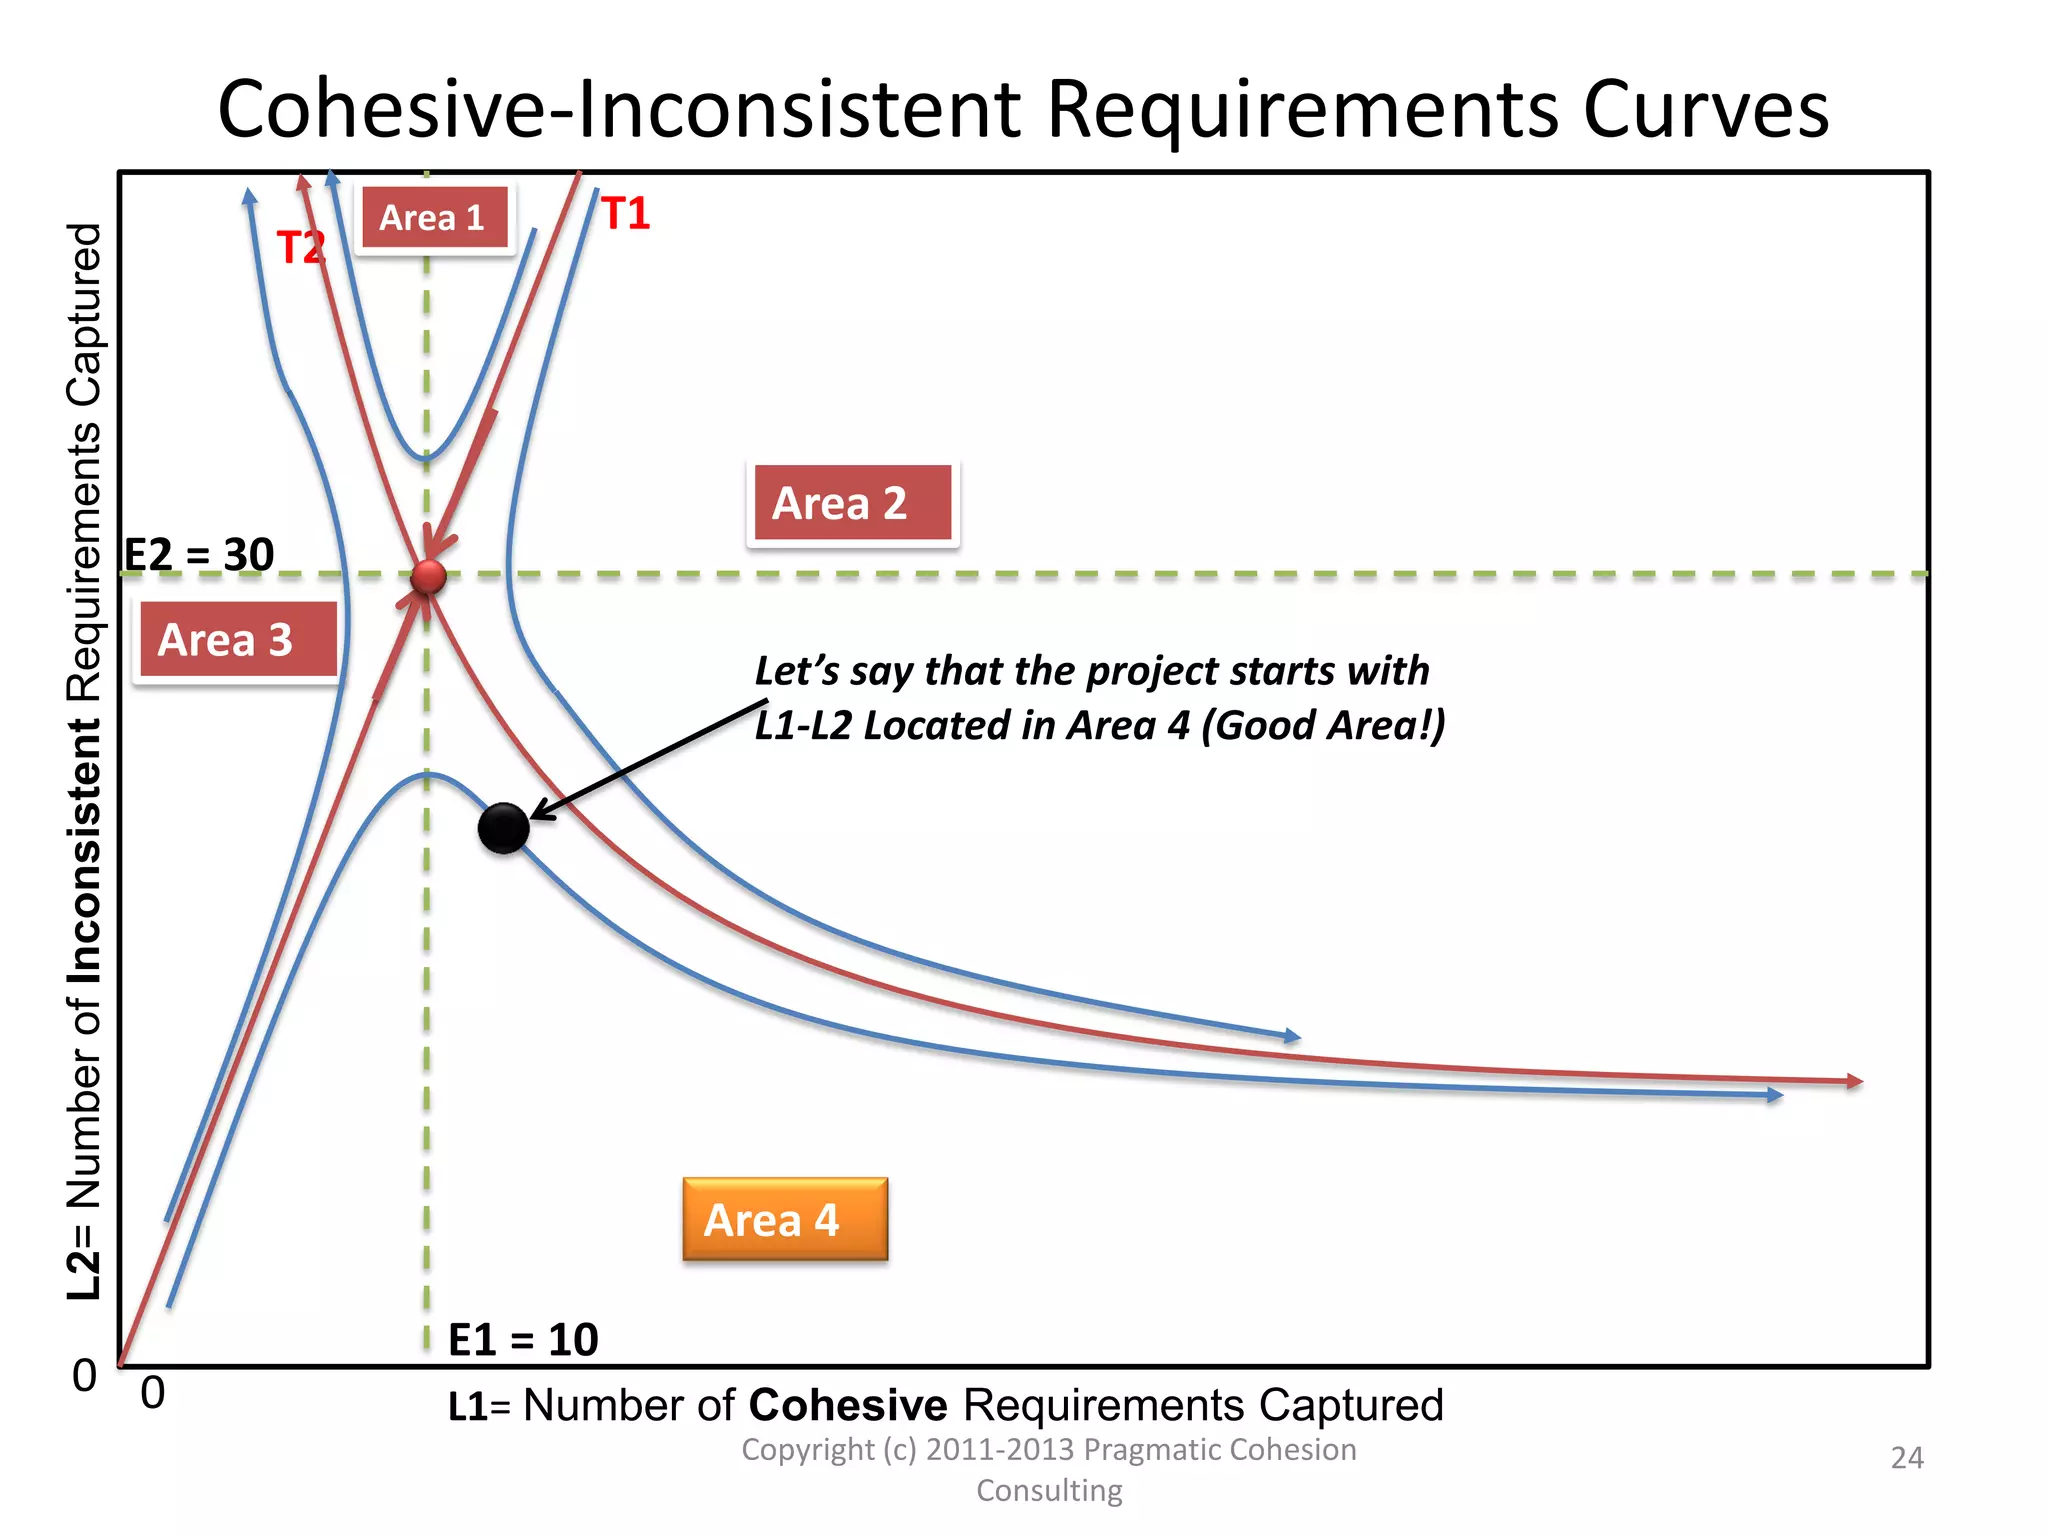
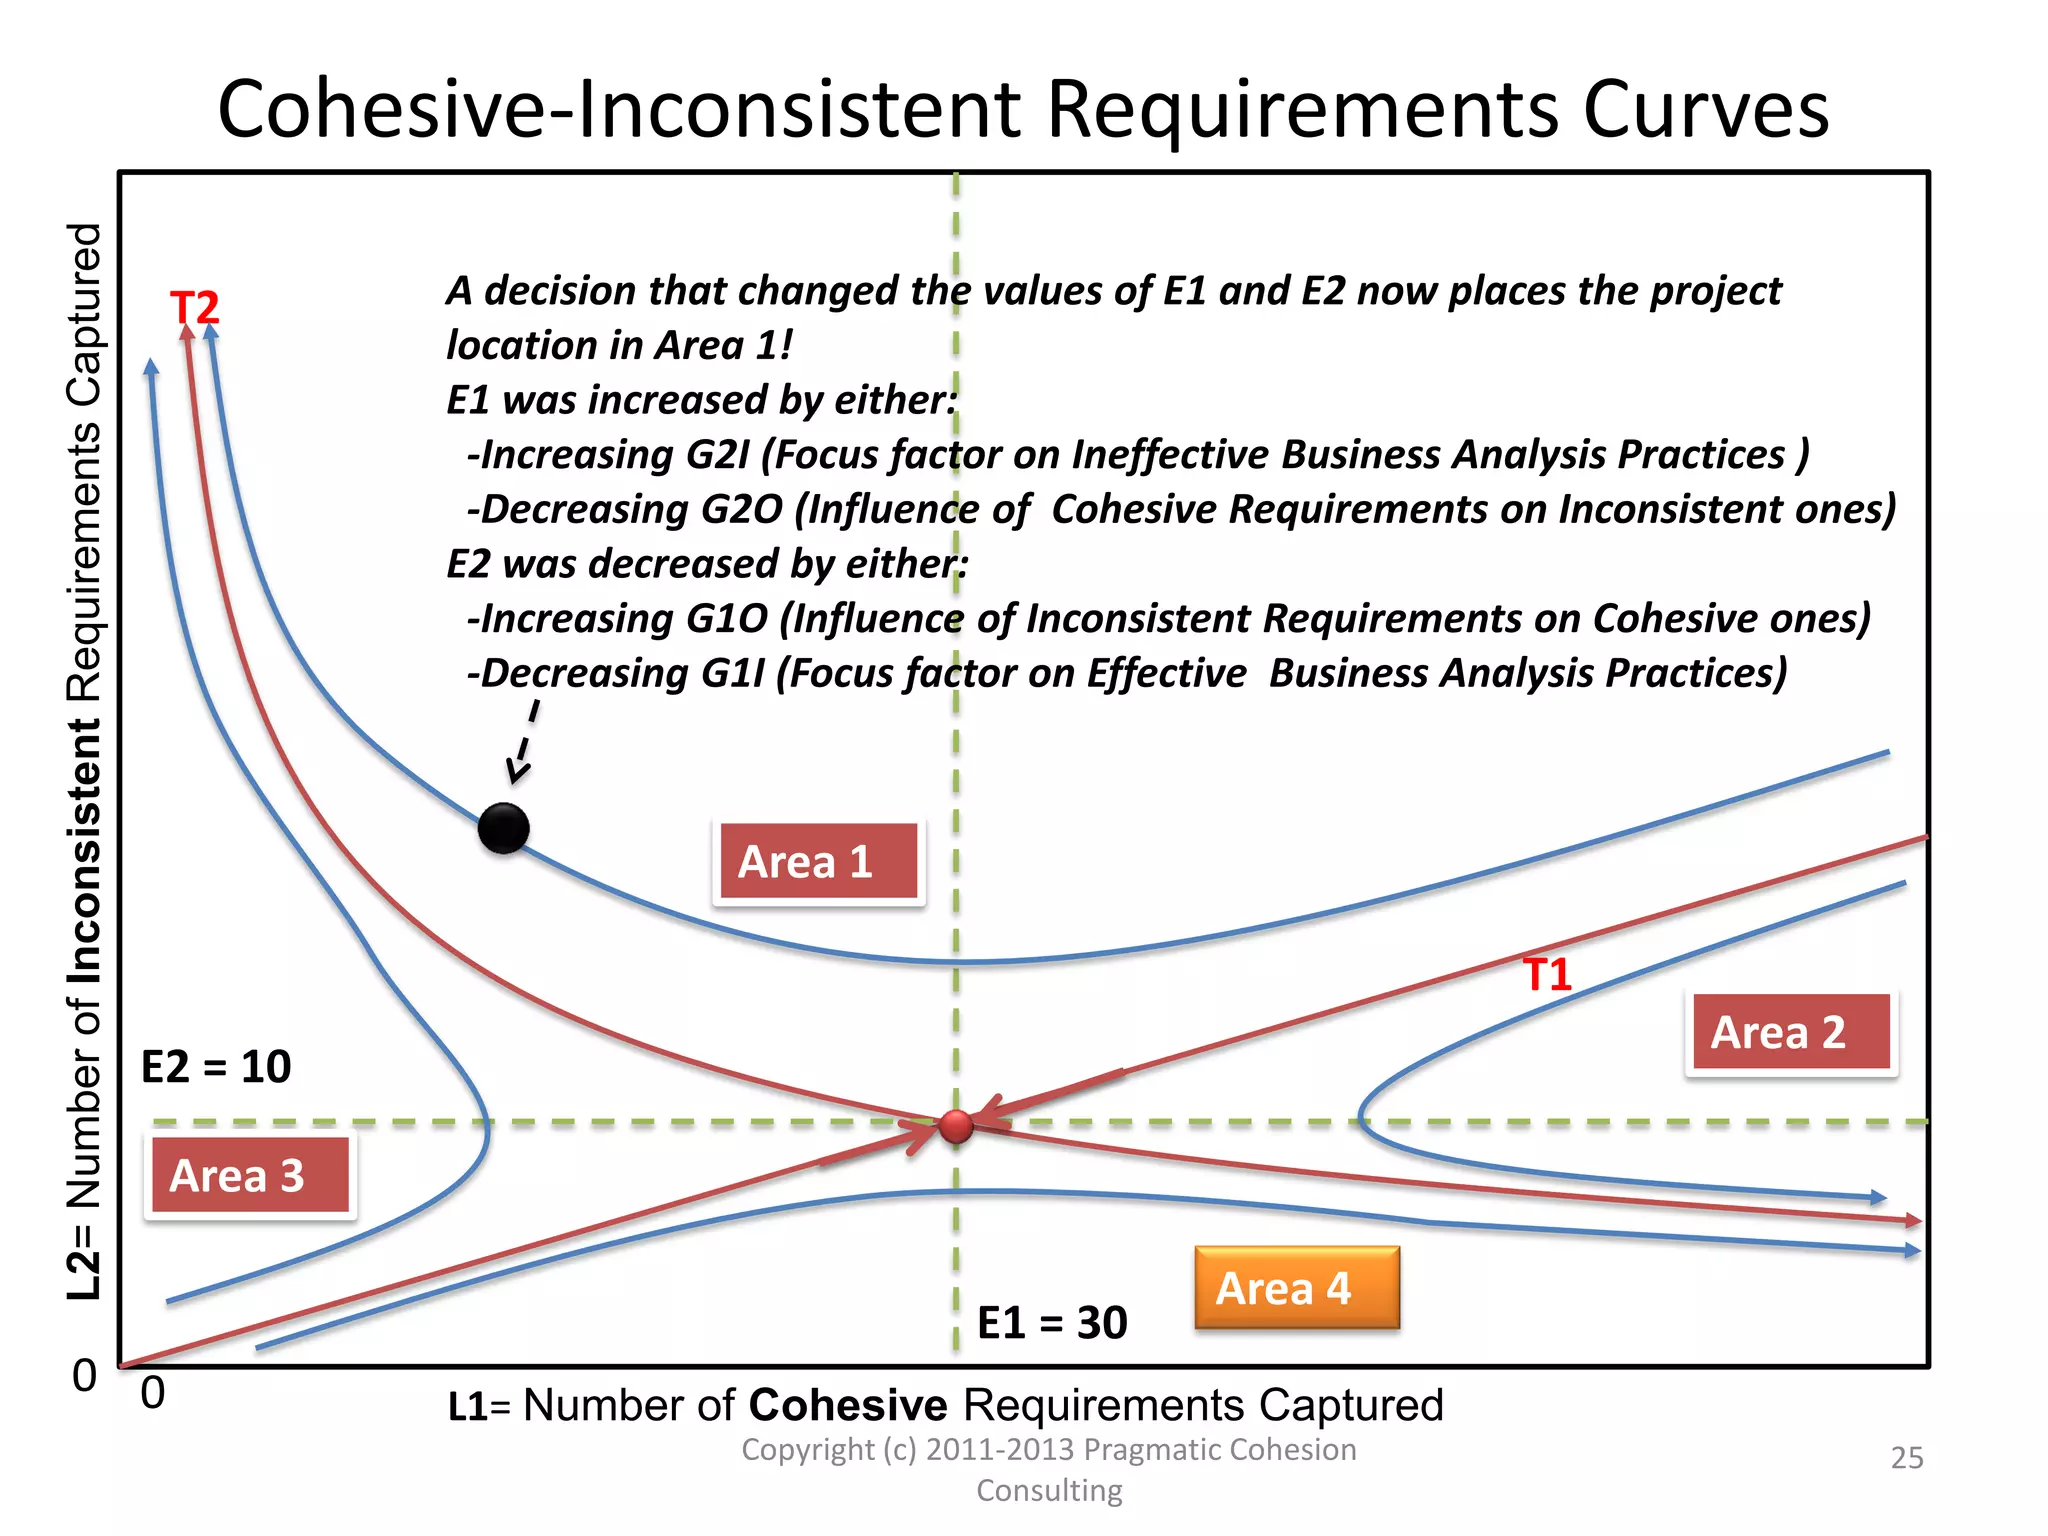
This presentation uses Systems Dynamics to demonstrate that project success can strongly depend on achieving a Critical Mass of properly understood and structured project Requirements that we refer to as Cohesive Requirements.
This presentation focuses on evaluating the Degree of Systemicity (and applicability) of the EBMM-TRIADS based on the novel Integrative Propositional Analysis (IPA).
The Interweave enriched Design Journey and Design ProcessAnders W. Tell
The Interweaving enriched Design Journey and Design Process. The Interweaving phase is a crucial step before implementation. Emphatic, Define, Ideate, Prototype, Test, Interweave, Implement.
Situation Normal Everything Must ChangeSimon Wardley
A very rough and extremely condensed summary of my three hour OSCON 2011 tutorial on business evolution, cloud, new forms of organisational patterns, tactics, and competition.
This presentation looks into 13 dimensions of 4 organizational cultures and compares them to highlight the potential challenges faced by a Business Analyst who has to transition from one culture type to the next.
Zen and The Art of Enterprise Architecture - The Dynamics of Transformation i...Alan Hakimi
A progressive point of view on how to perform business transformation with the disciplines of architecture, design, engineering, operations and human experiences.
This presentation provides some supporting evidence to facilitate the introduction and fostering of organizational roles responsible for Knowledge Engineering, Systems thinking, Systems Analysis, Systems Engineering and Business Analysis.
Practical DoD Architecture Framework (DoDAF) with InnoslateElizabeth Steiner
DoDAF expert, Steve Dams explains Practical DoDAF and how to implement it through Innoslate, a systems engineering and program management tool. The slides explain the need for many dimensions to completely describe the architecture, including (risk, decisions, data, systems, components, organizations, etc). Learn how Architecture forms the foundation of dynamic analysis.
This is an old slidedeck (March 2006) that I rediscovered the other day on my filesystem, but it still seems relevant in that, even at that early stage, it illustrates strong crosslinks between enterprise-architecture and systems-thinking - particularly service-oriented architectures, the 'tetradian' dimensions (here as machines, knowledge, people and business-purpose), and a somewhat-extended version of Stafford Beer's classic Viable Systems Model. It's also slightly unusual in that it cross-references to FEAF (US Federal Enterprise Architecture Framework) rather than TOGAF, as we'd found the latter to be unhelpful and misleading for that particular client. The client themselves were in the logistics industry - hence the pseudo-logo in the upper left of each slide.
It was a real presentation for a real client, presenting to other architects in our team some research I'd been doing, on how we could rethink our approach to enterprise-architecture as we started to break out of the classic IT-centric box. It's in a style I wouldn't use these days - way too many words! - and it's been somewhat 'de-identified' for reasons of commercial confidentiality, but otherwise it's exactly as presented to my colleagues at that client.
One minor note: the 'X/C/M/P' extensions to the Viable System Model, in slides 19, 20 and 28, relate to work we'd been doing at the time on integrating quality-system concerns - management of exceptions, corrective-action, issue-tracking and process-improvement - into both enterprise-architecture and the Viable System Model itself. I haven't seen any other reference to this type of integration, either before or since: it may be useful to quite a few people, on both the enterprise-architecture and systems-thinking sides of that discussion, and also to quality-system folks as well.
In short, yes, it's old, but it may still be useful for some folks in enterprise-architectures and elsewhere. Hope it helps, anyway.
Engineering review on AC circuit steady state analysis. Presentation lecture for energy engineering class.
Course MS in Renewable Energy Engineering, Oregon institute of technology
Practical DoDAF Presentation to International Council on Systems Engineering Washington Metro Area by Steven H. Dam Ph.D., ESEP, founder of SPEC Innovations
For more course tutorials visit
www.newtonhelp.com
FIN 515 Week 2 Project Financial Statement Analysis (Nike)
FIN 515 Week 3 Project Financial Statement Analysis (Nike)
FIN 515 Week 6 Project Calculating the Weighted Average Cost of Capital (Nike)
FIN 515 Perfect Education/newtonhelp.combellflower163
For more course tutorials visit
www.newtonhelp.com
FIN 515 Week 2 Project Financial Statement Analysis (Nike)
FIN 515 Week 3 Project Financial Statement Analysis (Nike)
FIN 515 Week 6 Project Calculating the Weighted Average Cost of Capital (Nike)
FIN 515 Become Exceptional/newtonhelp.combellflower142
For more course tutorials visit
www.newtonhelp.com
FIN 515 Week 2 Project Financial Statement Analysis (Nike)
FIN 515 Week 3 Project Financial Statement Analysis (Nike)
FIN 515 Week 6 Project Calculating the Weighted Average Cost of Capital (Nike)
FIN 515 Week 7 Project Capital Budgeting Analysis (Nike)
FIN 515 NERD Inspiring Innovation--fin515nerd.comshanaabe
FOR MORE CLASSES VISIT
www.fin515nerd.com
FIN 515 Week 2 Project Financial Statement Analysis (Nike)
FIN 515 Week 3 Project Financial Statement Analysis (Nike)
FIN 515 Week 6 Project Calculating the Weighted Average Cost of Capital (Nike)
FIN 515 Week 7 Project Capital Budgeting Analysis
Fin 515 Education Redefined - snaptutorial.comDavisMurphyC88
For more classes visit
www.snaptutorial.com
FIN 515 Week 2 Project Financial Statement Analysis (Nike)
FIN 515 Week 3 Project Financial Statement Analysis (Nike)
FIN 515 Week 6 Project Calculating the Weighted Average Cost of Capital (Nike)
FIN 515 NERD Education Counseling -- fin515nerd.comkopiko85
FOR MORE CLASSES VISIT
www.fin515nerd.com
FIN 515 Week 2 Project Financial Statement Analysis (Nike)
FIN 515 Week 3 Project Financial Statement Analysis (Nike)
FIN 515 Week 6 Project Calculating the Weighted Average Cost of Capital (Nike)
Fin 515 Education Organization / snaptutorial.comBaileya98
For more classes visit
www.snaptutorial.com
FIN 515 Week 2 Project Financial Statement Analysis (Nike)
FIN 515 Week 3 Project Financial Statement Analysis (Nike)
FIN 515 Week 6 Project Calculating the Weighted Average Cost of Capital (Nike)
FIN 515 NERD Education for Service--fin515nerd.commamata26
FOR MORE CLASSES VISIT
www.fin515nerd.com
FIN 515 Week 2 Project Financial Statement Analysis (Nike)
FIN 515 Week 3 Project Financial Statement Analysis (Nike)
FIN 515 Week 6 Project Calculating the Weighted Average Cost of
This presentation illustrates how to use Sparx Enterprise Architect Parametric Model features found in the Systems Engineering and Ultimate editions to simulate queuing systems.
This presentation stipulates that there is a defined ratio of Scope Creep above which Agile approaches lose their edge and become less efficient than methodologies that favor significant Upfront planning and freezing of total work to do.
We have derived a simple equation that can be used to more accurately estimate the time needed to implement a set of R software requirements given an average Defect ratio .
The equation results can also be used to adjust the development team work schedule, the number of developers, or the project number of software requirements.
This presentation describes a simple formula to estimate the average defect level (% of none met requirements) of a software product throughout its production cycles based on the probability of finding an unsuccessfully implemented requirements and the probability that this type of defect gets fixed.
The DSS presented in this document is a tool that improves the effectiveness of the decision making process that results in estimating, planning, and adapting: the products (software architecture, design specifications and code ), the activities (designing architecture, defining design specifications, and producing code) , and the measures of goodness (number of known requirements met, degree of resilience to new requirements, and degree of reusability) of the design and implementation phases of a Software Development Life Cycle.
This presentation explores the reasons why Project Stakeholders can have different perceptions of the same information and how BAs can promote effective listening skills that bridge reality gaps between stakeholders.
Insights into the benefits of adopting a business framework as the primary enabler of a software project such as the one advocated by the Microsoft Connected Health Framework
The benefits of phrasing Business Requirements in such a way that they only specify what is expected of a given system rather than how the system will be designed to meet its aim or mission.
Qualitative and Quantitative model used to rationally prescribe preferred degrees of involvement that Enterprise Stakeholders should have throughout the implementation of an Enterprise IT project
Communications Mining Series - Zero to Hero - Session 1DianaGray10
This session provides introduction to UiPath Communication Mining, importance and platform overview. You will acquire a good understand of the phases in Communication Mining as we go over the platform with you. Topics covered:
• Communication Mining Overview
• Why is it important?
• How can it help today’s business and the benefits
• Phases in Communication Mining
• Demo on Platform overview
• Q/A
The Art of the Pitch: WordPress Relationships and SalesLaura Byrne
Clients don’t know what they don’t know. What web solutions are right for them? How does WordPress come into the picture? How do you make sure you understand scope and timeline? What do you do if sometime changes?
All these questions and more will be explored as we talk about matching clients’ needs with what your agency offers without pulling teeth or pulling your hair out. Practical tips, and strategies for successful relationship building that leads to closing the deal.
Alt. GDG Cloud Southlake #33: Boule & Rebala: Effective AppSec in SDLC using ...James Anderson
Effective Application Security in Software Delivery lifecycle using Deployment Firewall and DBOM
The modern software delivery process (or the CI/CD process) includes many tools, distributed teams, open-source code, and cloud platforms. Constant focus on speed to release software to market, along with the traditional slow and manual security checks has caused gaps in continuous security as an important piece in the software supply chain. Today organizations feel more susceptible to external and internal cyber threats due to the vast attack surface in their applications supply chain and the lack of end-to-end governance and risk management.
The software team must secure its software delivery process to avoid vulnerability and security breaches. This needs to be achieved with existing tool chains and without extensive rework of the delivery processes. This talk will present strategies and techniques for providing visibility into the true risk of the existing vulnerabilities, preventing the introduction of security issues in the software, resolving vulnerabilities in production environments quickly, and capturing the deployment bill of materials (DBOM).
Speakers:
Bob Boule
Robert Boule is a technology enthusiast with PASSION for technology and making things work along with a knack for helping others understand how things work. He comes with around 20 years of solution engineering experience in application security, software continuous delivery, and SaaS platforms. He is known for his dynamic presentations in CI/CD and application security integrated in software delivery lifecycle.
Gopinath Rebala
Gopinath Rebala is the CTO of OpsMx, where he has overall responsibility for the machine learning and data processing architectures for Secure Software Delivery. Gopi also has a strong connection with our customers, leading design and architecture for strategic implementations. Gopi is a frequent speaker and well-known leader in continuous delivery and integrating security into software delivery.
Sudheer Mechineni, Head of Application Frameworks, Standard Chartered Bank
Discover how Standard Chartered Bank harnessed the power of Neo4j to transform complex data access challenges into a dynamic, scalable graph database solution. This keynote will cover their journey from initial adoption to deploying a fully automated, enterprise-grade causal cluster, highlighting key strategies for modelling organisational changes and ensuring robust disaster recovery. Learn how these innovations have not only enhanced Standard Chartered Bank’s data infrastructure but also positioned them as pioneers in the banking sector’s adoption of graph technology.
Goodbye Windows 11: Make Way for Nitrux Linux 3.5.0!SOFTTECHHUB
As the digital landscape continually evolves, operating systems play a critical role in shaping user experiences and productivity. The launch of Nitrux Linux 3.5.0 marks a significant milestone, offering a robust alternative to traditional systems such as Windows 11. This article delves into the essence of Nitrux Linux 3.5.0, exploring its unique features, advantages, and how it stands as a compelling choice for both casual users and tech enthusiasts.
Essentials of Automations: The Art of Triggers and Actions in FMESafe Software
In this second installment of our Essentials of Automations webinar series, we’ll explore the landscape of triggers and actions, guiding you through the nuances of authoring and adapting workspaces for seamless automations. Gain an understanding of the full spectrum of triggers and actions available in FME, empowering you to enhance your workspaces for efficient automation.
We’ll kick things off by showcasing the most commonly used event-based triggers, introducing you to various automation workflows like manual triggers, schedules, directory watchers, and more. Plus, see how these elements play out in real scenarios.
Whether you’re tweaking your current setup or building from the ground up, this session will arm you with the tools and insights needed to transform your FME usage into a powerhouse of productivity. Join us to discover effective strategies that simplify complex processes, enhancing your productivity and transforming your data management practices with FME. Let’s turn complexity into clarity and make your workspaces work wonders!
Maruthi Prithivirajan, Head of ASEAN & IN Solution Architecture, Neo4j
Get an inside look at the latest Neo4j innovations that enable relationship-driven intelligence at scale. Learn more about the newest cloud integrations and product enhancements that make Neo4j an essential choice for developers building apps with interconnected data and generative AI.
Observability Concepts EVERY Developer Should Know -- DeveloperWeek Europe.pdfPaige Cruz
Monitoring and observability aren’t traditionally found in software curriculums and many of us cobble this knowledge together from whatever vendor or ecosystem we were first introduced to and whatever is a part of your current company’s observability stack.
While the dev and ops silo continues to crumble….many organizations still relegate monitoring & observability as the purview of ops, infra and SRE teams. This is a mistake - achieving a highly observable system requires collaboration up and down the stack.
I, a former op, would like to extend an invitation to all application developers to join the observability party will share these foundational concepts to build on:
Enchancing adoption of Open Source Libraries. A case study on Albumentations.AIVladimir Iglovikov, Ph.D.
Presented by Vladimir Iglovikov:
- https://www.linkedin.com/in/iglovikov/
- https://x.com/viglovikov
- https://www.instagram.com/ternaus/
This presentation delves into the journey of Albumentations.ai, a highly successful open-source library for data augmentation.
Created out of a necessity for superior performance in Kaggle competitions, Albumentations has grown to become a widely used tool among data scientists and machine learning practitioners.
This case study covers various aspects, including:
People: The contributors and community that have supported Albumentations.
Metrics: The success indicators such as downloads, daily active users, GitHub stars, and financial contributions.
Challenges: The hurdles in monetizing open-source projects and measuring user engagement.
Development Practices: Best practices for creating, maintaining, and scaling open-source libraries, including code hygiene, CI/CD, and fast iteration.
Community Building: Strategies for making adoption easy, iterating quickly, and fostering a vibrant, engaged community.
Marketing: Both online and offline marketing tactics, focusing on real, impactful interactions and collaborations.
Mental Health: Maintaining balance and not feeling pressured by user demands.
Key insights include the importance of automation, making the adoption process seamless, and leveraging offline interactions for marketing. The presentation also emphasizes the need for continuous small improvements and building a friendly, inclusive community that contributes to the project's growth.
Vladimir Iglovikov brings his extensive experience as a Kaggle Grandmaster, ex-Staff ML Engineer at Lyft, sharing valuable lessons and practical advice for anyone looking to enhance the adoption of their open-source projects.
Explore more about Albumentations and join the community at:
GitHub: https://github.com/albumentations-team/albumentations
Website: https://albumentations.ai/
LinkedIn: https://www.linkedin.com/company/100504475
Twitter: https://x.com/albumentations
GridMate - End to end testing is a critical piece to ensure quality and avoid...ThomasParaiso2
End to end testing is a critical piece to ensure quality and avoid regressions. In this session, we share our journey building an E2E testing pipeline for GridMate components (LWC and Aura) using Cypress, JSForce, FakerJS…
Pushing the limits of ePRTC: 100ns holdover for 100 daysAdtran
At WSTS 2024, Alon Stern explored the topic of parametric holdover and explained how recent research findings can be implemented in real-world PNT networks to achieve 100 nanoseconds of accuracy for up to 100 days.
Dr. Sean Tan, Head of Data Science, Changi Airport Group
Discover how Changi Airport Group (CAG) leverages graph technologies and generative AI to revolutionize their search capabilities. This session delves into the unique search needs of CAG’s diverse passengers and customers, showcasing how graph data structures enhance the accuracy and relevance of AI-generated search results, mitigating the risk of “hallucinations” and improving the overall customer journey.
Unlocking Productivity: Leveraging the Potential of Copilot in Microsoft 365, a presentation by Christoforos Vlachos, Senior Solutions Manager – Modern Workplace, Uni Systems
Why You Should Replace Windows 11 with Nitrux Linux 3.5.0 for enhanced perfor...SOFTTECHHUB
The choice of an operating system plays a pivotal role in shaping our computing experience. For decades, Microsoft's Windows has dominated the market, offering a familiar and widely adopted platform for personal and professional use. However, as technological advancements continue to push the boundaries of innovation, alternative operating systems have emerged, challenging the status quo and offering users a fresh perspective on computing.
One such alternative that has garnered significant attention and acclaim is Nitrux Linux 3.5.0, a sleek, powerful, and user-friendly Linux distribution that promises to redefine the way we interact with our devices. With its focus on performance, security, and customization, Nitrux Linux presents a compelling case for those seeking to break free from the constraints of proprietary software and embrace the freedom and flexibility of open-source computing.
Why You Should Replace Windows 11 with Nitrux Linux 3.5.0 for enhanced perfor...
The dynamics of cohesive and inconsistent project requirements and how they influence project success
1. The Dynamics of Cohesive and Inconsistent Project
Requirements and how they influence Project Success
1Copyright (c) 2011-2015 Pragmatic Cohesion
Consulting; All Rights Reserved
Does your project have the needed Escape Velocity to succeed?
2. Introduction
• Peter M. Senge in his best selling book “The Fifth
Discipline” reminds us through the famous “Beer Game”
that Systemic Structures have of a profound impact on
the outcome of business endeavors.
• This presentation uses Systems Dynamics to
demonstrate that your project success can strongly
depend on achieving a Critical Mass of properly
understood and structured project Requirements that
we refer to as Cohesive Requirements.
2
Copyright (c) 2011-2015 Pragmatic Cohesion
Consulting; All Rights Reserved
3. Introduction
• This presentation qualifies Properly understood and
structured project Requirements as Cohesive . Refer
to the SlideShare presentation “Managing enterprise
stakeholders collaboration a qualitative and
quantitative rational approach” for an in depth
presentation of Cohesive Requirements.
• The opposite of Cohesive Requirements are
Inconsistent Requirements. In this presentation, we
call poorly understood and disorganized
Requirements Inconsistent Requirements.
3
Copyright (c) 2011-2015 Pragmatic Cohesion
Consulting; All Rights Reserved
4. Introduction
• We present a Systems Dynamics causal
model that uses the relationships
between the numbers of Cohesive and
Inconsistent Requirements found in a
Project to forecast its chances of
succeeding or failing.
4
Copyright (c) 2011-2015 Pragmatic Cohesion
Consulting; All Rights Reserved
5. The Causal Model
G1I: Focus factor on Effective
Business Analysis Practices
R1I: Proper Requirements
understanding and
structuring Rate
L1: Number of
Cohesive
Requirements
Captured
R1O: Requirements
Cohesion Disruption
Rate
G1O: Influence of Inconsistent
Requirements on Cohesive
ones
+
+
+
-
++
R2O: Requirements
Cohesion Correction
Rate
G2O: Influence of Cohesive
Requirements on Inconsistent
ones
+
+
R2I: Requirements
Inconsistency Creation
Rate
L2: Number of
Inconsistent
Requirements
Captured
-
+
++
+
G2I: Focus factor on Ineffective Business Analysis Practices
+
SECOND-ORDER POSITIVE FEEDBACK WITH FIRST-ORDER LOOPS
5
Copyright (c) 2011-2015 Pragmatic Cohesion
Consulting; All Rights Reserved
6. The Causal Model
• The number of Cohesive Requirements Captured (L1) is
increased by the Proper Requirements understanding and
structuring Rate (R1I).
• The number of Cohesive Requirements Captured (L1) is
decreased by the Requirements Cohesion Disruption Rate
(R1O).
• The number of Inconsistent Requirements Captured (L2) is
increased by the Requirements Inconsistency Creation Rate
(R2I)
• The number of Inconsistent Requirements Captured (L2) is
decreased by the Requirements Cohesion Correction Rate
(R2O)
Copyright (c) 2011-2015 Pragmatic Cohesion
Consulting; All Rights Reserved
6
7. The Causal Model
• The Proper Requirements understanding and structuring Rate
(R1I) is increased by the Focus factor on Effective Business
Analysis Practices (G1I)
• The Proper Requirements understanding and structuring Rate
(R1I) is increased by the Number of Cohesive Requirements
Captured (L1)
• The Requirements Inconsistency Creation Rate (R2I) is
increased by the Focus factor on Ineffective Business Analysis
Practices (G2I)
• The Requirements Inconsistency Creation Rate (R2I) is
increased by the Number of Inconsistent Requirements
Captured (L2)
Copyright (c) 2011-2015 Pragmatic Cohesion
Consulting; All Rights Reserved
7
8. The Causal Model
• The Requirements Cohesion Correction Rate (R2O) is
increased by the Number of Cohesive Requirements
Captured (L1)
• The Requirements Cohesion Correction Rate (R2O) is
increased by the Number of Inconsistent
Requirements Captured (L2)
• The Requirements Cohesion Correction Rate (R2O) is
increased by the Influence of Cohesive
Requirements on Inconsistent ones (G2O)
Copyright (c) 2011-2015 Pragmatic Cohesion
Consulting; All Rights Reserved
8
9. The Causal Model
• The Requirements Cohesion Disruption Rate (R1O) is
increased by the Number of Cohesive Requirements
Captured (L1)
• The Requirements Cohesion Disruption Rate (R1O) is
increased by the Number of Inconsistent
Requirements Captured (L2)
• The Requirements Cohesion Disruption Rate (R1O) is
increased by the Influence of Inconsistent
Requirements on Cohesive ones (G1O)
Copyright (c) 2011-2015 Pragmatic Cohesion
Consulting; All Rights Reserved
9
10. Equilibrium Points
• L1e = Number of Cohesive Requirements Captured at
equilibrium = E1 = G2I/G2O
• L2e = Number of Inconsistent Requirements Captured at
equilibrium = E2 = G1I/G1O
• E1 and E2 are critical thresholds values that influence the
dynamic behavior and long term outcome of the Project.
• E1 and E2 will determine if a Project has sufficient Cohesion
to succeed based on its current numbers of Cohesive (L1)
and Inconsistent (L2) Requirements.
• Note that the equilibrium point of each Type of Requirements
is dependent on the behavioral characteristics of the other
type of Requirements. This fact is a clear example of the
interdependency between Cohesive and Inconsistent
Requirements.
10
Copyright (c) 2011-2015 Pragmatic Cohesion
Consulting; All Rights Reserved
11. Counting Cohesive(L1) and Inconsistent(L2) Requirements
Example 1
Copyright (c) 2011-2015 Pragmatic
Cohesion Consulting; All Rights Reserved
11
L1 L2 G1I R1I G1O R1O G2I R2I G2O R2O
3 2 1 3x1=3 3/3/2=0
.5
3 1 2x1=2 2/3/2=0
.33
2
E1=G2I/G2O=1/0.33=3 E2=G1I/G1O=1/0.5=2
Blue = 3 initially cohesive requirements
Red = 2 initially inconsistent requirements
-Each cohesive requirement is
Disrupted by the inconsistent ones
-Each inconsistent requirement is
revealed by the cohesive one
-Each cohesive requirement will generate
another one since G1I = 1
-Each inconsistent requirement will generate
Another one since G2I = 1
12. Counting Cohesive(L1) and Inconsistent(L2) Requirements
Example 1
Copyright (c) 2011-2015 Pragmatic
Cohesion Consulting; All Rights Reserved
12
L1 L2 G1I R1I G1O R1O G2I R2I G2O R2O
3+3-3=3 2+2-2=2 1 3x1=3 3/3/2=0.5 3 1 2x1=2 2/3/2=0.33 2
E1=G2I/G2O=1/0.33=3 E2=G1I/G1O=1/0.5=2
2 new inconsistent requirements are generated
3 new cohesive requirements are generated
2 inconsistent requirements are removed
3 cohesive requirements are removed
13. Counting Cohesive(L1) and Inconsistent(L2) Requirements
Example 2
Copyright (c) 2011-2015 Pragmatic
Cohesion Consulting; All Rights Reserved
13
L1 L2 G1I R1I G1O R1O G2I R2I G2O R2O
3 2 1 3x1=3 2/3/2=0.33 2 1 2x1=2 2/3/2=0.33 2
E1=G2I/G2O=1/0.33=3 E2=G1I/G1O=1/.33=3
Blue = 3 initially cohesive requirements
Red = 2 initially inconsistent requirements
-Each cohesive requirement will generate
another one since G1I = 1
-Each inconsistent requirement will generate
Another one since G2I = 1
2 cohesive requirements are
disrupted by 2 inconsistent ones
2 inconsistent requirements are
revealed by 2 cohesive ones
14. Counting Cohesive(L1) and Inconsistent(L2) Requirements
Example 2
Copyright (c) 2011-2015 Pragmatic
Cohesion Consulting; All Rights Reserved
14
E1=G2I/G2O=1/0.33=3 E2=G1I/G1O=1/0.33=3
L1 L2 G1I R1I G1O R1O G2I R2I G2O R2O
3+3-2=4 2+2-2=2 1 4x1=4 2/3/2=.33 .33x4x2=2.66 1 2x1=
2
2/3/2=
0.33
.33x4x2
=2.66
2 inconsistent requirements are removed
2 cohesive requirements are removed
2 new inconsistent requirements are generated
3 new cohesive requirements are generated bringing their total count to 4
15. Counting Cohesive(L1) and Inconsistent(L2) Requirements
Example 3
Copyright (c) 2011-2015 Pragmatic
Cohesion Consulting; All Rights Reserved
15
L1 L2 G1I R1I G1O R1O G2I R2I G2O R2O
3 2 2 3x2=6 2/3/2=.
33
2 1 2x1=2 2/3/2=0
.33
2
E1=G2I/G2O=1/0.33=3 E2=G1I/G1O=2/.33=6
Blue = 3 initially cohesive requirements
Red = 2 initially inconsistent requirements
-Each cohesive requirement will generate
2 other ones since G1I = 2
-Each inconsistent requirement will generate
Another one since G2I = 1
2 cohesive requirements are
disrupted by 2 inconsistent ones
2 inconsistent requirements are
revealed by 2 cohesive ones
16. Counting Cohesive(L1) and Inconsistent(L2) Requirements
Example 3
Copyright (c) 2011-2015 Pragmatic
Cohesion Consulting; All Rights Reserved
16
E1=G2I/G2O=1/0.33=3 E2=G1I/G1O=2/0.33=6
L1 L2 G1I R1I G1O R1O G2I R2I G2O R2O
3+6-2=7 2+2-2=2 2 7x2=14 2/3/2=.
33
.33x7x2
=4.62
1 2x1=2 2/3/2=0
.33
.33x7x2
=4.62
2 inconsistent requirements are removed
2 cohesive requirements are removed
2 new inconsistent requirements are generated
6 new cohesive requirements are generated bringing their total count to 7
17. Counting Cohesive(L1) and Inconsistent(L2) Requirements
Example 3
Copyright (c) 2011-2015 Pragmatic
Cohesion Consulting; All Rights Reserved
17
E1=G2I/G2O=1/0.33=3 E2=G1I/G1O=2/0.33=6
L1 L2 G1I R1I G1O G2I R2I G2O
7+14-
4=17
2+2-4=0 2 2/3/2=.
33
1 2/3/2=0
.33
18. Cohesive-Inconsistent Requirements
Curves
• The dynamic behavior of our causal model is that of a
Second Order Positive Feedback loop with first order
Loops
• This type of causal model has been extensively studied. It
generates families of parametric curves along the L1 axis
(Number of Cohesive Requirements) and L2 axis (Number
of Inconsistent Requirements)
• The Project moves along one of the curves based only on
the initial values of L1 and L2 and the values of E1 and E2
• The following slide shows what these curves look like.
Copyright (c) 2011-2015 Pragmatic Cohesion
Consulting; All Rights Reserved
18
19. Cohesive-Inconsistent Requirements Curves
00
L1= Number of Cohesive Requirements Captured
L2=NumberofInconsistentRequirementsCaptured
E1
E2
Area 1
Area 2
Area 3
Area 4
T1
T2
19Copyright (c) 2011-2015 Pragmatic Cohesion
Consulting; All Rights Reserved
The type of curve followed by the project depends on
E1, E2, and the initial values of L1 and L2!
20. Cohesive-Inconsistent Requirements Curves
00
L1= Number of Cohesive Requirements Captured
L2=NumberofInconsistentRequirementsCaptured
E1 = 30
E2 = 10
Area 1
Area 2
Area 3
Area 4
T1
T2
20Copyright (c) 2011-2015 Pragmatic Cohesion
Consulting; All Rights Reserved
With E1=30 and E2=10, the curves are much more likely to
be in Area 1 or Area 3
21. 00
L1= Number of Cohesive Requirements Captured
L2=NumberofInconsistentRequirementsCaptured
E1 = 10
E2 = 30
Area 1
Area 2
Area 3
Area 4
T1
T2
21Copyright (c) 2011-2015 Pragmatic Cohesion
Consulting; All Rights Reserved
With E1=10 and E2=30, the curves are much more likely to
be in Area 2 or Area 4
Cohesive-Inconsistent Requirements Curves
22. 00
L1= Number of Cohesive Requirements Captured
L2=NumberofInconsistentRequirementsCaptured
E1 = 10
E2 = 30
Area 1
Area 2
Area 3
Area 4
T1
T2
22Copyright (c) 2011-2015 Pragmatic Cohesion
Consulting; All Rights Reserved
Let’s say that the project starts with
L1-L2 Located in Area 4 (Good Area!)
Cohesive-Inconsistent Requirements Curves
23. 00
L1= Number of Cohesive Requirements Captured
L2=NumberofInconsistentRequirementsCaptured
E1 = 30
E2 = 10
Area 1
Area 2
Area 3
Area 4
T1
T2
23Copyright (c) 2011-2015 Pragmatic Cohesion
Consulting; All Rights Reserved
A decision that changed the values of E1 and E2 now places the project
location in Area 1!
E1 was increased by either:
-Increasing G2I (Focus factor on Ineffective Business Analysis Practices )
-Decreasing G2O (Influence of Cohesive Requirements on Inconsistent ones)
E2 was decreased by either:
-Increasing G1O (Influence of Inconsistent Requirements on Cohesive ones)
-Decreasing G1I (Focus factor on Effective Business Analysis Practices)
Cohesive-Inconsistent Requirements Curves
24. 00
L1= Number of Cohesive Requirements Captured
L2=NumberofInconsistentRequirementsCaptured
E1 = 30
E2 = 10
Area 1
Area 2
Area 3
Area 4
T1
T2
24Copyright (c) 2011-2015 Pragmatic Cohesion
Consulting; All Rights Reserved
If E1 and E2 do not change for a while, the project location
remains in Area 1 but moves to this new location
Cohesive-Inconsistent Requirements Curves
25. 00
L1= Number of Cohesive Requirements Captured
L2=NumberofInconsistentRequirementsCaptured
E1 = 10
E2 = 30
Area 1
Area 2
Area 3
Area 4
T1
T2
25Copyright (c) 2011-2015 Pragmatic Cohesion
Consulting; All Rights Reserved
A decision brings E1 and E2 back to their previous values:
but the project location is no longer in Area 4 but in Area 3!
Unless E1 is further reduced to be less than the current L1
value, we cannot go back to Area 4.
E1 can be decreased by either:
-Decreasing G2I (Focus factor on Ineffective Business
Analysis Practices )
-Increasing G2O (Influence of Cohesive Requirements on
Inconsistent ones)
Cohesive-Inconsistent Requirements Curves
26. Number of Cohesive Requirements Equilibrium
Point Calculation
Variable Explanation
G2I: Focus
factor on
Ineffective
Business
Analysis
Practices
G2I is the focus factor on Ineffective Business Analysis Practices where the
current Inconsistencies in requirements are propagated thus further
creating more Inconsistent requirements.
So if we say that for every 10 Inconsistent requirements the project
typically comes up with an additional 6, then G2I = 6/10 =0.6
G2O:
Influence of
Cohesive
Requirements
on
Inconsistent
ones
G2O represents Cohesion restored to previously Inconsistent
requirements in proportion to the current number of Cohesive and
Inconsistent requirements.
If we say that 1 Inconsistent requirement gets corrected when we have 10
Cohesive requirements and 5 Inconsistent requirements, then G2O =
1/(10x5) = 0.02
E1 E1 is the number of Cohesive requirements at equilibrium.
E1 = G2I/G2O
Using our example E1 = 0.6/0.02 = 30 requirements
26
Copyright (c) 2011-2015 Pragmatic Cohesion
Consulting; All Rights Reserved
27. Number of Inconsistent Requirements
Equilibrium Point Calculation
Variable Explanation
G1I: Focus factor
on Effective
Business
Analysis
Practices
G1I is the focus factor on Effective Business Analysis Practices where
the current requirement Cohesion is propagated further thus creating
more Cohesive requirements.
So if we say that for every 10 Cohesive requirements we typically come
up with an additional 8, then G1I = 8/10 =0.8
G1O: Influence
of Inconsistent
Requirements
on Cohesive
ones
G1O represents Cohesion lost from previously Cohesive requirements
in proportion to the current number of Cohesive and Inconsistent
requirements.
If we say that 4 Cohesive requirements get affected when we have 10
Cohesive requirements and 5 Inconsistent requirements, then G1O =
4/(10x5) = 0.08
E2 E2 is the number of Inconsistent requirements at equilibrium.
E2 = G1I/G1O
Using our example E2 = 0.8/0.08 = 10 requirements
27
Copyright (c) 2011-2015 Pragmatic Cohesion
Consulting; All Rights Reserved
28. Project Curve Types
Area The initial number of Cohesive Requirements and the initial
number of Inconsistent Requirements are in Area 1
Area 1: There are a lot of
Inconsistent and
Cohesive requirements
at the same time but the
number of Inconsistent
requirements is above
the threshold line T1.
T1 joins (0,0) to (E1,E2)
-There are lots of requirements of both types resulting in a
steady decrease of the number of Cohesive and Inconsistent
Requirements. In this phase, both types of Requirements
initially undermine each other in a none productive way.
-When the number of Cohesive requirements drops below E1,
the number of Inconsistent requirements begins to increase
and continue to do so while less and less Cohesive
requirements exist due to the introduction of inconsistencies.
-With more and more Inconsistent requirements, the project
eventually falls to its doom by lacking enough Requirements
Cohesion.
28
Copyright (c) 2011-2015 Pragmatic Cohesion
Consulting; All Rights Reserved
29. Project Curve Types
Area The initial number of Cohesive Requirements and the initial
number of Inconsistent Requirements are in Area 2
Area 2: There are a lot of
Inconsistent and
Cohesive requirements
but the number of
Inconsistent
requirements is below
the threshold line T1.
T1 joins (0,0) to (E1,E2)
-There are lots of Cohesive and Inconsistent requirements
resulting in a steady decrease of the number of requirements
for both sides. In this phase, both types of requirements
initially undermine each other in a none productive way.
-When the number of Inconsistent requirements drops below
E2, the number of Cohesive requirements begins to increase
and continue to do so while more and more inconsistent
requirements get corrected.
-With more and more Cohesive requirements, the Project
prospers due to its increasing mass of Cohesive Requirements.
29
Copyright (c) 2011-2015 Pragmatic Cohesion
Consulting; All Rights Reserved
30. Project Curve Types
Area The initial number of Cohesive Requirements and the initial
number of Inconsistent Requirements are in Area 3
Area 3: Both Cohesive
and Inconsistent
requirements start in
small numbers but the
number of Inconsistent
requirements is above
the threshold line T1.
T1 joins (0,0) to (E1,E2)
-The number of Cohesive and Inconsistent requirements start
by increasing on both sides. In this phase, both types of
requirements increase but there is a steady slowing down of
the rate at which Cohesive requirements increase.
-When the number of Inconsistent requirements passes E2, the
number of Cohesive requirements begins to decrease and
continues to do so while more and more Inconsistent
requirements are created.
-With more and more Inconsistent requirements, the project
eventually falls to its doom by lacking enough Requirements
Cohesion.
30
Copyright (c) 2011-2015 Pragmatic Cohesion
Consulting; All Rights Reserved
31. Project Curve Types
Area The initial number of Cohesive Requirements and the initial
number of Inconsistent Requirements are in Area 4
Area 4: Both Cohesive
and Inconsistent
requirements start in
small numbers but the
number of Inconsistent
requirements is below
the threshold line T1.
T1 joins (0,0) to (E1,E2)
-The number of Cohesive and Inconsistent requirements start
by increasing on both sides. In this phase, both types of
requirements increase but there is a steady slowing down of
the rate at which Inconsistent requirements increase.
-When the number of Cohesive requirements passes E1, the
number of Inconsistent requirements begins to decrease and
continues to do so while more and more Cohesive
requirements are created.
-With more and more Cohesive requirements, the Project
prospers due to its increasing mass of Cohesive Requirements.
31
Copyright (c) 2011-2015 Pragmatic Cohesion
Consulting; All Rights Reserved
32. Project Curve Types
Area The initial number of Cohesive Requirements and the initial
number of Inconsistent Requirements are on T1
T1 joins (0,0) to (E1,E2): -The number of requirements for both types gradually moves
towards the point (E1,E2) and converges to it in the long run.
-The numbers of Inconsistent and Cohesive requirements reach
their equilibrium values and settle there.
32
Copyright (c) 2011-2015 Pragmatic Cohesion
Consulting; All Rights Reserved
33. Number of Cohesive Requirements Equilibrium Point (E1) Impact
Variable Impact
G2I: Focus factor on
Ineffective Business
Analysis Practices
-If you increase G2I you Increase E1
-If you increase E1 and you are in Area 1 you increase the
chances of Inconsistent Requirements to take over Cohesive
ones.
-If you increase E1 and you are in Area 4 you delay the point at
which Cohesive requirements takes over Inconsistent ones.
G2O: Influence of
Cohesive Requirements
on Inconsistent ones
-if you increase G2O you decrease E1
-If you decrease E1 and you are in Area 1 you decrease the
chances of Inconsistent requirements to take over Cohesive
ones.
-If you decrease E1 and you are in Area 4 you reach faster the
point at which Cohesive requirements take over Inconsistent
ones.
33
Copyright (c) 2011-2015 Pragmatic Cohesion
Consulting; All Rights Reserved
34. Number of Inconsistent Requirements Equilibrium Point (E2) Impact
Variable Impact
G1I: Focus factor on Effective Business
Analysis Practices
-If you increase G1I you Increase E2
-If you increase E2 and you are in Area 2 you
increase the chances of Cohesive requirements
to take over Inconsistent ones.
-If you increase E2 and you are in Area 3 you
delay the point at which Inconsistent
requirements take over Cohesive ones.
G1O: Influence of Inconsistent
Requirements on Cohesive ones
-if you increase G1O you decrease E2
-If you decrease E2 and you are in Area 2 you
decrease the chances of Cohesive requirements
to take over Inconsistent ones.
-If you decrease E2 and you are in Area 3 you
reach faster the point at which Inconsistent
requirements take over Cohesive ones.
34
Copyright (c) 2011-2015 Pragmatic Cohesion
Consulting; All Rights Reserved