SlideShare a Scribd company logo
1 of 18
Download to read offline
UNIT - 5
1) TEMPERATURE AND PRESSURE EFFECTS :-
The reaction temperature and pressure also influence the progress of reactions, and it is the role of these
variables that we now consider. So far we were only dealing with isothermal reactors, temperature was not
changing. Hence there was no need to write energy balance for those reactors.
In non-isothermal reactors, the temperature is not constant and hence along with material balance
equations, energy balance equation is also required.
These non-isothermal reactors are ideal reactors and therefore the design equations developed in the previous
chapters are valid here.
✓ In batch reactors, the temperature changes with time.
✓ In PFR the temperature changes along the length of the reactor with increase in conversion.
✓ In MFR, there is sudden change in temperature just like sudden change in conversion and concentration.
The entire MFR is at the same temperature. However, this temperature is different from the inlet
temperature.
➢ How to study effect of temperature and pressure effects :-
A three-step procedure is used -
First, we must find how
a) Equilibrium composition b) rate of reaction, and c) product distribution
are affected by changes in operating temperatures and pressures.
This will allow us to determine the optimum temperature progression, and it is this that we strive to
approximate with a real design.
Second, chemical reactions are usually accompanied by heat effects, and we must know how these will
change the temperature of the reacting mixture. With this information we are able to propose a number of
favorable reactor and heat exchange systems-those which closely approach the optimum.
Finally, economic considerations will select one of these favorable systems as the best.
➢ Temperature and Pressure effects on Single Reactions :-
With single reactions, we are concerned with – “conversion level and reactor stability” only as the
questions of product distribution do not occur.
Thermodynamics gives two important pieces of information, the first being the heat liberated or absorbed for
a given extent of reaction, the second being the maximum possible conversion.
The “Heat of reaction” at temperature T as the heat transferred to the reacting system from the surroundings
when “a” moles of A disappear to produce “r” moles of R and “s” moles of S with the system measured at the
same temperature and pressure before and after the change. Thus-
Knowing the heat of reaction at any one temperature as well as the specific heats of reactants and
products in the temperature range concerned allows us to calculate the heat of reaction at any other
temperature. From this the heat effects of the reaction can be found.
➢ REVERSIBLE REACTION :-
✓ Equilibrium Constants from Thermodynamics:-
a) A reversible reaction can proceed in both the forward and backward directions.
b) Equilibrium is when the rate of the forward reaction equals the rate of the reverse reaction. All
reactant and product concentrations are constant at equilibrium.
c) Given a reaction, 𝑎𝐴 + 𝑏𝐵 → 𝑐𝐶 + 𝑑𝐷, the equilibrium constant (KC ), also called K or Keq, is
defined as follows:
Example
Part 1: Calculating from equilibrium concentrations
Let's take a look at the equilibrium reaction that takes place between sulfur dioxide and oxygen to
produce sulfur trioxide:
The reaction is at equilibrium at some temperature, T, and the following equilibrium concentrations
are measured:
We can calculate for the reaction at temperature by solving following expression in which if we
plug our known equilibrium concentrations into the above equation, we get:
Note that since the calculated value is between 0.001 and 1000, we would expect this reaction to
have significant concentrations of both reactants and products at equilibrium, as opposed to having
mostly reactants or mostly products.
✓ Equilibrium Conversion:-
The equilibrium composition, as governed by the equilibrium constant, changes with temperature, and
from thermodynamics the rate of change is given by –
On integrating above Eq., we see how the equilibrium constant changes with temperature. When the
heat of reaction ∆Hr, can be considered to be constant in the temperature interval, integration yields –
These expressions allow us to find the variation of the equilibrium constant, hence, equilibrium
conversion, with temperature. The following conclusions may be drawn from thermodynamics –
a) The thermodynamic equilibrium constant is unaffected by the pressure of the system, by the presence or
absence of inerts, or by the kinetics of the reaction, but is affected by the temperature of the system.
b) Though the thermodynamic equilibrium constant is unaffected by pressure or inerts, the equilibrium
concentration of materials and equilibrium conversion of reactants can be influenced by these variables
c) K > 1 indicates that practically complete conversion may be possible and that the reaction can be
considered to be irreversible. K < 1 indicates that reaction will not proceed to any appreciable extent.
d) For an increase in temperature, equilibrium conversion rises for endothermic reactions and drops for
exothermic reactions.
e) For an increase in pressure in gas reactions, conversion rises when the number of moles decreases with
reaction; conversion drops when the number of moles increases with reaction.
f) A decrease in inert for all reactions acts in the way that an increase in pressure acts for gas reactions.
Above conclusions are illustrated in part by Fig. below -
Effect of temperature on equilibrium conversion as predicted by thermodynamics (pressure
fixed.)
✓ General Graphical Design Procedure:-
1) Temperature, composition, and reaction rate are uniquely related for any single homogeneous reaction,
and this may be represented graphically in one of three ways, as shown in Fig. 9.2.
2) The first of these, the composition-temperature plot, is the most convenient so we will use it throughout to
represent data, to calculate reactor sizes, and to compare design alternatives.
3) For a given feed (fixed CA0, CB0 , . . .) and using conversion of key component as a measure of the
composition and extent of reaction, the XA versus T plot has the general shape shown in Fig. 9.3.
4) This plot can be prepared either from a thermodynamically consistent rate expression for the reaction (the
rate must be zero at equilibrium) or by interpolating from a given set of kinetic data in conjunction with
thermodynamic information on the equilibrium.
5) Naturally, the reliability of all the calculations and predictions that follow are directly dependent on the
accuracy of this chart. Hence, it is imperative to obtain good kinetic data to construct this chart.
The size of reactor required for a given duty and for a given temperature progression is found as follows:
a) Draw the reaction path on the XA versus T plot. This is the operating line for the operation.
b) Find the rates at various XA along this path.
c) Plot the l/(-rA) versus XA curve for this path.
d) Find the area under this curve. This gives V/FAo
For exothermic reactions we illustrate this procedure in Fig. 9.4 for three paths:
a) path AB for plug flow with an arbitrary temperature profile
b) path CD for non-isothermal plug flow with 50% recycle, and
c) point E for mixed flow.
Note: - For mixed flow the operating line reduces to a single point.
This procedure is quite general, applicable for any kinetics, any temperature progression, and any
reactor type or any series of reactors. So, once the operating line is known. The reactor size can be
found.
From these values the X, versus T chart for any specific CA0 can be prepared and for this purpose the
electronic computer is a great timesaver. Figure E9.3 is such a plot prepared for CA0 = 1 mol/liter and CRo
= 0.
Since we are dealing with first-order reactions this plot can be used for any CA0 value by properly
relabeling the rate curves. Thus, for CA0 = 10 mol/liter simply multiply all the rate values on this graph by
a factor of 10.
2) OPTIMUM TEMPERATURE PROGRESSION :-
1. Optimum temperature progression means the temperature profile that we want to maintain inside the
reactor to minimize the reactor volume. In simple words, it is defined to be that progression which
minimizes V/FAO, for a given conversion of reactant.
2. This optimum temperature progression may be an isothermal or it may be a changing temperature.
3. Different reactor have different ways for being isothermal or varying temperature i.e. -
✓ wrt time for a batch reactor
✓ along the length of a plug flow reactor, or
✓ From stage to stage for a series of mixed flow reactors.
4. It is important to know this progression because it is the ideal which we try to approach with a real
system. It also allows us to estimate how far any real system departs from this idea.
5. The optimum temperature progression in any type of reactor is as follows:
“At any composition, it will always be at the temperature where the rate is a maximum. The locus of
maximum rates is found by examining the r (T, C) curves as shown in the Figure that shows this
progression.”
Figure - Operating lines for minimum reactor size.
6. For irreversible reactions whether endothermic or exothermic, the rate constant increases with
temperature and hence the rate also increases. So for these reactions the reactor should be maintained
at maximum possible constant temperature. This maximum temperature is decided by the material of
construction.
7. For reversible reactions, there are two factors. Rate and equilibrium conversion.
8. For reversible endothermic reactions, with increase in temperature the forward rate increases and
equilibrium conversion also increases. Hence these reactions should be carried out at maximum
possible constant temperature.
9. For reversible exothermic reactions, with increase in temperature equilibrium conversion decreases
and therefore we should use decreasing temperature profile.
10. An optimal temperature progression enhances overall energy efficiency by minimizing energy input
while achieving the desired reaction outcomes.
➢ Heat Effects:-
When the heat absorbed or released by reaction can markedly change the temperature of the reacting
fluid, this factor must be accounted for in design. Thus we need to use the material and energy
balance expressions, rather than the material balance alone, which was the starting point of all the
analyses of isothermal operations of earlier study.
✓ First of all, if the reaction is exothermic and if heat transfer is unable to remove all of the liberated heat,
then the temperature of the reacting fluid will rise as conversion rises.
✓ By similar arguments, for endothermic reactions the fluid cools as conversion rises. Let us relate this
temperature change with extent of conversion.
➢ Adiabatic Operations:-
Consider a mixed flow reactor, a plug flow reactor, or a section of plug flow reactor, in which the
conversion is XA as shown in Fig. 9.6. In earlier study one component, usually the limiting reactant
was selected as the basis for all material balance calculations. The same procedure is used here, with
limiting reactant A taken as the basis.
Let Subscripts 1, 2 refer to temperatures of entering and leaving streams.
With T1 as the reference temperature on which enthalpies and heats of reaction are based we have
Enthalpy of entering feed:
The latter form of the equation simply states that the heat released by reaction just balances the heat
necessary to raise the reactants from T1 to T2. The relation between temperature and conversion, as
given by the energy balances of above Eq. 21 or 22, is shown in Fig. 9.7. The resulting lines are
straight for all practical purposes since the variation of the denominator term of this equation is
relatively small.
When Cp” – Cp’ = 0, the heat of reaction is independent of temperature and Eqs. 21 and 22 reduce to
which are straight lines in Fig. 9.7.
1. This figure illustrates the shape of the energy balance curve for both endothermic and exothermic
reactions for both mixed flow and plug flow reactors.
2. This representation shows that whatever is the conversion at any point in the reactor, the temperature is at
its corresponding value on the curve.
3. For plug flow the fluid in the reactor moves progressively along the curve, for mixed flow the fluid
immediately jumps to its final value on the curve. These are the “adiabatic operating lines” for the
reactor.
4. With increased inerts Cp rises, and these curves become more closely vertical. A vertical line indicates
that temperature is unchanged as reaction proceeds. This then is the special case of isothermal reactions
treated in earlier study.
5. The size of reactor needed for a given duty is found as follows. For plug flow tabulate the rate for various
XA along this adiabatic operating line, prepare the “l / (-rA)” versus XA plot and integrate. For mixed
flow simply use the rate at the conditions within the reactor. Figure 9.8 illustrates this procedure.
6. The best adiabatic operations of a single plug flow reactor are found by shifting the operating line
(changing the inlet temperature) to where the rates have the highest mean value.
7. For endothermic operations this means starting at the highest allowable temperature. For exothermic
reactions this means straddling the locus of maximum rates as shown in Fig. 9.9. A few trials will locate
the best inlet temperature, that which minimizes V/FAO . For mixed flow the reactor should operate on the
locus of maximum rates, again shown in Fig. 9.9.
8. The best reactor type, that which minimizes V/FAO is found directly from this XA, versus T graph.
a) If the rate progressively decreases with conversion, then use plug flow. This is the case for
endothermic reactions (Fig. 9.8 a) and close to isothermal exothermic reactions.
b) For exothermic reactions that have a large temperature rise during reaction, the rate rises from a very
low value to a maximum at some intermediate XA, then falls. This behavior is characteristic of
autocatalytic reactions, thus recycle operations are best.
9. Figure 9.10 illustrates two situations, one where plug flow is best, the other where large recycle or mixed
flow is best. The slope of the operating line, Cp/-∆Hr , will determine which case one has at hand. Thus –
a) For small Cp/-∆Hr, (pure gaseous reactants) mixed flow is best.
b) For large Cp/-∆Hr, (gas with much inerts, or liquid systems) plug flow is best.
➢ Non-adiabatic Operations:-
For the adiabatic operating line of Fig. 9.7 to more closely approach the ideals of Fig. 9.5, we may want
deliberately to introduce or remove heat from the reactor. In addition, there are heat losses to the
surroundings to account for.
Let us see how these forms of heat interchange modify the shape of the adiabatic operating line. Let Q be
the total heat added to a reactor per mole of entering reactant A, and let this heat also include the losses to
the surroundings. Then Eq. 20, the energy balance about the system, is modified to-
With heat input proportional to ∆T = T2 – T2 the energy balance line rotates about T2. This change is shown in
Fig. 9.11. Other modes of heat addition or removal yield corresponding shifts in the energy balance line.
Using this modified operating line, the procedure for finding the reactor size and optimum operations follows
directly from the discussion on adiabatic operations.
Comments and Extensions:-
1. Adiabatic operations of an exothermic reaction give a rising temperature with conversion. However,
the desired progression is one of falling temperature. Thus, very drastic heat removal may be needed to
make the operating line approach the ideal, and many schemes may be proposed to do this.
a) As an example, we may have heat exchange with the incoming fluid (see Fig. 9.12a), a case treated
by van Heerden (1953, 1958).
Figure 9.12: Ways of approaching the ideal temperature profile with heat exchange: (a) and (b)
exothermic reaction
b) Another alternative is to have multistage operations with inter-stage cooling between adiabatic
sections (see Fig. 9.12b). In general multi-staging is used when it is impractical to affect the
necessary heat exchange within the reactor itself. This is usually the case with gas-phase reactions
with their relatively poor heat transfer characteristics.
2. For endothermic reactions, multi-staging with reheat between stages is commonly used to keep the
temperature from dropping too low (see Fig. 9.12 c). The main use of these and many other forms of
multistage operations is with solid catalyzed gas-phase reactions.
Figure 9.12 : Ways of approaching the ideal temperature profile with heat exchange: (c)
endothermic reaction.
EXOTHERMIC REACTIONS IN MIXED FLOW REACTORS - A Special Problem
TEMPERATURE AND PRESSURE EFFECTS ON CHEMIOCAL RESCTION

More Related Content

Similar to TEMPERATURE AND PRESSURE EFFECTS ON CHEMIOCAL RESCTION

Thermodynamics and kinetics
Thermodynamics and kineticsThermodynamics and kinetics
Thermodynamics and kineticsShelbyRocks
 
btd module 1.pptx basic thermodynamics ..
btd module 1.pptx basic thermodynamics ..btd module 1.pptx basic thermodynamics ..
btd module 1.pptx basic thermodynamics ..PradeepKumarb24
 
Thermo analytical methods by srk
Thermo analytical methods by srkThermo analytical methods by srk
Thermo analytical methods by srkVaishnavi Patil
 
ENGINEERING THERMODYNAMICS-UNIT 1
ENGINEERING THERMODYNAMICS-UNIT 1ENGINEERING THERMODYNAMICS-UNIT 1
ENGINEERING THERMODYNAMICS-UNIT 1prakash0712
 
Application of Thermodynamics
Application of ThermodynamicsApplication of Thermodynamics
Application of ThermodynamicsGOBINATHS18
 
Application of microcalorimeter in stability study
Application of microcalorimeter in stability studyApplication of microcalorimeter in stability study
Application of microcalorimeter in stability studyPrashant Patel
 
Thermodynamics - Differentials, Maxwell, Joule-Thomson.pptx
Thermodynamics - Differentials, Maxwell, Joule-Thomson.pptxThermodynamics - Differentials, Maxwell, Joule-Thomson.pptx
Thermodynamics - Differentials, Maxwell, Joule-Thomson.pptxmoderatelyintriguing
 
247447699 reactors
247447699 reactors247447699 reactors
247447699 reactorsmanojg1990
 
thermogravimetric analysis
thermogravimetric analysisthermogravimetric analysis
thermogravimetric analysisDalpat Singh
 
NORTHEASTERN UNIVERSITY DEPARTMENT OF MECHANICAL ENGINEERI.docx
NORTHEASTERN UNIVERSITY DEPARTMENT OF MECHANICAL ENGINEERI.docxNORTHEASTERN UNIVERSITY DEPARTMENT OF MECHANICAL ENGINEERI.docx
NORTHEASTERN UNIVERSITY DEPARTMENT OF MECHANICAL ENGINEERI.docxcurwenmichaela
 
Thermodynamics_Chapter4.pptx
Thermodynamics_Chapter4.pptxThermodynamics_Chapter4.pptx
Thermodynamics_Chapter4.pptxchaturvedijay62
 
Ch 3 energy transfer by work, heat and mass
Ch 3 energy transfer by work, heat and massCh 3 energy transfer by work, heat and mass
Ch 3 energy transfer by work, heat and massabfisho
 

Similar to TEMPERATURE AND PRESSURE EFFECTS ON CHEMIOCAL RESCTION (20)

Thermodynamics and kinetics
Thermodynamics and kineticsThermodynamics and kinetics
Thermodynamics and kinetics
 
Studies
StudiesStudies
Studies
 
CH 3.pptx
CH 3.pptxCH 3.pptx
CH 3.pptx
 
Lab4_HeatExchange
Lab4_HeatExchangeLab4_HeatExchange
Lab4_HeatExchange
 
Cre ppt saud
Cre ppt saudCre ppt saud
Cre ppt saud
 
Ew35859862
Ew35859862Ew35859862
Ew35859862
 
btd module 1.pptx basic thermodynamics ..
btd module 1.pptx basic thermodynamics ..btd module 1.pptx basic thermodynamics ..
btd module 1.pptx basic thermodynamics ..
 
Thermo analytical methods by srk
Thermo analytical methods by srkThermo analytical methods by srk
Thermo analytical methods by srk
 
ENGINEERING THERMODYNAMICS-UNIT 1
ENGINEERING THERMODYNAMICS-UNIT 1ENGINEERING THERMODYNAMICS-UNIT 1
ENGINEERING THERMODYNAMICS-UNIT 1
 
Application of Thermodynamics
Application of ThermodynamicsApplication of Thermodynamics
Application of Thermodynamics
 
Application of microcalorimeter in stability study
Application of microcalorimeter in stability studyApplication of microcalorimeter in stability study
Application of microcalorimeter in stability study
 
Thermodynamics - Differentials, Maxwell, Joule-Thomson.pptx
Thermodynamics - Differentials, Maxwell, Joule-Thomson.pptxThermodynamics - Differentials, Maxwell, Joule-Thomson.pptx
Thermodynamics - Differentials, Maxwell, Joule-Thomson.pptx
 
Reactors
ReactorsReactors
Reactors
 
247447699 reactors
247447699 reactors247447699 reactors
247447699 reactors
 
THE CARNOT THEOREM Shivani rajput BSC I 2018
THE CARNOT THEOREM Shivani rajput BSC I 2018THE CARNOT THEOREM Shivani rajput BSC I 2018
THE CARNOT THEOREM Shivani rajput BSC I 2018
 
thermogravimetric analysis
thermogravimetric analysisthermogravimetric analysis
thermogravimetric analysis
 
Rea 2.ppt
Rea 2.pptRea 2.ppt
Rea 2.ppt
 
NORTHEASTERN UNIVERSITY DEPARTMENT OF MECHANICAL ENGINEERI.docx
NORTHEASTERN UNIVERSITY DEPARTMENT OF MECHANICAL ENGINEERI.docxNORTHEASTERN UNIVERSITY DEPARTMENT OF MECHANICAL ENGINEERI.docx
NORTHEASTERN UNIVERSITY DEPARTMENT OF MECHANICAL ENGINEERI.docx
 
Thermodynamics_Chapter4.pptx
Thermodynamics_Chapter4.pptxThermodynamics_Chapter4.pptx
Thermodynamics_Chapter4.pptx
 
Ch 3 energy transfer by work, heat and mass
Ch 3 energy transfer by work, heat and massCh 3 energy transfer by work, heat and mass
Ch 3 energy transfer by work, heat and mass
 

Recently uploaded

VIP Call Girls Service Kondapur Hyderabad Call +91-8250192130
VIP Call Girls Service Kondapur Hyderabad Call +91-8250192130VIP Call Girls Service Kondapur Hyderabad Call +91-8250192130
VIP Call Girls Service Kondapur Hyderabad Call +91-8250192130Suhani Kapoor
 
MANUFACTURING PROCESS-II UNIT-2 LATHE MACHINE
MANUFACTURING PROCESS-II UNIT-2 LATHE MACHINEMANUFACTURING PROCESS-II UNIT-2 LATHE MACHINE
MANUFACTURING PROCESS-II UNIT-2 LATHE MACHINESIVASHANKAR N
 
Coefficient of Thermal Expansion and their Importance.pptx
Coefficient of Thermal Expansion and their Importance.pptxCoefficient of Thermal Expansion and their Importance.pptx
Coefficient of Thermal Expansion and their Importance.pptxAsutosh Ranjan
 
The Most Attractive Pune Call Girls Manchar 8250192130 Will You Miss This Cha...
The Most Attractive Pune Call Girls Manchar 8250192130 Will You Miss This Cha...The Most Attractive Pune Call Girls Manchar 8250192130 Will You Miss This Cha...
The Most Attractive Pune Call Girls Manchar 8250192130 Will You Miss This Cha...ranjana rawat
 
Introduction to Multiple Access Protocol.pptx
Introduction to Multiple Access Protocol.pptxIntroduction to Multiple Access Protocol.pptx
Introduction to Multiple Access Protocol.pptxupamatechverse
 
(SHREYA) Chakan Call Girls Just Call 7001035870 [ Cash on Delivery ] Pune Esc...
(SHREYA) Chakan Call Girls Just Call 7001035870 [ Cash on Delivery ] Pune Esc...(SHREYA) Chakan Call Girls Just Call 7001035870 [ Cash on Delivery ] Pune Esc...
(SHREYA) Chakan Call Girls Just Call 7001035870 [ Cash on Delivery ] Pune Esc...ranjana rawat
 
UNIT-II FMM-Flow Through Circular Conduits
UNIT-II FMM-Flow Through Circular ConduitsUNIT-II FMM-Flow Through Circular Conduits
UNIT-II FMM-Flow Through Circular Conduitsrknatarajan
 
Java Programming :Event Handling(Types of Events)
Java Programming :Event Handling(Types of Events)Java Programming :Event Handling(Types of Events)
Java Programming :Event Handling(Types of Events)simmis5
 
Call for Papers - Educational Administration: Theory and Practice, E-ISSN: 21...
Call for Papers - Educational Administration: Theory and Practice, E-ISSN: 21...Call for Papers - Educational Administration: Theory and Practice, E-ISSN: 21...
Call for Papers - Educational Administration: Theory and Practice, E-ISSN: 21...Christo Ananth
 
High Profile Call Girls Nagpur Meera Call 7001035870 Meet With Nagpur Escorts
High Profile Call Girls Nagpur Meera Call 7001035870 Meet With Nagpur EscortsHigh Profile Call Girls Nagpur Meera Call 7001035870 Meet With Nagpur Escorts
High Profile Call Girls Nagpur Meera Call 7001035870 Meet With Nagpur EscortsCall Girls in Nagpur High Profile
 
Top Rated Pune Call Girls Budhwar Peth ⟟ 6297143586 ⟟ Call Me For Genuine Se...
Top Rated  Pune Call Girls Budhwar Peth ⟟ 6297143586 ⟟ Call Me For Genuine Se...Top Rated  Pune Call Girls Budhwar Peth ⟟ 6297143586 ⟟ Call Me For Genuine Se...
Top Rated Pune Call Girls Budhwar Peth ⟟ 6297143586 ⟟ Call Me For Genuine Se...Call Girls in Nagpur High Profile
 
KubeKraft presentation @CloudNativeHooghly
KubeKraft presentation @CloudNativeHooghlyKubeKraft presentation @CloudNativeHooghly
KubeKraft presentation @CloudNativeHooghlysanyuktamishra911
 
College Call Girls Nashik Nehal 7001305949 Independent Escort Service Nashik
College Call Girls Nashik Nehal 7001305949 Independent Escort Service NashikCollege Call Girls Nashik Nehal 7001305949 Independent Escort Service Nashik
College Call Girls Nashik Nehal 7001305949 Independent Escort Service NashikCall Girls in Nagpur High Profile
 
(MEERA) Dapodi Call Girls Just Call 7001035870 [ Cash on Delivery ] Pune Escorts
(MEERA) Dapodi Call Girls Just Call 7001035870 [ Cash on Delivery ] Pune Escorts(MEERA) Dapodi Call Girls Just Call 7001035870 [ Cash on Delivery ] Pune Escorts
(MEERA) Dapodi Call Girls Just Call 7001035870 [ Cash on Delivery ] Pune Escortsranjana rawat
 
Introduction and different types of Ethernet.pptx
Introduction and different types of Ethernet.pptxIntroduction and different types of Ethernet.pptx
Introduction and different types of Ethernet.pptxupamatechverse
 
UNIT-III FMM. DIMENSIONAL ANALYSIS
UNIT-III FMM.        DIMENSIONAL ANALYSISUNIT-III FMM.        DIMENSIONAL ANALYSIS
UNIT-III FMM. DIMENSIONAL ANALYSISrknatarajan
 
Call Girls Service Nashik Vaishnavi 7001305949 Independent Escort Service Nashik
Call Girls Service Nashik Vaishnavi 7001305949 Independent Escort Service NashikCall Girls Service Nashik Vaishnavi 7001305949 Independent Escort Service Nashik
Call Girls Service Nashik Vaishnavi 7001305949 Independent Escort Service NashikCall Girls in Nagpur High Profile
 
Call for Papers - African Journal of Biological Sciences, E-ISSN: 2663-2187, ...
Call for Papers - African Journal of Biological Sciences, E-ISSN: 2663-2187, ...Call for Papers - African Journal of Biological Sciences, E-ISSN: 2663-2187, ...
Call for Papers - African Journal of Biological Sciences, E-ISSN: 2663-2187, ...Christo Ananth
 
VIP Call Girls Service Hitech City Hyderabad Call +91-8250192130
VIP Call Girls Service Hitech City Hyderabad Call +91-8250192130VIP Call Girls Service Hitech City Hyderabad Call +91-8250192130
VIP Call Girls Service Hitech City Hyderabad Call +91-8250192130Suhani Kapoor
 

Recently uploaded (20)

VIP Call Girls Service Kondapur Hyderabad Call +91-8250192130
VIP Call Girls Service Kondapur Hyderabad Call +91-8250192130VIP Call Girls Service Kondapur Hyderabad Call +91-8250192130
VIP Call Girls Service Kondapur Hyderabad Call +91-8250192130
 
MANUFACTURING PROCESS-II UNIT-2 LATHE MACHINE
MANUFACTURING PROCESS-II UNIT-2 LATHE MACHINEMANUFACTURING PROCESS-II UNIT-2 LATHE MACHINE
MANUFACTURING PROCESS-II UNIT-2 LATHE MACHINE
 
Coefficient of Thermal Expansion and their Importance.pptx
Coefficient of Thermal Expansion and their Importance.pptxCoefficient of Thermal Expansion and their Importance.pptx
Coefficient of Thermal Expansion and their Importance.pptx
 
The Most Attractive Pune Call Girls Manchar 8250192130 Will You Miss This Cha...
The Most Attractive Pune Call Girls Manchar 8250192130 Will You Miss This Cha...The Most Attractive Pune Call Girls Manchar 8250192130 Will You Miss This Cha...
The Most Attractive Pune Call Girls Manchar 8250192130 Will You Miss This Cha...
 
Introduction to Multiple Access Protocol.pptx
Introduction to Multiple Access Protocol.pptxIntroduction to Multiple Access Protocol.pptx
Introduction to Multiple Access Protocol.pptx
 
(SHREYA) Chakan Call Girls Just Call 7001035870 [ Cash on Delivery ] Pune Esc...
(SHREYA) Chakan Call Girls Just Call 7001035870 [ Cash on Delivery ] Pune Esc...(SHREYA) Chakan Call Girls Just Call 7001035870 [ Cash on Delivery ] Pune Esc...
(SHREYA) Chakan Call Girls Just Call 7001035870 [ Cash on Delivery ] Pune Esc...
 
UNIT-II FMM-Flow Through Circular Conduits
UNIT-II FMM-Flow Through Circular ConduitsUNIT-II FMM-Flow Through Circular Conduits
UNIT-II FMM-Flow Through Circular Conduits
 
Java Programming :Event Handling(Types of Events)
Java Programming :Event Handling(Types of Events)Java Programming :Event Handling(Types of Events)
Java Programming :Event Handling(Types of Events)
 
Call for Papers - Educational Administration: Theory and Practice, E-ISSN: 21...
Call for Papers - Educational Administration: Theory and Practice, E-ISSN: 21...Call for Papers - Educational Administration: Theory and Practice, E-ISSN: 21...
Call for Papers - Educational Administration: Theory and Practice, E-ISSN: 21...
 
High Profile Call Girls Nagpur Meera Call 7001035870 Meet With Nagpur Escorts
High Profile Call Girls Nagpur Meera Call 7001035870 Meet With Nagpur EscortsHigh Profile Call Girls Nagpur Meera Call 7001035870 Meet With Nagpur Escorts
High Profile Call Girls Nagpur Meera Call 7001035870 Meet With Nagpur Escorts
 
Top Rated Pune Call Girls Budhwar Peth ⟟ 6297143586 ⟟ Call Me For Genuine Se...
Top Rated  Pune Call Girls Budhwar Peth ⟟ 6297143586 ⟟ Call Me For Genuine Se...Top Rated  Pune Call Girls Budhwar Peth ⟟ 6297143586 ⟟ Call Me For Genuine Se...
Top Rated Pune Call Girls Budhwar Peth ⟟ 6297143586 ⟟ Call Me For Genuine Se...
 
KubeKraft presentation @CloudNativeHooghly
KubeKraft presentation @CloudNativeHooghlyKubeKraft presentation @CloudNativeHooghly
KubeKraft presentation @CloudNativeHooghly
 
College Call Girls Nashik Nehal 7001305949 Independent Escort Service Nashik
College Call Girls Nashik Nehal 7001305949 Independent Escort Service NashikCollege Call Girls Nashik Nehal 7001305949 Independent Escort Service Nashik
College Call Girls Nashik Nehal 7001305949 Independent Escort Service Nashik
 
(MEERA) Dapodi Call Girls Just Call 7001035870 [ Cash on Delivery ] Pune Escorts
(MEERA) Dapodi Call Girls Just Call 7001035870 [ Cash on Delivery ] Pune Escorts(MEERA) Dapodi Call Girls Just Call 7001035870 [ Cash on Delivery ] Pune Escorts
(MEERA) Dapodi Call Girls Just Call 7001035870 [ Cash on Delivery ] Pune Escorts
 
Introduction and different types of Ethernet.pptx
Introduction and different types of Ethernet.pptxIntroduction and different types of Ethernet.pptx
Introduction and different types of Ethernet.pptx
 
UNIT-III FMM. DIMENSIONAL ANALYSIS
UNIT-III FMM.        DIMENSIONAL ANALYSISUNIT-III FMM.        DIMENSIONAL ANALYSIS
UNIT-III FMM. DIMENSIONAL ANALYSIS
 
Call Girls Service Nashik Vaishnavi 7001305949 Independent Escort Service Nashik
Call Girls Service Nashik Vaishnavi 7001305949 Independent Escort Service NashikCall Girls Service Nashik Vaishnavi 7001305949 Independent Escort Service Nashik
Call Girls Service Nashik Vaishnavi 7001305949 Independent Escort Service Nashik
 
DJARUM4D - SLOT GACOR ONLINE | SLOT DEMO ONLINE
DJARUM4D - SLOT GACOR ONLINE | SLOT DEMO ONLINEDJARUM4D - SLOT GACOR ONLINE | SLOT DEMO ONLINE
DJARUM4D - SLOT GACOR ONLINE | SLOT DEMO ONLINE
 
Call for Papers - African Journal of Biological Sciences, E-ISSN: 2663-2187, ...
Call for Papers - African Journal of Biological Sciences, E-ISSN: 2663-2187, ...Call for Papers - African Journal of Biological Sciences, E-ISSN: 2663-2187, ...
Call for Papers - African Journal of Biological Sciences, E-ISSN: 2663-2187, ...
 
VIP Call Girls Service Hitech City Hyderabad Call +91-8250192130
VIP Call Girls Service Hitech City Hyderabad Call +91-8250192130VIP Call Girls Service Hitech City Hyderabad Call +91-8250192130
VIP Call Girls Service Hitech City Hyderabad Call +91-8250192130
 

TEMPERATURE AND PRESSURE EFFECTS ON CHEMIOCAL RESCTION

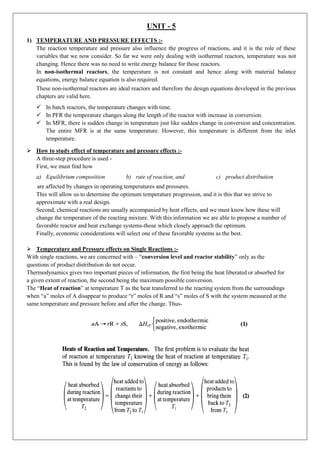
  • 1. UNIT - 5 1) TEMPERATURE AND PRESSURE EFFECTS :- The reaction temperature and pressure also influence the progress of reactions, and it is the role of these variables that we now consider. So far we were only dealing with isothermal reactors, temperature was not changing. Hence there was no need to write energy balance for those reactors. In non-isothermal reactors, the temperature is not constant and hence along with material balance equations, energy balance equation is also required. These non-isothermal reactors are ideal reactors and therefore the design equations developed in the previous chapters are valid here. ✓ In batch reactors, the temperature changes with time. ✓ In PFR the temperature changes along the length of the reactor with increase in conversion. ✓ In MFR, there is sudden change in temperature just like sudden change in conversion and concentration. The entire MFR is at the same temperature. However, this temperature is different from the inlet temperature. ➢ How to study effect of temperature and pressure effects :- A three-step procedure is used - First, we must find how a) Equilibrium composition b) rate of reaction, and c) product distribution are affected by changes in operating temperatures and pressures. This will allow us to determine the optimum temperature progression, and it is this that we strive to approximate with a real design. Second, chemical reactions are usually accompanied by heat effects, and we must know how these will change the temperature of the reacting mixture. With this information we are able to propose a number of favorable reactor and heat exchange systems-those which closely approach the optimum. Finally, economic considerations will select one of these favorable systems as the best. ➢ Temperature and Pressure effects on Single Reactions :- With single reactions, we are concerned with – “conversion level and reactor stability” only as the questions of product distribution do not occur. Thermodynamics gives two important pieces of information, the first being the heat liberated or absorbed for a given extent of reaction, the second being the maximum possible conversion. The “Heat of reaction” at temperature T as the heat transferred to the reacting system from the surroundings when “a” moles of A disappear to produce “r” moles of R and “s” moles of S with the system measured at the same temperature and pressure before and after the change. Thus-
  • 2. Knowing the heat of reaction at any one temperature as well as the specific heats of reactants and products in the temperature range concerned allows us to calculate the heat of reaction at any other temperature. From this the heat effects of the reaction can be found.
  • 4. ✓ Equilibrium Constants from Thermodynamics:- a) A reversible reaction can proceed in both the forward and backward directions. b) Equilibrium is when the rate of the forward reaction equals the rate of the reverse reaction. All reactant and product concentrations are constant at equilibrium. c) Given a reaction, 𝑎𝐴 + 𝑏𝐵 → 𝑐𝐶 + 𝑑𝐷, the equilibrium constant (KC ), also called K or Keq, is defined as follows: Example Part 1: Calculating from equilibrium concentrations Let's take a look at the equilibrium reaction that takes place between sulfur dioxide and oxygen to produce sulfur trioxide: The reaction is at equilibrium at some temperature, T, and the following equilibrium concentrations are measured: We can calculate for the reaction at temperature by solving following expression in which if we plug our known equilibrium concentrations into the above equation, we get: Note that since the calculated value is between 0.001 and 1000, we would expect this reaction to have significant concentrations of both reactants and products at equilibrium, as opposed to having mostly reactants or mostly products. ✓ Equilibrium Conversion:- The equilibrium composition, as governed by the equilibrium constant, changes with temperature, and from thermodynamics the rate of change is given by – On integrating above Eq., we see how the equilibrium constant changes with temperature. When the heat of reaction ∆Hr, can be considered to be constant in the temperature interval, integration yields – These expressions allow us to find the variation of the equilibrium constant, hence, equilibrium conversion, with temperature. The following conclusions may be drawn from thermodynamics – a) The thermodynamic equilibrium constant is unaffected by the pressure of the system, by the presence or absence of inerts, or by the kinetics of the reaction, but is affected by the temperature of the system. b) Though the thermodynamic equilibrium constant is unaffected by pressure or inerts, the equilibrium concentration of materials and equilibrium conversion of reactants can be influenced by these variables c) K > 1 indicates that practically complete conversion may be possible and that the reaction can be considered to be irreversible. K < 1 indicates that reaction will not proceed to any appreciable extent. d) For an increase in temperature, equilibrium conversion rises for endothermic reactions and drops for exothermic reactions.
  • 5. e) For an increase in pressure in gas reactions, conversion rises when the number of moles decreases with reaction; conversion drops when the number of moles increases with reaction. f) A decrease in inert for all reactions acts in the way that an increase in pressure acts for gas reactions. Above conclusions are illustrated in part by Fig. below - Effect of temperature on equilibrium conversion as predicted by thermodynamics (pressure fixed.)
  • 6.
  • 7. ✓ General Graphical Design Procedure:- 1) Temperature, composition, and reaction rate are uniquely related for any single homogeneous reaction, and this may be represented graphically in one of three ways, as shown in Fig. 9.2. 2) The first of these, the composition-temperature plot, is the most convenient so we will use it throughout to represent data, to calculate reactor sizes, and to compare design alternatives. 3) For a given feed (fixed CA0, CB0 , . . .) and using conversion of key component as a measure of the composition and extent of reaction, the XA versus T plot has the general shape shown in Fig. 9.3. 4) This plot can be prepared either from a thermodynamically consistent rate expression for the reaction (the rate must be zero at equilibrium) or by interpolating from a given set of kinetic data in conjunction with thermodynamic information on the equilibrium. 5) Naturally, the reliability of all the calculations and predictions that follow are directly dependent on the accuracy of this chart. Hence, it is imperative to obtain good kinetic data to construct this chart. The size of reactor required for a given duty and for a given temperature progression is found as follows: a) Draw the reaction path on the XA versus T plot. This is the operating line for the operation. b) Find the rates at various XA along this path. c) Plot the l/(-rA) versus XA curve for this path. d) Find the area under this curve. This gives V/FAo
  • 8. For exothermic reactions we illustrate this procedure in Fig. 9.4 for three paths: a) path AB for plug flow with an arbitrary temperature profile b) path CD for non-isothermal plug flow with 50% recycle, and c) point E for mixed flow. Note: - For mixed flow the operating line reduces to a single point. This procedure is quite general, applicable for any kinetics, any temperature progression, and any reactor type or any series of reactors. So, once the operating line is known. The reactor size can be found.
  • 9. From these values the X, versus T chart for any specific CA0 can be prepared and for this purpose the electronic computer is a great timesaver. Figure E9.3 is such a plot prepared for CA0 = 1 mol/liter and CRo = 0. Since we are dealing with first-order reactions this plot can be used for any CA0 value by properly relabeling the rate curves. Thus, for CA0 = 10 mol/liter simply multiply all the rate values on this graph by a factor of 10.
  • 10.
  • 11. 2) OPTIMUM TEMPERATURE PROGRESSION :- 1. Optimum temperature progression means the temperature profile that we want to maintain inside the reactor to minimize the reactor volume. In simple words, it is defined to be that progression which minimizes V/FAO, for a given conversion of reactant. 2. This optimum temperature progression may be an isothermal or it may be a changing temperature. 3. Different reactor have different ways for being isothermal or varying temperature i.e. - ✓ wrt time for a batch reactor ✓ along the length of a plug flow reactor, or ✓ From stage to stage for a series of mixed flow reactors. 4. It is important to know this progression because it is the ideal which we try to approach with a real system. It also allows us to estimate how far any real system departs from this idea. 5. The optimum temperature progression in any type of reactor is as follows: “At any composition, it will always be at the temperature where the rate is a maximum. The locus of maximum rates is found by examining the r (T, C) curves as shown in the Figure that shows this progression.” Figure - Operating lines for minimum reactor size. 6. For irreversible reactions whether endothermic or exothermic, the rate constant increases with temperature and hence the rate also increases. So for these reactions the reactor should be maintained at maximum possible constant temperature. This maximum temperature is decided by the material of construction. 7. For reversible reactions, there are two factors. Rate and equilibrium conversion. 8. For reversible endothermic reactions, with increase in temperature the forward rate increases and equilibrium conversion also increases. Hence these reactions should be carried out at maximum possible constant temperature. 9. For reversible exothermic reactions, with increase in temperature equilibrium conversion decreases and therefore we should use decreasing temperature profile. 10. An optimal temperature progression enhances overall energy efficiency by minimizing energy input while achieving the desired reaction outcomes.
  • 12. ➢ Heat Effects:- When the heat absorbed or released by reaction can markedly change the temperature of the reacting fluid, this factor must be accounted for in design. Thus we need to use the material and energy balance expressions, rather than the material balance alone, which was the starting point of all the analyses of isothermal operations of earlier study. ✓ First of all, if the reaction is exothermic and if heat transfer is unable to remove all of the liberated heat, then the temperature of the reacting fluid will rise as conversion rises. ✓ By similar arguments, for endothermic reactions the fluid cools as conversion rises. Let us relate this temperature change with extent of conversion. ➢ Adiabatic Operations:- Consider a mixed flow reactor, a plug flow reactor, or a section of plug flow reactor, in which the conversion is XA as shown in Fig. 9.6. In earlier study one component, usually the limiting reactant was selected as the basis for all material balance calculations. The same procedure is used here, with limiting reactant A taken as the basis. Let Subscripts 1, 2 refer to temperatures of entering and leaving streams. With T1 as the reference temperature on which enthalpies and heats of reaction are based we have Enthalpy of entering feed:
  • 13. The latter form of the equation simply states that the heat released by reaction just balances the heat necessary to raise the reactants from T1 to T2. The relation between temperature and conversion, as given by the energy balances of above Eq. 21 or 22, is shown in Fig. 9.7. The resulting lines are straight for all practical purposes since the variation of the denominator term of this equation is relatively small. When Cp” – Cp’ = 0, the heat of reaction is independent of temperature and Eqs. 21 and 22 reduce to which are straight lines in Fig. 9.7. 1. This figure illustrates the shape of the energy balance curve for both endothermic and exothermic reactions for both mixed flow and plug flow reactors. 2. This representation shows that whatever is the conversion at any point in the reactor, the temperature is at its corresponding value on the curve. 3. For plug flow the fluid in the reactor moves progressively along the curve, for mixed flow the fluid immediately jumps to its final value on the curve. These are the “adiabatic operating lines” for the reactor. 4. With increased inerts Cp rises, and these curves become more closely vertical. A vertical line indicates that temperature is unchanged as reaction proceeds. This then is the special case of isothermal reactions treated in earlier study.
  • 14. 5. The size of reactor needed for a given duty is found as follows. For plug flow tabulate the rate for various XA along this adiabatic operating line, prepare the “l / (-rA)” versus XA plot and integrate. For mixed flow simply use the rate at the conditions within the reactor. Figure 9.8 illustrates this procedure. 6. The best adiabatic operations of a single plug flow reactor are found by shifting the operating line (changing the inlet temperature) to where the rates have the highest mean value. 7. For endothermic operations this means starting at the highest allowable temperature. For exothermic reactions this means straddling the locus of maximum rates as shown in Fig. 9.9. A few trials will locate the best inlet temperature, that which minimizes V/FAO . For mixed flow the reactor should operate on the locus of maximum rates, again shown in Fig. 9.9. 8. The best reactor type, that which minimizes V/FAO is found directly from this XA, versus T graph. a) If the rate progressively decreases with conversion, then use plug flow. This is the case for endothermic reactions (Fig. 9.8 a) and close to isothermal exothermic reactions. b) For exothermic reactions that have a large temperature rise during reaction, the rate rises from a very low value to a maximum at some intermediate XA, then falls. This behavior is characteristic of autocatalytic reactions, thus recycle operations are best.
  • 15. 9. Figure 9.10 illustrates two situations, one where plug flow is best, the other where large recycle or mixed flow is best. The slope of the operating line, Cp/-∆Hr , will determine which case one has at hand. Thus – a) For small Cp/-∆Hr, (pure gaseous reactants) mixed flow is best. b) For large Cp/-∆Hr, (gas with much inerts, or liquid systems) plug flow is best. ➢ Non-adiabatic Operations:- For the adiabatic operating line of Fig. 9.7 to more closely approach the ideals of Fig. 9.5, we may want deliberately to introduce or remove heat from the reactor. In addition, there are heat losses to the surroundings to account for. Let us see how these forms of heat interchange modify the shape of the adiabatic operating line. Let Q be the total heat added to a reactor per mole of entering reactant A, and let this heat also include the losses to the surroundings. Then Eq. 20, the energy balance about the system, is modified to- With heat input proportional to ∆T = T2 – T2 the energy balance line rotates about T2. This change is shown in Fig. 9.11. Other modes of heat addition or removal yield corresponding shifts in the energy balance line. Using this modified operating line, the procedure for finding the reactor size and optimum operations follows directly from the discussion on adiabatic operations.
  • 16. Comments and Extensions:- 1. Adiabatic operations of an exothermic reaction give a rising temperature with conversion. However, the desired progression is one of falling temperature. Thus, very drastic heat removal may be needed to make the operating line approach the ideal, and many schemes may be proposed to do this. a) As an example, we may have heat exchange with the incoming fluid (see Fig. 9.12a), a case treated by van Heerden (1953, 1958). Figure 9.12: Ways of approaching the ideal temperature profile with heat exchange: (a) and (b) exothermic reaction b) Another alternative is to have multistage operations with inter-stage cooling between adiabatic sections (see Fig. 9.12b). In general multi-staging is used when it is impractical to affect the necessary heat exchange within the reactor itself. This is usually the case with gas-phase reactions with their relatively poor heat transfer characteristics.
  • 17. 2. For endothermic reactions, multi-staging with reheat between stages is commonly used to keep the temperature from dropping too low (see Fig. 9.12 c). The main use of these and many other forms of multistage operations is with solid catalyzed gas-phase reactions. Figure 9.12 : Ways of approaching the ideal temperature profile with heat exchange: (c) endothermic reaction. EXOTHERMIC REACTIONS IN MIXED FLOW REACTORS - A Special Problem