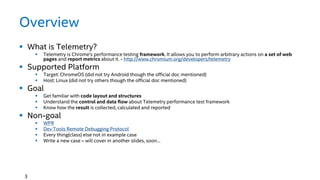
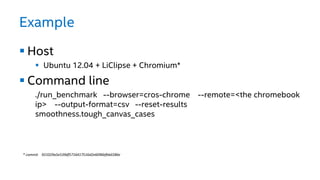
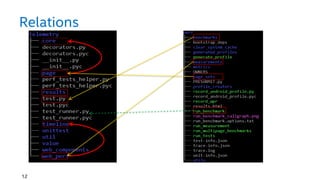
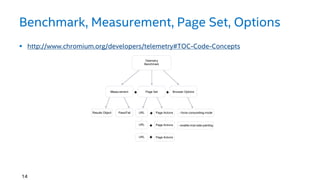
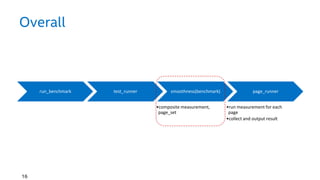
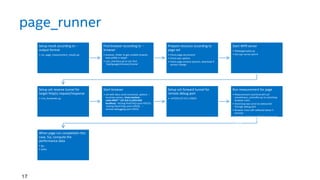
Telemetry in Depth
Tianyou Li
tianyou.li@gmail.com
Agenda
 Overview
 Methodology
 High Level Charts
 Low Level Details
 Q & A
Overview
 What is Telemetry?
 Telemetry is Chrome's performance testing framework. It allows you to perform arbitrary actions on a set of web
pages and report metrics about it. - http://www.chromium.org/developers/telemetry
 Supported Platform
 Target: ChromeOS (did not try Android though the official doc mentioned)
 Host: Linux (did not try others though the official doc mentioned)
 Goal
 Get familiar with code layout and structures
 Understand the control and data flow about Telemetry performance test framework
 Know how the result is collected, calculated and reported
 Non-goal
 WPR
 Dev Tools Remote Debugging Protocol
 Every thing(class) else not in example case
 Write a new case – will cover in another slides, soon…
3
Methodology
 Example Driven
 Top-Down
 Driven by Questions
4
What is the example we are
going through?
Example
 Host
 Ubuntu 12.04 + LiClipse + Chromium*
 Command line
./run_benchmark --browser=cros-chrome --remote=<the chromebook
ip> --output-format=csv --reset-results
smoothness.tough_canvas_cases
* commit 921029a5e539df5716417516d2e6096bfbb6586e
What are the codes we are
going through?
The code structure
 tools/telemetry
 tools/perf
8
tools/telemetry
tools/telemetry/telemetry/core
 browser.py
 webpagereplay.py
 browser_finder.py
 cros_forwarder.py
 backends/*
 backends/chrome/*
 backends/chrome/cros_interface.py
10
tools/perf
 run_benchmark(.py)
 benchmark/smoothness.py
 measurements/smoothness.py
 page_sets/smoothness.py
11
Relations
12
What are the basic concepts in
Telemetry
Benchmark, Measurement, Page Set, Options
14
 http://www.chromium.org/developers/telemetry#TOC-Code-Concepts
How those concepts connected
in code?
Overall
run_benchmark test_runner smoothness(benchmark)
•composite measurement,
page_set
page_runner
•run measurement for each
page
•collect and output result
16
page_runner
Setup result according to --
output-format
• csv_page_measurement_results.py
Find browser according to --
browser
• browser_finder to get suitable browser
executable in target
• cros_interface.py to ssh, find
‘/opt/google/chrome/chrome’
Prepare resource according to
page set
• Check page set present
• Check wpr options
• Check page achieve present, download if
version change
Start WPR server
• Webpagereplay.py
• Get wpr server port #
Setup ssh reverse tunnel for
target http(s) request/response
• cros_forwarder.py
Start browser
• ssh with dbus-send command, options: --
no-proxy-server,--host-resolver-
rules=MAP * 127.0.0.1,EXCLUDE
localhost,--testing-fixed-http-port=59219,-
-testing-fixed-https-port=59220, --
remote-debugging-port=59221
Setup ssh forward tunnel for
remote debug port
• -L47259:127.0.0.1:59221
Run measurement for page
• Measurement start/end will call
smoothness_controller.py to start/stop
browser trace
• Start/stop was send via websocket
through debug port
• Browser trace will collected about 5
seconds
• inspector_backend will help to execute
simple javascript to generate start/stop
marker
When page run complete(in this
case, 5s), compute the
performance data
• fps
• Janks
17
Results:
- Where is it?
- What is the output?
- How does the data generated?
- How to interpret those data?
Where is it? What is the output?
 In our example, the result simply displayed in stdout. You can
specify –o option to send output to designate file
 The output looks as following
19
page_name
frame_times
(ms)
jank (ms)
mean_frame_time
(ms)
mean_pixels_appro
ximated (percent)
mostly_smooth
(score)
http://mudcu.be/labs/JS1k/
BreathingGalaxies.html
17.26396552 149.406 17.264- -
http://runway.countlesspro
jects.com/prototype/perfor
mance_test.html
40.03739837 2732.9738 40.037- -
http://ie.microsoft.com/te
stdrive/Performance/FishIE
Tank/Default.html
16.6890301 34.4974 16.689- -
http://ie.microsoft.com/te
stdrive/Performance/SpeedR
eading/Default.html
31.9674359 646.008 31.967- -
How does the data generated?
 Raw data send from Chrome browser via debug port
 Processed by
telemetry/telemetry/web_perf/metrics/smoothness.py
 frame_times: arithmetic mean of frame_time sequence
 Jank: discrepancy of frame_times sequence
 mean_frame_time: arithmetic mean of frame_time sequence, round 3
 mean_pixels_approximated: not available
 mostly_smooth: if 95% frame time < 19ms (1000ms/60) then 1, otherwise 0
20
How to interpret those data?
 frame_times/ mean_frame_time
 1/FPS
 jank
 smoothness
 score
 quality
21
Tough Questions?
Questions
 What is the overhead on *target* if using telemetry?
 What is the memory consumption on *host*, over time?
 Can a benchmark run with multiple measurement? Why?
 How many metrics currently supported on ChromeOS?
Do we try all of them?
 WPR package contains multiple application data, how to
update data? Update one application will affect others?
 …

Telemetry indepth

  • 1.
    Telemetry in Depth TianyouLi tianyou.li@gmail.com
  • 2.
    Agenda  Overview  Methodology High Level Charts  Low Level Details  Q & A
  • 3.
    Overview  What isTelemetry?  Telemetry is Chrome's performance testing framework. It allows you to perform arbitrary actions on a set of web pages and report metrics about it. - http://www.chromium.org/developers/telemetry  Supported Platform  Target: ChromeOS (did not try Android though the official doc mentioned)  Host: Linux (did not try others though the official doc mentioned)  Goal  Get familiar with code layout and structures  Understand the control and data flow about Telemetry performance test framework  Know how the result is collected, calculated and reported  Non-goal  WPR  Dev Tools Remote Debugging Protocol  Every thing(class) else not in example case  Write a new case – will cover in another slides, soon… 3
  • 4.
    Methodology  Example Driven Top-Down  Driven by Questions 4
  • 5.
    What is theexample we are going through?
  • 6.
    Example  Host  Ubuntu12.04 + LiClipse + Chromium*  Command line ./run_benchmark --browser=cros-chrome --remote=<the chromebook ip> --output-format=csv --reset-results smoothness.tough_canvas_cases * commit 921029a5e539df5716417516d2e6096bfbb6586e
  • 7.
    What are thecodes we are going through?
  • 8.
    The code structure tools/telemetry  tools/perf 8
  • 9.
  • 10.
    tools/telemetry/telemetry/core  browser.py  webpagereplay.py browser_finder.py  cros_forwarder.py  backends/*  backends/chrome/*  backends/chrome/cros_interface.py 10
  • 11.
    tools/perf  run_benchmark(.py)  benchmark/smoothness.py measurements/smoothness.py  page_sets/smoothness.py 11
  • 12.
  • 13.
    What are thebasic concepts in Telemetry
  • 14.
    Benchmark, Measurement, PageSet, Options 14  http://www.chromium.org/developers/telemetry#TOC-Code-Concepts
  • 15.
    How those conceptsconnected in code?
  • 16.
    Overall run_benchmark test_runner smoothness(benchmark) •compositemeasurement, page_set page_runner •run measurement for each page •collect and output result 16
  • 17.
    page_runner Setup result accordingto -- output-format • csv_page_measurement_results.py Find browser according to -- browser • browser_finder to get suitable browser executable in target • cros_interface.py to ssh, find ‘/opt/google/chrome/chrome’ Prepare resource according to page set • Check page set present • Check wpr options • Check page achieve present, download if version change Start WPR server • Webpagereplay.py • Get wpr server port # Setup ssh reverse tunnel for target http(s) request/response • cros_forwarder.py Start browser • ssh with dbus-send command, options: -- no-proxy-server,--host-resolver- rules=MAP * 127.0.0.1,EXCLUDE localhost,--testing-fixed-http-port=59219,- -testing-fixed-https-port=59220, -- remote-debugging-port=59221 Setup ssh forward tunnel for remote debug port • -L47259:127.0.0.1:59221 Run measurement for page • Measurement start/end will call smoothness_controller.py to start/stop browser trace • Start/stop was send via websocket through debug port • Browser trace will collected about 5 seconds • inspector_backend will help to execute simple javascript to generate start/stop marker When page run complete(in this case, 5s), compute the performance data • fps • Janks 17
  • 18.
    Results: - Where isit? - What is the output? - How does the data generated? - How to interpret those data?
  • 19.
    Where is it?What is the output?  In our example, the result simply displayed in stdout. You can specify –o option to send output to designate file  The output looks as following 19 page_name frame_times (ms) jank (ms) mean_frame_time (ms) mean_pixels_appro ximated (percent) mostly_smooth (score) http://mudcu.be/labs/JS1k/ BreathingGalaxies.html 17.26396552 149.406 17.264- - http://runway.countlesspro jects.com/prototype/perfor mance_test.html 40.03739837 2732.9738 40.037- - http://ie.microsoft.com/te stdrive/Performance/FishIE Tank/Default.html 16.6890301 34.4974 16.689- - http://ie.microsoft.com/te stdrive/Performance/SpeedR eading/Default.html 31.9674359 646.008 31.967- -
  • 20.
    How does thedata generated?  Raw data send from Chrome browser via debug port  Processed by telemetry/telemetry/web_perf/metrics/smoothness.py  frame_times: arithmetic mean of frame_time sequence  Jank: discrepancy of frame_times sequence  mean_frame_time: arithmetic mean of frame_time sequence, round 3  mean_pixels_approximated: not available  mostly_smooth: if 95% frame time < 19ms (1000ms/60) then 1, otherwise 0 20
  • 21.
    How to interpretthose data?  frame_times/ mean_frame_time  1/FPS  jank  smoothness  score  quality 21
  • 22.
  • 23.
    Questions  What isthe overhead on *target* if using telemetry?  What is the memory consumption on *host*, over time?  Can a benchmark run with multiple measurement? Why?  How many metrics currently supported on ChromeOS? Do we try all of them?  WPR package contains multiple application data, how to update data? Update one application will affect others?  …