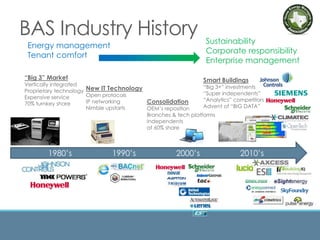
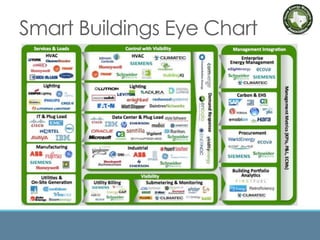
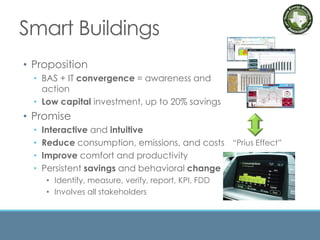
Technology Trends in Intelligent
& High Performance Buildings
Leveraging BIGData
Texas Energy Managers Association
Presented by:
Patrick Mabry - OpenTech
Mike Putich - Climatec
May 15, 2014
Agenda
• Introductions
• Big Data Facts
• BAS Industry History
• Smart Buildings
• Opportunities, Challenges & Solutions
• Successes
• OpenTech / Climatec Overview
• Closing Thoughts
• Questions
Just the Facts
• Computing technology will double every
18 months (Moore’s Law)
• Business data doubles every 1.2 years
• Big data market = $50B by 2017
• Poor or bad data costs 20%-30% in lost
revenue annually
• Strain on infrastructures causes lost
opportunities
• Data is good (my opinion)
Source - www.wikibon.org
Needle in a Haystack
Consolidation
OEM’s reposition
Branches & tech platforms
Independents
at 60% share
BAS Industry History
1980’s 1990’s 2000’s 2010’s
“Big 3” Market
Vertically integrated
Proprietary technology
Expensive service
70% turnkey share
New IT Technology
Open protocols
IP networking
Nimble upstarts
Energy management
Tenant comfort
Sustainability
Corporate responsibility
Enterprise management
Smart Buildings
“Big 3+” investments
“Super independents”
“Analytics” competitors
Advent of “BIG DATA”
Smart Buildings Eye Chart
Smart Buildings
• Proposition
• BAS + IT convergence = awareness and
action
• Low capital investment, up to 20% savings
• Promise
• Interactive and intuitive
• Reduce consumption, emissions, and costs
• Improve comfort and productivity
• Persistent savings and behavioral change
• Identify, measure, verify, report, KPI, FDD
• Involves all stakeholders
“Prius Effect”
Stakeholders
Stakeholders
Portfolio
Performance
Public
Perception
Carbon
Footprint
EnergyUse
(Simple)
EnergyUse
(Detailed)
Building
Performance
Building
Comfort
Education/
Awareness
Executives   
Energy Manager   
Sustainability Manager    
Facility Manager    
Engineer    
Occupants    
Public / Visitors   
Students / Teachers    
Manual
Data Input
Reports
Scheduling Tenant
Billing
Utility
Mgt.
Aging
Buildings
Student
Engagement
Public
Transparency
How many balls in the air is too many?
The Big Question:
Do we know how our
building systems really operate?
Who’s watching to
make sure?
• Who verifies that what they are
doing is right?
• That assumptions were (are) correct?
• That they are still running as expected… haven’t
been interfered with or overridden – a common
problem
• Buildings are too complex for this to be done solely
by humans
• Too much data… systems too complex…
The Old Way
A very manual process
 View graphics
of equipment systems
 Review reports or history logs
 Export data into Excel for
manual analysis
 No single tool that works
across all kinds of data
 Single location of building portfolio
 Software automatically looks for
“issues” (things that matter) in our data….
 Compare & rank building performance
 Portfolio or across national/regional averages
 Identify and address issues
 Profile building performance
 Make better decisions
 Optimize building operations
 Air/water systems
 Demand response
 Engage stakeholders
The Answer:
Analytics & Visualization
Solutions
• Variety of solutions available
• Energy Dashboards
• Sustainability & KPI Dashboards
• Fault Detection & Data Analytics
• Building Automation Control
• Tenant After Hours
• Submetering & Billing
• Demand Response / Control
• Business Systems Integrations
• Central Plant Optimization
• Kiosks
• Business models
• CapEx
• Software as a Service (SaaS)
• Web browser based tools
• Mobile applications
Underpinning Research
Source – U. S. Department of Energy
Commercial Office
• Worldwide real estate owner
• Enterprise-level deployment
• Dashboards
• Building Automation
• Tenant after hours
• Fault detection
• Business systems integration
• Hosted by Climatec
• System statistics –
• 13M sqft / 90+ buildings
• US & UK
• >95,000 points and >300 users
• Payback = <2yrs
• Savings = >$2M
“Utilizing the platform has resulted in energy and operational
savings as well as increased tenant satisfaction”
Vice President - Sustainability
Detecting broken sensors running
large fan systems at full load all the
time
• 39% reduction of fan energy
• $1300/year for 15 minutes of work
to clean the sensor
Detecting improper VAV zone
operation in a newly commissioned
building (reversed temp reset)
• Operational savings by
eliminating dozens of trouble calls
per month
• More satisfied tenants
Detecting night setback control not
active in hospital operating rooms
which run on 100% outside air
• $12,380 in avoided energy costs
• 134,186 pounds of carbon
emissions
• 863,927 kBTU of energy conserved
• 1.6 Billion ft3 less air moved thru
ORs
Detecting demand peaks traced to
manual operation of equipment =
• Avoidance of 11 month electric
demand charge penalty
Detecting and reducing overrides
across 925 big box retail stores
• $1.8 Million in savings from one
finding
Detecting simultaneous heating
and cooling in 67 sites
• $375K is savings from one finding
Examples
Industry Observations
• Market expansion, contraction & consolidation
• Limited case study materials
• Diverse offerings
• Many new start ups & niche players
• Smaller companies & limited capital
• Varying deployment models
• Limited direct impact on savings
• Need feet-on-the-street
Climatec / OpenTech
• Largest independent BAS provider in North America
• Founded in 1975
• Offices across Texas, Arizona, California and Nevada
• Over 700 employees
• Focusing on building technology & energy efficiency
• Building Automation
• Life Safety & Security
• Video Surveillance
• Nurse Call / Infant Protection
• Performance Contracting
• Enterprise Energy Management (Big Data)
PRODUCTS OFFERED / SUPPORTED
Closing Comments
Questions

Technology trends in intelligent high performance buildings v2

  • 1.
    Technology Trends inIntelligent & High Performance Buildings Leveraging BIGData Texas Energy Managers Association Presented by: Patrick Mabry - OpenTech Mike Putich - Climatec May 15, 2014
  • 2.
    Agenda • Introductions • BigData Facts • BAS Industry History • Smart Buildings • Opportunities, Challenges & Solutions • Successes • OpenTech / Climatec Overview • Closing Thoughts • Questions
  • 3.
    Just the Facts •Computing technology will double every 18 months (Moore’s Law) • Business data doubles every 1.2 years • Big data market = $50B by 2017 • Poor or bad data costs 20%-30% in lost revenue annually • Strain on infrastructures causes lost opportunities • Data is good (my opinion) Source - www.wikibon.org
  • 4.
    Needle in aHaystack
  • 5.
    Consolidation OEM’s reposition Branches &tech platforms Independents at 60% share BAS Industry History 1980’s 1990’s 2000’s 2010’s “Big 3” Market Vertically integrated Proprietary technology Expensive service 70% turnkey share New IT Technology Open protocols IP networking Nimble upstarts Energy management Tenant comfort Sustainability Corporate responsibility Enterprise management Smart Buildings “Big 3+” investments “Super independents” “Analytics” competitors Advent of “BIG DATA”
  • 6.
  • 7.
    Smart Buildings • Proposition •BAS + IT convergence = awareness and action • Low capital investment, up to 20% savings • Promise • Interactive and intuitive • Reduce consumption, emissions, and costs • Improve comfort and productivity • Persistent savings and behavioral change • Identify, measure, verify, report, KPI, FDD • Involves all stakeholders “Prius Effect”
  • 8.
    Stakeholders Stakeholders Portfolio Performance Public Perception Carbon Footprint EnergyUse (Simple) EnergyUse (Detailed) Building Performance Building Comfort Education/ Awareness Executives   Energy Manager    Sustainability Manager     Facility Manager     Engineer     Occupants     Public / Visitors    Students / Teachers    
  • 9.
  • 10.
    The Big Question: Dowe know how our building systems really operate?
  • 11.
    Who’s watching to makesure? • Who verifies that what they are doing is right? • That assumptions were (are) correct? • That they are still running as expected… haven’t been interfered with or overridden – a common problem • Buildings are too complex for this to be done solely by humans • Too much data… systems too complex…
  • 12.
    The Old Way Avery manual process  View graphics of equipment systems  Review reports or history logs  Export data into Excel for manual analysis  No single tool that works across all kinds of data
  • 13.
     Single locationof building portfolio  Software automatically looks for “issues” (things that matter) in our data….  Compare & rank building performance  Portfolio or across national/regional averages  Identify and address issues  Profile building performance  Make better decisions  Optimize building operations  Air/water systems  Demand response  Engage stakeholders The Answer: Analytics & Visualization
  • 14.
    Solutions • Variety ofsolutions available • Energy Dashboards • Sustainability & KPI Dashboards • Fault Detection & Data Analytics • Building Automation Control • Tenant After Hours • Submetering & Billing • Demand Response / Control • Business Systems Integrations • Central Plant Optimization • Kiosks • Business models • CapEx • Software as a Service (SaaS) • Web browser based tools • Mobile applications
  • 15.
    Underpinning Research Source –U. S. Department of Energy
  • 16.
    Commercial Office • Worldwidereal estate owner • Enterprise-level deployment • Dashboards • Building Automation • Tenant after hours • Fault detection • Business systems integration • Hosted by Climatec • System statistics – • 13M sqft / 90+ buildings • US & UK • >95,000 points and >300 users • Payback = <2yrs • Savings = >$2M “Utilizing the platform has resulted in energy and operational savings as well as increased tenant satisfaction” Vice President - Sustainability
  • 17.
    Detecting broken sensorsrunning large fan systems at full load all the time • 39% reduction of fan energy • $1300/year for 15 minutes of work to clean the sensor Detecting improper VAV zone operation in a newly commissioned building (reversed temp reset) • Operational savings by eliminating dozens of trouble calls per month • More satisfied tenants Detecting night setback control not active in hospital operating rooms which run on 100% outside air • $12,380 in avoided energy costs • 134,186 pounds of carbon emissions • 863,927 kBTU of energy conserved • 1.6 Billion ft3 less air moved thru ORs Detecting demand peaks traced to manual operation of equipment = • Avoidance of 11 month electric demand charge penalty Detecting and reducing overrides across 925 big box retail stores • $1.8 Million in savings from one finding Detecting simultaneous heating and cooling in 67 sites • $375K is savings from one finding Examples
  • 18.
    Industry Observations • Marketexpansion, contraction & consolidation • Limited case study materials • Diverse offerings • Many new start ups & niche players • Smaller companies & limited capital • Varying deployment models • Limited direct impact on savings • Need feet-on-the-street
  • 19.
    Climatec / OpenTech •Largest independent BAS provider in North America • Founded in 1975 • Offices across Texas, Arizona, California and Nevada • Over 700 employees • Focusing on building technology & energy efficiency • Building Automation • Life Safety & Security • Video Surveillance • Nurse Call / Infant Protection • Performance Contracting • Enterprise Energy Management (Big Data)
  • 20.
  • 21.
  • 22.