
Recommended
Recommended
More Related Content
What's hot
What's hot (20)
Similar to MBA project report -Techniques of sourcing candidate at augusta hi tech soft solutions coimbatore
Similar to MBA project report -Techniques of sourcing candidate at augusta hi tech soft solutions coimbatore (20)
Recently uploaded
Recently uploaded (20)
MBA project report -Techniques of sourcing candidate at augusta hi tech soft solutions coimbatore
- 1. TECHNIQUES OF SOURCING CANDIDATES: AN EXPLORATION OF THE CURRENT STRATEGIES OF RECRUITMENTS AT AUGUSTA HI-TECH SOFT SOLUTIONS, COIMBATORE PROJECT REPORT Submitted by: PRAVEEN KUMAR J.P Register No: 711516631035 Of KIT-KALAIGNARKARUNANIDHI INSTITUTE OF TECHNOLOGY In partial fulfillment of requirement For the Award of Degree of MASTER OF BUSINESS ADMINISTRATION ANNA UNIVERSITY ,CHENNAI (2016-2018) Under the supervision and guidance of Mr.S.Sivagnanabharathi M.B.A., (Ph.D)., Assistant Professor & Head Department of Management Studies KIT-Kalaignarkarunanidhi Institute of Technology Accredited with ‘A’ Grade by NAAC & NBA Coimbatore-641 402
- 2. KIT-KALAIGNARKARUNIDHI INSTITUTE OF TECHNOLOGY COIMBATORE-641402 DEPARTMENT OF MANAGEMENT STUDIES PROJECT REPORT June 2018 This is to certify that the project entitled “TECHNIQUES OF SOURCING CANDIDATES: AN EXPLORATION OF THE CURRENT STRATEGIES OF RECRUITMENTS AT AUGUSTA HI-TECH SOFT SOLUTIONS, COIMBATORE” is the bonafide record of project work by PRAVEEN KUMAR J.P Register No:711516631035 Of MASTER OF BUSINESS ADMINISTRATION During the year 2017-2018 ____________________ ____________________ Project guide Head of the Department Submitted for the project report viva voice examination held on _____________ ____________________ ____________________ Internal Examiner External Examiner
- 3. CERTIFICATE
- 5. DECLARATION
- 6. DECLARATION I affirm that the project work titled “TECHNIQUES OF SOURCING CANDIDATES: AN EXPLORATION OF THE CURRENT STRATEGIES OF RECRUITMENTS AT AUGUSTA HI-TECH SOFT SOLUTIONS,COIMBATORE” is done at, being submitted in partial fulfillment for the award of MASTER OF BUSINESS ADMINISTRATION is the original work carried out by me. It has not formed the part of any other project work submitted for award of any degree or diploma, either in this or any other University. J.P.PRAVEEN KUMAR Reg No: 711516631035 I certify that the declaration made above by the candidate is true to my knowledge. Signature of guide
- 8. ACKNOWLEDGEMENT The success of any project is the co-operative effort of the people around an individual. For all efforts behind this successful project, I am highly intended to the following personalities without whom this training programme would never be completed. I find no words to express my gratitude towards those who were constantly involved with me throughout the development process. I wish to express my sincere thanks and deep gratitude to Dr.P.ANBALAGAN, Director, KIT-Kalaignarkarunanidhi Institute of Technology for providing all the necessary facilities to carry out this training successfully. I also wish to express my sincere thanks and deep sense of gratitude to Dr.N.MOHAN DAS GANDHI, Principal, KIT-Kalaignarkarunanidhi Institute of Technology for providing the necessary support and help to carry out this training programme successfully. It’s my pleasure to acknowledge my sincere heartfelt gratitude to Mr.S.SIVAGNANABHARATHI, Assistant Professor & Head of the Department of Management Studies, KIT-Kalaignarkarunanidhi Institute of Technology for her surplous effort, sincere help and patience encouragement. At the outset, I deem it a pleasure in expressing my deep sense of gratitude and sincere thanks to my guide Mr.S.SIVAGNANABHARATHI, Assistant Professor & Head of the management Studies, who has extended and remarkable support to complete my training report and the faculty members in the department having helped in this report. I recon my gratitude in expressing deepest and sincere thanks to Organisation management and Organisation guide Mr.KAARTHICK SUBRAMANINAM HR Manager AUGUSTA Hi-Tech Soft Solution for allowing me to do this project in the reputed concern , who has extended a valuable guidance and cooperation in spite of his work schedule for helping me in completing the project.
- 9. ABSTRACT
- 10. ABSTRACT The purpose of this study was to explore current techniques used by recruiters to source candidates for filling the vacancies. Qualitative method was used in this study. The grounded theory methodology employed an open ended questionnaire to collect the data. In all, considerations in recruiting participants for qualitative research, strategies to facilitate recruitment, and suggest guidelines for reporting of recruitment efforts in qualitative research. I identify characteristics of the recruiter, institutional and community gate keeping, understanding participants, behaviours and differences and determining the participant sample as four key considerations applicable to qualitative research and In conclusion, this project proposes how the different techniques of sourcing might help in designing improved research and better educational usage of the concepts. Keywords: Recruiter, recruitment, gate keeping, grounded theory, sourcing, qualitative.
- 11. INDEX
- 12. TABLE OF CONTENTS CHAPTER CONTENT PAGE.NO ACKNOWLEDGEMENT ABSTRACT 1 INTRODUCTION 1.1 INTRODUCTION TO THE STUDY 1 1.2 INTRODUCTION TO THE STUDY 14 1.3 INTRODUCTION TO THE COMPANY 16 1.4 OBJECTIVE OF THE STUDY 19 1.5 SCOPE OF THE STUDY 20 1.6 LIMITATION OF THE STUDY 21 2 REVIEW OF THE LITERATURE 22 3 RESEARCH METHODOLOGY 26 4 DATA ANALYSIS AND INTERPRETATION 28 4.1 TABLES 29 4.2 CHARTS 29 4.3 CHI-SQUARE ANALYSIS 59 5 5.1 FINDINGS 64 5.2 SUGGESTIONS 66 6 CONCLUSION 67 7 BIBLIOGRAPHY & APPENDIX 68
- 13. LIST OF TABLES
- 14. LIST OF TABLE TABLE.NO DESCRIPTION PAGE.NO 4.1.1 OPINION ABOUT : AGE OF RESPONDENTS 29 4.1.2 OPINION ABOUT : GENDER OF RESPONDENTS 30 4.1.3 OPINION ABOUT : EDUCATION QUALIFICATION 31 4.1.4 OPINION ABOUT : EXPERIENCE OF THE RESPOND 32 4.1.5 OPINION ABOUT : HR PLANNING FOR ACHIEVING TARGETS 33 4.1.6 OPINION ABOUT : TIMELINESS PLANNING AND AUDIT FOR HR REQUIREMENTS 34 4.1.7 OPINION ABOUT : ADEQUATE POOL OF EMPLOYEES AFTER HR PLANNING PROCESS 35 4.1.8 OPINION ABOUT : SKILLS, KNOWLEDGE & EDUCATION OF EXISTING EMPLOYEES 36 4.1.9 OPINION ABOUT : WORK EVENLY DISTRIBUTED AMONG THE EMPLOYEES 37 4.1.10 OPINION ABOUT : HR TRAIN & HIRING EMPLOYEES 38 4.1.11 OPINION ABOUT : HR FINDS GOOD CANDIDATES FROM NON-TRADITIONAL SOURCES WHEN NECESSARY 39 4.1.12 OPINION ABOUT : COMPREHENSIVE JOB- DESCRIPTIONS FOR ALL SAID POSITIONS 40 4.1.13 OPINION ABOUT : WELL-MANAGED AND PREPARED TO MEET POTENTIAL CHALLENGES & OPPORTUNITIES 41 4.1.14 OPINION ABOUT : THE COMPANY HAVE FORMAL HR FILING SYSTEM 42 4.1.15 OPINION ABOUT : PERFORMANCE, TRAINING DONE, EXPERIENCE OF EXISTING EMPLOYEES 43
- 15. TABLE.NO DESCRIPTION PAGE.NO 4.1.16 OPINION ABOUT : LEAVES & OVERTIME OF THE EMPLOYEES IN HR AUDIT PROCESS 44 4.1.17 OPINION ABOUT : SALARIES AND MOTIVATIONAL LEVEL OF EMPLOYEES 45 4.1.18 OPINION ABOUT : HR DEPARTMENT’S PERFORMANCE IN HR AUDIT & PLANNING PROCESS 46 4.1.19 OPINION ABOUT : RECRUITMENT & SELECTION PROCESS IS EFFECTIVE FOR THE ORGANIZATIONAL OBJECTIVES 47 4.1.20 OPINION ABOUT : RECRUITMENT & SELECTION PROCESS EFFICIENCY IN THE ORGANISATION ACTIVITIES 48 4.1.21 OPINION ABOUT : BEST RESOURCES INCREASES THE EFFICIENCY ON ALL ORGANIZATION DEPARTMENT 49 4.1.22 OPINION ABOUT : RECRUITMENT & SELECTION PROCESS DEPENDS ON RESOURCE OF RECRUITMENT 50 4.1.23 OPINION ABOUT : BEST SOURCE FOR RECRUITMENT & SELECTION PROCESS 51 4.1.24 OPINION ABOUT : RECRUITMENT & SELECTION CAN BE INCREASE BY RECRUITMENT RESOURCES 52 4.1.25 OPINION ABOUT : RECRUITMENT & SELECTION PROCESS DEPENDS ON INTERVIEWS 53 4.1.26 OPINION ABOUT : RECRUITMENT & SELECTION BEHAVIOUR DEPENDS ON RECRUITER 54 4.1.27 OPINION ABOUT : END RESULTS OF RECRUITMENT & SELECTION PROCESS CAN BE WRONG 55
- 16. TABLE.NO DESCRIPTION PAGE.NO 4.1.28 OPINION ABOUT : INTERVIEWS ARE THE BASIC FILTER OF THE RECRUITMENT & SELECTION PROCESS 56 4.1.29 OPINION ABOUT : DIFFERENT METHODS OF INTERVIEWS SHOULD BE USED 57 4.1.30 OPINION ABOUT : WHICH METHOD SHOULD BE USED FOR RECRUITMENT 58 CHI-SQUARE TEST 4.3.1 OPINION ABOUT : RELATIONSHIP BETWEEN RESPONDENTS AGE AND HR PLANNING FOR ACHIEVING TARGETS 59 4.3.2 OPINION ABOUT : RELATIONSHIP BETWEEN GENDER AND TIMELINESS PLANNING AND AUDIT FOR HR REQUIREMENTS 60 4.3.3 OPINION ABOUT : RELATIONSHIP BETWEEN EXPERIENCE OF THE RESPOND AND LEAVES & OVERTIME OF THE EMPLOYEES IN HR AUDIT PROCESS 61 4.3.4 OPINION ABOUT : RELATIONSHIP BETWEEN RESPONDENTS AGE AND WHICH METHOD SHOULD BE USED FOR RECRUITMENT 62 4.3.5 OPINION ABOUT : RELATIONSHIP BETWEEN RESPONDENTS EDUCATION QUALIFICATION AND RECRUITMENT & SELECTION PROCESS EFFICIENCY IN THE ORGANISATION ACTIVITIES 63
- 17. LIST OF CHARTS
- 18. LIST OF CHARTS TABLE.NO DESCRIPTION PAGE.NO 4.2.1 OPINION ABOUT : AGE OF RESPONDENTS 29 4.2.2 OPINION ABOUT : GENDER OF RESPONDENTS 30 4.2.3 OPINION ABOUT : EDUCATION QUALIFICATION 31 4.2.4 OPINION ABOUT : EXPERIENCE OF THE RESPOND 32 4.2.5 OPINION ABOUT : HR PLANNING FOR ACHIEVING TARGETS 33 4.2.6 OPINION ABOUT : TIMELINESS PLANNING AND AUDIT FOR HR REQUIREMENTS 34 4.2.7 OPINION ABOUT : ADEQUATE POOL OF EMPLOYEES AFTER HR PLANNING PROCESS 35 4.2.8 OPINION ABOUT : SKILLS, KNOWLEDGE & EDUCATION OF EXISTING EMPLOYEES 36 4.2.9 OPINION ABOUT : WORK EVENLY DISTRIBUTED AMONG THE EMPLOYEES 37 4.2.10 OPINION ABOUT : HR TRAIN & HIRING EMPLOYEES 38 4.2.11 OPINION ABOUT : HR FINDS GOOD CANDIDATES FROM NON-TRADITIONAL SOURCES WHEN NECESSARY 39 4.2.12 OPINION ABOUT : COMPREHENSIVE JOB- DESCRIPTIONS FOR ALL SAID POSITIONS 40 4.2.13 OPINION ABOUT : WELL-MANAGED AND PREPARED TO MEET POTENTIAL CHALLENGES & OPPORTUNITIES 41 4.2.14 OPINION ABOUT : THE COMPANY HAVE FORMAL HR FILING SYSTEM 42 4.2.15 OPINION ABOUT : PERFORMANCE, TRAINING DONE, EXPERIENCE OF EXISTING EMPLOYEES 43
- 19. TABLE.NO DESCRIPTION PAGE.NO 4.2.16 OPINION ABOUT : LEAVES & OVERTIME OF THE EMPLOYEES IN HR AUDIT PROCESS 44 4.2.17 OPINION ABOUT : SALARIES AND MOTIVATIONAL LEVEL OF EMPLOYEES 45 4.2.18 OPINION ABOUT : HR DEPARTMENT’S PERFORMANCE IN HR AUDIT & PLANNING PROCESS 46 4.2.19 OPINION ABOUT : RECRUITMENT & SELECTION PROCESS IS EFFECTIVE FOR THE ORGANIZATIONAL OBJECTIVES 47 4.2.20 OPINION ABOUT : RECRUITMENT & SELECTION PROCESS EFFICIENCY IN THE ORGANISATION ACTIVITIES 48 4.2.21 OPINION ABOUT : BEST RESOURCES INCREASES THE EFFICIENCY ON ALL ORGANIZATION DEPARTMENT 49 4.2.22 OPINION ABOUT : RECRUITMENT & SELECTION PROCESS DEPENDS ON RESOURCE OF RECRUITMENT 50 4.2.23 OPINION ABOUT : BEST SOURCE FOR RECRUITMENT & SELECTION PROCESS 51 4.2.24 OPINION ABOUT : RECRUITMENT & SELECTION CAN BE INCREASE BY RECRUITMENT RESOURCES 52 4.2.25 OPINION ABOUT : RECRUITMENT & SELECTION PROCESS DEPENDS ON INTERVIEWS 53 4.2.26 OPINION ABOUT : RECRUITMENT & SELECTION BEHAVIOUR DEPENDS ON RECRUITER 54 4.2.27 OPINION ABOUT : END RESULTS OF RECRUITMENT & SELECTION PROCESS CAN BE WRONG 55
- 20. TABLE.NO DESCRIPTION PAGE.NO 4.2.28 OPINION ABOUT : INTERVIEWS ARE THE BASIC FILTER OF THE RECRUITMENT & SELECTION PROCESS 56 4.2.29 OPINION ABOUT : DIFFERENT METHODS OF INTERVIEWS SHOULD BE USED 57 4.2.30 OPINION ABOUT : WHICH METHOD SHOULD BE USED FOR RECRUITMENT 58
- 21. ABOUT THE STUDY
- 22. 1 CHAPTER -1 1.1 ABOUT THE STUDY A research has its own importance in any business organization. It is a systematic and scientific investigation of any idea either precise or abstract from continuous basic of learning. As we know in present times, the Morden world is progressing at a very high pace. Due to high competition and increased expectations, every organization needs effective recruitment and selection process. By these study new segments of recruitment and selection has been discovered. This will help to enhance the capability of AUGUSTA in using the recruitment and selection process more effectively. This project would be significant for researcher because this is the opportunity for putting theoretical knowledge into practical application. This project would be significant for the readers as it is providing them knowledge about recruitment and selection process. RECRUITMENT Recruitment is defined as, “a process to discover the source of manpower to meet the requirements of the schedule and to employ effective measures for attracting that manpower in adequate number to facilitate effective selection of an efficient workforce.”Edwin B.Flippo defined recruitment as “the process of searching for prospective employees and stimulate them to apply for jobs in the organization.”Recruitment is a ‘linking function’-joining together those with jobs to fill and those seeking jobs. It is a ‘joining process’ in that it tries to bring together job seekers and employer with a view to encourage the former to apply for a job with the life advisor. In order to attract people for the jobs, the organization must communicate the position in such a way that job seekers respond. To be cost effective, the recruitment process should attract qualified applicants and provide enough information for unqualified person to self- select themselves out. Recruitment is distinct from employment and selection. Once the required number and kind of human resources are determined, the management has to find the potential life advisors where the required human resources are/will be available and also find the means of attracting them towards the organization before selecting suitable candidates for jobs. All this process is generally known as recruitment .Some people use the term “Recruitment for employment .These two are not one and the same. Recruitment is only one step in the entire employment process. Some others use the term recruitment for selection function and it includes only findings, developing the sources of prospective employees and attracting them to apply for jobs in an organization, whereas the selection is the process of findings out the most suitable candidate to the job out of the candidates attracted (i.e., recruited).Formal definition of recruitment would give clear cut idea about the function of recruitment.
- 23. 2 PURPOSE AND IMPORTANCE OF RECRUITMENT The general purpose of recruitment is to provide a pool of potentially qualified job candidates. Specifically, the purpose are to: Increase the pool of candidates at minimum cost. Help increase the success rate of the selection process by reducing the number of visibly, under qualified or overqualified job applicants. Help reduce the probability that job applicants, once recruited and selected, will leave the organization only after a short period of time. Begin identifying and preparing potential job applicants who will be appropriate candidates. Induct outsiders with a new perspective to lead the company Infuse fresh blood at all levels of the organization. Develop an organizational culture that attracts competent people to the company Search or head hunt/head pouch whose skills fit the company’s values. Devise methodologies for assessing psychological traits. Search for talent globally and not just within the company Design entry pay that competes on quality but not on quantum. Anticipate and find people for positions that do not exist yet. Increases organizational and individual effectiveness in the short term and long term Evaluate the effectiveness of various recruiting techniques and sources for all types of job applicants. Recruitment represents the first contract that a company makes with potential employees. It is through recruitment that many individuals will come to know a company and eventually decide whether they wish to work for it a well-planned and well-managed recruiting effort will result in high-quality employees cannot be selected when better candidates do not know of job openings, are not interested in working for the company and do not apply. The recruitment process should inform qualified individuals about employment opportunities, create a positive image of the company, provide enough information about the jobs so that applicants can make comparisons with their qualifications and interests, and generate enthusiasm among the best candidates so that they will apply for the vacant positions.
- 24. 3 The negative consequences of a poor recruitment process speak volumes about its role in an organization. The failure to generate an adequate number of reasonably qualified applicants can prove costly in several ways. It can greatly complicit the selection process and may result in lowering of selection standards .The poor quality of selection means extra cost on training and supervision. Furthermore, when recruitment fails to meet the organizational needs for talent, typical relationships in the organization, resulting in avoidable consequences. Thus, the effectiveness of a recruitment process can play a major role in determining the resources that must be expended on other HR activities and their ultimate success. SOURCE OF RECRUITMENT Every organization has the option of choosing the candidates for its recruitment processes from two kinds of source: internal and external sources. The sources within the organization itself (like transfer of employees from one department to other, promotions) to fill a position are known as the internal sources of recruitment. Recruitment candidates from all the other sources (like outsourcing agencies etc.) are known as the external source of recruitment. INTERNAL RECRUITMENT Internal advertisement Word of mouth Promotions Internal Employee Referrals Retired employees for temporary or contract positions. ADVANTAGES OF INTERNAL RECRUITMENT No cost and less time consuming No need of training Builds strong relationship with employees. Motivates others of hard work to get high positions Easy to pick best talents within an organization very quickly Long stay with company when promoted to high position
- 25. 4 DISADVANTAGES OF INTERNAL RECRUITMENT The positions of persons who are promoted will be vacant There may be partiality in promoting employees No new opportunities for external candidates Dissatisfied employees may quit if his co-worker is promoted to high positions EXTERNAL RECRUITMENT This involves recruiting a candidate through references, networks, job portals or they may approach recruitment agencies. In order to compete with other companies & increase their standards, employers hunt for best talents working for other top companies. METHODS OF EXTERNAL RECRUITMENT Job portals Internal and external employee referrals Recruitment/Headhunting agencies Job ads on newspapers/Websites Campus recruitment Walk in ADVANTAGES OF EXTERNAL RECRUITMENT Create new opportunities for external employees Best candidates can be placed for the roles Cost of employees can be minimized Increase in the selection ratio These are less changes of partiality Uniqueness in employees worked for different companies can take the current company to extra mile Able to recruit the skills it needs.
- 26. 5 DISADVANTAGES OF EXTERNAL RECRUITMENT Cost to hire is high External process is more time consuming as compared to internal process. Sourcing quality candidates becomes difficult for the companies Internal recruiters lack headhunting skills (less references & networks).They may have to approach recruitment agencies to hire the people. FACTORS AFFECTING RECRUITMENT Potential advantages Internal Worker morale and motivation is enhanced Organization has a better opportunity to assess knowledge & skills of the candidate Candidate has existing knowledge about the organization less orientation may be needed May generate unhealthy competitiveness for promotions Additional training may be required Pool of candidate may be restricted Those not selected may feel rejected and discontented External New ideas and insights New knowledge and experience Larger pool of talent to recruit from Recruiting and selecting may be more time-consuming Longer adjustment period may be needed Induction costs may be higher Less opportunity to assess knowledge & skills
- 27. 6 Please note that these pros and cons may or may not apply when recruiting for all positions. Weigh up possible pros and cons for each recruitment situation before making your decision regarding sources Undesirable consequences of poor recruitment Poor recruitment choices (i.e., poor person-job fit it )can have a range of undesirable consequences for the organization and the worker including : Higher rates of turnover Reduced performance effectiveness Lowered job satisfaction Reduced work motivation A challenge to recruitment of effective staff includes Lack of qualified applicants Inadequate salary packages Lack of resources (including funds) Limited scope for advancement and promotion Lack of job security Remoteness of services Stigma attached to working in the AOD field Strategies for successful recruitment Recruitment and selection is not only about choosing the most suitable candidate. The recruitment and selection experience can also impact on the likelihood that a candidate will accept a job offer and on their commitment to remaining with the organization. Committing time and resources to develop a comprehensive recruitment strategy is a worthwhile investment. Poor recruitment choices (i.e., poor person-job fit)can have a range of undesirable consequences for the organization and worker including Higher rates of turnover Reduced performance effectiveness Lowered job satisfaction
- 28. 7 Reduced work motivation Effective recruitment process Step1:Ensure an up-to-date job description Step2: Develop an effective recruitment strategy Step3: Evaluate the recruitment strategy A clear, accurate and up-to-date job description is crucial to ensuring a good person- job fit. It is worth while spending some time making sure that the job description matches the everyday reality of the job A job description contains two types of information Specific task and activities required for a particular job (E.g. conduct counselling sessions, write client reports) The knowledge, skills and abilities required for effective performance by the job incumbent (e.g., good communication skills, capacity to establish good client rapport). Useful information to gather from supervisors and co-workers includes What knowledge, skills, abilities and other personal characteristics (KSAOs)are necessary for the position? What KSAOs can be practically and reasonably expected? What KSAOs are essential for effective job performance? What KSAOs distinguish between good and poor performers on the job? It may also be useful to consider whether the organization is willing to take on less experienced workers and provide professional development activities (in-house or external) to build up their knowledge and skills. MORDEN TECHNIQUES Walk-in As per this techniques, the potential candidates are required to attend for an interview directly and without a prior application on specified date, time and at a specified place.
- 29. 8 Consult-in The busy and dynamic companies encourage the potential job seekers to approach them personally and consult them regarding the jobs. Head-hunting These are also known as search consultants. The companies request the professional organizations to search for the best candidates particularly for the senior executive positions. Body-shopping Professional organizations and the hi-tech training institutes develop the pool of human resources for the possible employment. The prospective employers contact these organizations to recruit the candidates. These professional and training institutions are called body shoppers and these activities are known as body shopping. Business alliances Business alliances like acquisitions, mergers and take –over help in getting human resources. the company with surplus human resources offers the services of their employees to other needy organizations. Tele-Recruiting This technique involves the use of the internet, to advertise job vacancies and also for the candidates to apply online. Overview of Selection Techniques Evidence-based best practice for three of the most commonly used selection techniques is outlined below Curriculum vitas/resumes and written applications A curriculum vitae (CV) / resume provide valuable information relating to a person’s professional qualifications and experiences. All information in the CV should be verified where appropriate (e.g., asking applicants to explain gaps in employment history).Requesting job applicants to address specific selection criteria (i.e., essential and desirable) can improve the efficiency of reviewing CVs. Conducting interviews Structured interviews are recommended. A structured interview involves asking each candidate the same set of questions and assessing their responses on the basis of pre- determined criteria .Questions and assessment criteria should be bases on accurate, updated job descriptions. It is also helpful to develop criteria to categories responses (e.g., as excellent, good, average, and unsatisfactory).An interview panel consisting of a
- 30. 9 representative selection of people may also be helpful. Two common types of structured interview questions are: Situational questions which ask candidates about hypothetical scenarios that may be encountered in the job and how they would respond in that situation Experienced-based questions which focus on specific example of the candidate’s prior work experiences and their responses to past situations that are relevant to the job in question. Reference checks References are useful for identifying past employment problems and clarifying the accuracy of information presented in an interview or CV. Only a small percentage of all reference checks are negative, therefore, it is often difficult to differentiate between candidates on the basis of reference checks alone. Induction and orientation of new workers An effective induction helps new workers understand their role and where they “fit” within the organization. It also equips them with the tools they need to perform their work role. Two useful induction tools are: Induction manual/kits which may contain: An induction checklist Organizational philosophy/ethics/history Strategic values of the organization An organizational chart / structure An employment manual on policies and procedures An orientation to workplace (including parking and safety issues) Information about episodes of care, the duty system, supervision, staff meetings, etc. Mentoring/ “buddy” system New workers can be parried with experienced workers from a similar area to “show them the ropes”.
- 31. 10 Alternatively, a more formal /structured mentoring system can be a useful induction strategy in which new workers are paired with a mentor who can assist them with their ongoing professional development Best practice in selection techniques A wide selection of techniques are available which range intensive (and expensive) activities (e.g., multi-day assessment canters), to the more commonly used interviews and reference checks. Based on the evidence alone best practice in selection requires a comprehensive program that, includes realistic tests of work practice and the use of validated psychometric instruments. This clearly an unrealistic expectation for most AOD organizations. The next section describes evidence-based practice for three of the most commonly used selection techniques Curriculum vitas/resumes and written applications Conducting interviews Selection tests Curriculum vitas / resumes and written applications Information about a person’s professional qualifications and experience can be obtained from their curriculum vitae (CV) / resume and their written applications. This information needs to be verified as far as possible before the person is hired. When reviewing the CV/resume and written application, look for item that may need further clarification such as Unexplained gaps in employment history Ambiguous wording Unanswered or partly answered questions Inconsistent information Frequent job changes Consider requesting job applicants to address specific criteria (i.e., essential and desirable) for job position. The onus is then on the applicant to summaries their work experience and qualifications and present it in an accessible manner. This makes for a more efficient and time-saving Process to find relevant information about each applicant that matches the criteria for the job.
- 32. 11 Conducting interviews In order to obtain the best person-job fit (i.e., matching the right person for the right job). A structured interview format is recommended. A structured interview involves asking each candidate the same set of questions and assessing their responses on the basis of pre- determined criteria. The questions assessment criteria are based on an accurate, updated job- description. The more common types of structured interview questions are situational and experience-based. Situational questions Situational questions ask candidates about hypothetical scenarios that may be encountered in the job and how they would respond in their situation. The questions directly tap into the work related experience and problem-solving style of the candidate. For example, situational interview questions may include Your case load has increased to the point of being unmanageable-how would you address this? What would you do if a client did not attend an appointment? You are the team leader and two team members have had an argument with one another about the way the work tasks should be assigned. How would you handle this? If you disagreed with the work practices of a co-worker or team member, how would you deal with this situation? A client arrives to a session intoxicated. How would you manage this? A client complains to you that another staff member has acted inappropriately. what would you do? During a counselling session. It becomes apparent that a client has problems to manage that are beyond your skill level (e.g., mental health issues or abuse). How would you handle this? Experience-based questions Experience –based questions focus on specific examples of the candidate’s prior work experiences and their responses to past situations that are relevant to the job in question. One advantage of experience-based questions is the opportunity to tap into actual behaviour and feelings rather than hypothetical ones. Examples of experience-based questions include:
- 33. 12 Please describe a situation where you had to deal with an aggressive client and outline how you deal with this. What were some of the strengths and weaknesses in your approach? Can you give an example of when you had to manage a complex project and describe the strategies you used to do this? Developing criteria to assess candidate’s responses To effectively distinguish between candidates, it is recommended that structured questions are accompanied by a pre-determined scoring key. The scoring key should contain examples of excellent, good, average, and unsatisfactory answer against which candidates answer can be compared. Advantages of pre-determined scoring criteria include: Reduced Augusta on interviewers memory or written notes Increased life advisory regarding the criteria against which candidates are assessed (i.e., what is a “good” answer? Consistency of assessment across candidates and between interviewers (if a panel is used). Interview panels It is recommended that an interview panel, rather than a single interviewer, is used. Using a panel of interviewers can help to minimize potential biases, as well as provide the opportunity to compare evolutions of the candidate before a final decision is made. Selection test Purpose To judge potential ability/ job related problems To eliminate the possibility of business on the part of interviewer To uncover talents not identifiable by interviewer. Types There are mainly four kinds of tests Achievement test (Proficiency test) To test the skills or knowledge acquired by the candidate due to his training and achievement for example typing test, shorthand test, operating calculators etc.
- 34. 13 Aptitude test (Potential test) To judge latent ability to learn a new job, in order to judge memory, reasoning, speed of perception, fluency in language, to judge the capacity to learn a particular type of mechanical work etc. Psychomotor or skill test Measure to ability to a specific job Personality test To judge individual value system, emotional reaction, maturity, confidence, to judge the dominance, self-confidence, self sufficiency etc.
- 36. 14 1.2 ABOUT THE INDUSTRY The software industry includes business for development, maintenance and publication of software that are using different business models, mainly either "license/maintenance based" (on-premises) or "Cloud based" (such as SaaS, PaaS, IaaS, MaaS, AaaS, etc.). The industry also includes software services, such as training, documentation, consulting and data recovery. The word "software" was coined as a prank as early as 1953, but did not appear in print until the 1960s. Before this time, computers were programmed either by customers, or the few commercial computer vendors of the time, such as UNIVAC and IBM. The first company founded to provide software products and services was Computer Usage Company in 1955. The software industry expanded in the early 1960s, almost immediately after computers were first sold in mass-produced quantities. Universities, government, and business customers created a demand for software. Many of these programs were written in- house by full-time staff programmers. Some were distributed freely between users of a particular machine for no charge. Others were done on a commercial basis, and other firms such as Computer Sciences Corporation (founded in 1959) started to grow. Other influential or typical software companies begun in the early 1960s included Advanced Computer Techniques, Automatic Data Processing, Applied Data Research, and Informatics General. The computer/hardware makers started bundling operating systems, systems software and programming environments with their machines. When Digital Equipment Corporation (DEC) brought a relatively low- priced microcomputer to market, it brought computing within the reach of many more companies and universities worldwide, and it spawned great innovation in terms of new, powerful programming languages and methodologies. New software was built for microcomputers, so other manufacturers including IBM, followed DEC's example quickly, resulting in the IBM AS/400 amongst others. The industry expanded greatly with the rise of the personal computer ("PC") in the mid-1970s, which brought desktop computing to the office worker for the first time. In the following years, it also created a growing market for games, applications, and utilities. DOS, Microsoft's first operating system product, was the dominant operating system at the time. In the early years of the 21st century, another successful business model has arisen for hosted software, called software-as-a-service, or SaaS; this was at least the third time this model had been attempted. From the point of view of producers of some proprietary software, SaaS reduces the concerns about unauthorized copying, since it can only be accessed through the Web, and by definition no client software is loaded onto the end user's PC.
- 37. 15 According to industry analyst Gartner, the size of the worldwide software industry in 2013 was US$407.3 billion, an increase of 4.8% over 2012. As in past years, the largest four software vendors were Microsoft, Oracle Corporation, IBM, and SAP respectively. The software industry has been subject to a high degree of consolidation over the past couple of decades. Between 1995 and 2018 around 37,039 mergers and acquisitions have been announced with a total known value of US$ 1,166 bil. USD. The highest number and value of deals was set in 2000 during the high times of the dot-com bubble with 2,674 transactions valued at 105. bil. USD. In 2017, 2,547 deals were announced valued at $111 billion. Approaches to successfully acquire and integrate software companies are available. Business models of software companies have been widely discussed. Network effects in software ecosystems, networks of companies, and their customers are an important element in the strategy of software companies.
- 39. 16 1.3 ABOUT THE COMPANY COMPANY PROFILE Headquarters : Boca Raton, FL Year founded : 2009 Company type : Privately Held Company size : 51-200 employees Website : http://www.augustahitech.com/ SPECIALTIES Enterprise Mobile Application Development Complex business systems integration Custom Application Development Product Development IBM Solutions Cloud services and applications Healthcare SUMMARY Augusta is a focused product development, software services and technology consulting company. Established in Silicon Valley with Offices in Florida, Texas and Offshore development centres in India. I have engaged with a lot of clients in creating strategy, implementing, deploying, and supporting a wide range of solutions for clients worldwide.
- 40. 17 PRODUCTS
- 41. 18
- 43. 19 1.4 OBJECTIVES OF THE STUDY • To study the recruitment and selection procedure followed in AUGUSTA HITECH SOLUTION • To study the various sources and process of recruitment • This project will provide the value insight to recruitment as well as help to get practical knowledge in employee hiring in the organisation • Effective recruitment strategies are a pivotal aspect of procuring and retaining high- quality talent to contribute to organization's success. • Impact of recruitment and selection strategy on employees performance
- 44. SCOPE OF THE STUDY
- 45. 20 1.5 SCOPE OF THE STUDY The benefits of the study for the researcher are that it helped to gain knowledge and experience and also provided the opportunity to study and understand the prevalent recruitment and selection procedures. The key points of my research study are: To study the fact about the AUGUSTA as a group. To analyses the recruitment policy of the organization. To Understand and analyze various HR factors including recruitment procedure. To suggest any measures/recommendations for the improvement of the recruitment procedures It extends to the whole Organization. It covers corporate office, sites and works appointments all over India. It covers employees, Clerical Staff, Officers, Jr. Management, Middle Management and Senior Management cadres
- 47. 21 1.6 LIMITATIONS OF THE STUDY This study also includes some limitations which have been discussed as follows: The employees and candidate proved a limitation because of difficulty in generalization of results. To collect the data from various companies’ been quite difficult due to non cooperation of some companies. This proved to be major limitation of the study. To access such a large number of employees were difficult because of non cooperative attitude of respondents. There was limitation of time to conduct such a big survey in limited available time.
- 49. 22 CHAPTER-2 REVIEW OF LITERATURE Hameed and Manjusha (2010) explored teacher efficacy of secondary school teachers in relation to teaching styles and organizational culture. The sample of the study consisted of 370 secondary school teachers belonging to Malappuram, Kozhikode and Thrissur districts of Kerala. Major findings were: (i) There was a significant difference in mean teacher efficacy scores between male and female teachers, but in case of mean teacher efficacy scores based on locale and type of management, no significant difference was found; (ii)The main effect of teaching styles on teacher efficacy was found to be significant for total sample, female, rural, government and unaided secondary school teachers;(iii)The main effect of organizational culture on teacher efficacy was found significant for total sample, female, urban, rural and government secondary school teachers; (iv)No significant interaction effect of teaching styles and organizational culture on teacher efficacy of secondary school teachers based on total sample and sub samples based on gender, locale and type of management was found Robert and Ming (2010) studied the effects on teachers' self-efficacy and job satisfaction related to gender, years of experience, and job stress. The authors of this study sought to examine the relationships among teachers' years of experience, teachers’ characteristics (gender and teaching level), three domains of self-efficacy (instructional strategies, classroom management, and student engagement), two types of job stress (work load and classroom stress), and job satisfaction with a sample of 1,430 practicing teachers using factor analysis, item response modeling, systems of equations, and a structural equation model. Teachers' years of experience showed nonlinear relationships with all three self-efficacy factors, increasing from early career to mid-career and then falling afterwards. Female teachers had greater workload stress, greater classroom stress from student behaviors, and lower classroom management self-efficacy. Those teaching young children (in elementary grades and kindergarten) had higher levels of self-efficacy for classroom management and studen Ms. Ambika Verma(2009) in their survey research on the use of technologies in recruiting, screening, and selection processes for job candidates conducted in Dimension group found that most organizations implemented technology based recruitment and selection tools to improve efficiency, reduce costs, and expand the applicant pool. Robert (2005) in his study titled, “Strategic HR Review, 2004”, states that successful recruitment and selection can improve organization performance”. Prasad (2005)have defined career path as 'it is the sequential pattern of jobs that forms a career'. The career path is the logical possible sequence of positions that could be held by an individual based on how he performs in the organization. Career path consists of two elements: line and ladder. Line is the field of specialty in which an individual is placed like production, marketing, finance, HRM, etc. Within each line, there are various positions arranged in hierarchical order. Placing an individual on a career path indicates, how the
- 50. 23 individual will progress to those positions. This placing is essentially determined by the alignment of individual needs, his strengths and weaknesses, and organizational opportunities. Jovanovic (2004) said recruitment is a process of attracting a pool of high quality applicants so as to select the best among them. For this reason, top performing companies devoted considerable resources and energy to creating high quality selection systems. Due to the fact that organizations are always fortified by information technology to be more competitive, it is natural to also consider utilizing this technology to re-organize the traditional recruitment and selection process through proper decision techniques, with that both the effectiveness and the efficiency of the processes can be increased and the quality of the recruitment and selection decision improved. According to Kaplan and Norton, (2004) a common problem in recruitment and selection is poor HR planning. Rigorous HR planning translates business strategies into specific HRM policies and practices. This is particularly so with recruitment and selection policies and practices. The key goal of HR planning is to get the right number of people with the right skills, experience and competencies in the right jobs at the right time at the right cost. Past research shows that the competency level of HR managers has a major influence on recruitment and selection and experienced HR experts within the HR department will not only shorten vacancy duration, but also improve the quality of the applicants. Moreover, effective recruitment and selection is possible only if there is a dedicated and competent HR team. Miyake, (2002) indicated that while advertising is usual for job vacancies, applicants were sometimes recruited by word of mouth, through existing employees. Besides being cheaper, the “grapevine” finds employees who stay longer (low voluntary turnover) and who are less likely to be dismissed (low involuntary turnover). People recruited by word of mouth stay longer because they have a clearer idea of what the job really involves. The study reviewed five studies in which average labor turnover of those recruited by advertising was 51 percent. The labor turnover for spontaneous applicants was 37 per cent and turnover for applicants recommended by existing employees was 30 percent. One hypothesis proposed to account for this was the “best information” hypothesis. It was argued that people who were suggested by other employees were better and more realistically informed about the job than those who applied through newspapers and agencies. Thus, they were in a better position to assess their own suitability. Better informed candidates are likely to have a more realistic view of the job, culture of the organization and job prospects. Greenhouse et al., (2000) in his study defines the above phenomenon of stagnation and meaninglessness in the current job is often termed as 'burnout'. This study defines career as 'the pattern of work-related experiences that span the course of a person's life. This definition includes both objective events, such as jobs, and Subjective views of work, such as the person's attitudes, values and expectations. Therefore, both a person's work-related activities and his/her reactions to those activities form part of the person's career. Woodd (2000) in his study emphasized that typical female career patterns are more suitable& reliable to the new economic era since they enable women to readily cope up with the new
- 51. 24 demands associated with the changing nature of careers. The existing career theories and models have been criticized as being biased toward men’s living conditions, thus suggesting that features of women’s career development, especially how they organize their working life and other aspects of life, still need additional research attention. Dessler, (2000) found in his study that the Recruitment and selection forms a core part of the central activities underlying human resource management: namely, the acquisition, development and reward of the workers. It frequently forms an important part of the work of human resource managers – or designated specialists within work organizations. However, and importantly, recruitment and selection decisions are often for good reason taken by non- specialists, by the line managers. Recruitment and selection also have an important role to play in ensuring worker performance and positive organizational outcomes. Recruitment and selection had the capacity to form a key part of the process of managing and leading people as a routine part of organizational life, it is suggested here that recruitment and selection has become ever more important as organizations increasingly regard their workforce as a source of competitive advantage. Of course, not all employers engage with this proposition even at the rhetorical level. However, there is evidence of increased interest in the utilization of employee selection methods which are valid, reliable and fair. Dessler listing the essence of these in the following; build a pool of candidates for the job, have the applicants fill out application forms, utilize various selection techniques to identify viable job candidates, send one or more viable job candidates to their supervisor, have the candidate(s) go through selection interviews, and determine to which candidate(s) an offer should be made. Barber (1998) defines Employee recruitment as “practices and activities carried on by an organization for the purpose of identifying and attracting potential employees”. Many large corporations have employee recruitment plans that are designed to attract potential employees that are not only capable of filling vacant positions but also add to the organization’s culture. Swanson and Woitke (1997) defined the term career barriers as "events or conditions, either within the person or in his or her environment, that make career progress difficult". Judge et. al. (1995) defined Career success as extrinsic or objective and intrinsic or subjective accomplishments of individuals in their work lives. The link between intrinsic career success (satisfaction with one's career) and extrinsic career success (pay, promotions, job level) has been demonstrated in numerous studies Armstrong (1991) studied the issues to consider include the type of sample (random or convenience), cost, ease, participant time demands (e.g., total time, days of the week, and time of day), and efficiency (e.g., staff hours per recruited participant). Researchers have a number of methods from which to choose, including advertising, direct mail, and telephone. Smith et al. (1989) argue that the more effectively the recruitment stage is carried out, the less important the actual selection process becomes. When an organization makes the decision to fill an existing vacancy through recruitment, the first stage in the process involves conducting a comprehensive job analysis. This may already have been conducted through the human resource planning process, particularly where recruitment is a relatively frequent
- 52. 25 occurrence. Once a job analysis has been conducted, the organization has a clear indication of the particular requirements of the job, where that job fits into the overall organization structure, and can then begin the process of recruitment to attract suitable candidates for the particular vacancy. Gould, (1984) argues that most mistakes are caused by the fact that managers generally give little thought to the critical nature of the decisions. Employers are surprised and disappointed when an appointment fails, and often the person appointed is blamed rather than recognizing the weaknesses in the process and methodology, even the soundest of techniques and best practice (in selection) contain scope for error. Some of this is due to the methods themselves, but the main source is the frailty of the human decision makers. Selection tools available to organizations can be characterized along a continuum that ranges from the more traditional methods of interviews, application forms and references, through to the more sophisticated techniques that encapsulate biographical data, aptitude tests, assessment centres, work samples, psychological testing, and so forth. Each method of selection has its advantages and disadvantages and comparing their rival claims involves comparing each method's merit and psychometric properties. The degree to which a selection technique is perceived as effective and perhaps sophisticated is determined by its reliability and validity.
- 54. 26 CHAPTER 3 RESEARCH METHODOLOGY Research in common parlance refers to search for knowledge. The advanced learner’s dictionary of current English lays down the meaning of research as a carefully investigation of enquiry especially through search for new facts in branch of knowledge. The systematic approach concerning generalization and the formulation of a theory is also research. The purpose of the research is to discover answer to questions through the application of scientific procedures RESEARCH DESIGN A research design is the arrangement of conditions for the collection and analysis of data in a manner that aims to combine relevance to the research purpose with economy in procedure. In this study descriptive type of the research design has been used. DESCRIPTIVE RESEARCH DESIGN Descriptive research design studies are those studies, which are concerned with describing the character of a group DATA COLLECTION PRIMARY DATA The primary data are those, which are collected a fresh and for the first time happen to be original character. It has been collected through a questionnaire SECONDARY DATA The secondary data are that which has been collected through by someone else and which has been passed through the stratified process. It has collected through the books and internet RESEARCH INSTRUMENT Questionnaire containing only closed ended questions. POPULATION In population it covers in all Augusta Hi-tech Soft Solutions, Coimbatore. SAMPLE UNIT Sample unit is Augusta Hi-tech Soft Solutions, Coimbatore.
- 55. 27 SAMPLE SIZE Number of the sampling units selected from the population is called the size of the sample. Sample of 75 respondents were obtained from the population. SAMPLING PROCEDURE The procedure adopted in the present study is probability sampling, which is also known as change sampling. Under this sampling design, every item of the frame has an equal change of inclusion in the sample CONTACT METHOD Respondents are contacted personally INTERVIEW SCHEDULE The interview schedule has been used to collect the data information can be gathered even when the respondents happen to be illiterate. TABULATION It is the arrangement of classified data in an orderly manner. This involves creating table for recording the filled in interview schedule. These tables are of immense help to analysis by using the statistics tool help to analysis by using the statistical tools. SCALING TECHNIQUES Questionnaire was framed on attitude scale having 5-point likert scales. PERIOD STUDY The study was conducted for the period of six month TOOLS USED FOR ANALYSIS The following tools were used with the help of statistical software • Simple percentage analysis • Chi-square test SIMPLE PERCENTAGE It is simply analysis tool in this method, based on the opinion of the respondents, percentage is calculated for the respective scale of each other. CHI-SQUARE TEST It is the important test developed by statisticians. It can be used to make comparison between theoretical population & actual data when categories are used.
- 57. 28 CHAPTER-4 DATA ANALYSIS AND INTERPRETATION The data after collection has to be processed and analysed in accordance with the outline laid down for the purpose of the time of developing the research plan. This is essential for a scientific study and for ensuring that the researcher had all relevant data for making contemplated compression and analysis. The term analysis refers to the computation certain measures alone with searching patterns of relationship that among data groups. Analysis of data in a general way involves a number of closely related operations which are performed with the purpose summarizing this in such a manner that the answer the research questions. Interpretation is the technique of growing inference. In fact, the main function if the researcher is the interpretation of collected data. Interpretation is needed for each question to give the result of the each question.
- 58. 29 TABLE NO: 4.1.1 AGE OF RESPONDENTS CHART NO: 4.2.1 INTERPRETATION It is interpreted from the above tabel that, 55% of the respondents age is between 26- 30yrs, 33% of the respondents age is between 20-25yrs, 7% of the respondents age is between 31-350yrs and 5% of the respondents age is between 36-40yrs. It is inferred that majority (55%) of the respondents age is between 26-30yrs. S.No Particulars No.of Respondents Percentage 1 20-25yrs 25 33 2 26-30yrs 41 55 3 31-350yrs 5 7 4 36-40yrs 4 5 Total 75 100.0
- 59. 30 TABLE NO: 4.1.2 GENDER OF RESPONDENTS S.No Particulars No.of Respondents Percentage 1 Male 65 87 2 Female 10 13.3 3 Total 75 100.0 CHART NO: 4.2.2 INTERPRETATION It is reveals from the above table that, 87% of the respondents belong to the male category, 13% of the respondents belong to female category. It is reveals that majority (87%) of the respondents belong to male category .
- 60. 31 TABLE NO: 4.1.3 EDUCATION QUALIFICATION S.No Particulars No.of Respondents Percentage 1 School level 0 0.0 2 Diploma 12 16 3 U.G 53 71 4 P.G 10 13 5 Phd 0 0 Total 75 100.0 CHART NO: 4.2.3 INTERPRETATION It is state from the above table that, 71% of the respondents are Under Graduate, 16% of the respondents are diploma and 13% of the respondents are Post Graduate It is state that majority (71%) of the respondents are Under Graduate.
- 61. 32 TABLE NO: 4.1.4 EXPERIENCE OF THE RESPOND S.No Particulars No.of Respondents Percentage 1 < 1year 26 35 2 2-5 yrs 33 44 3 5-10yrs 11 15 4 10-15yrs 5 7 Total 75 100.0 CHART NO: 4.2.4 INTERPRETATION It is denotes from the above table that, 44% of the respondents experience is 2-5years, 35% of the respondents experience less than 1 year,15% of the respondents experience is 5- 10 years,7% of the respondents experience is 10-15years. It is denotes that majority (44%) of the response experience is 2-5 years.
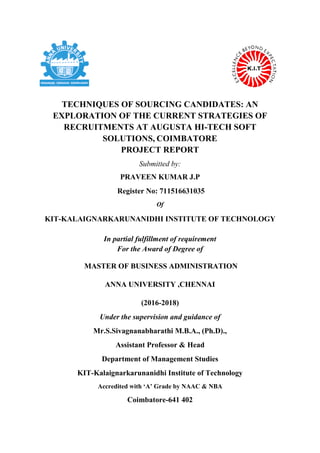
- 62. 33 TABLE NO: 4.1.5 HR PLANNING FOR ACHIEVING TARGETS S.No Particulars No.of Respondents Percentage 1 Excellent 11 15 2 Very good 18 24 3 Good 25 33 4 Average 9 12 5 Poor 12 16 Total 75 100.0 CHART NO: 4.2.5 INTERPRETATION It is proves from the above table that, 33% of the respondents says good to the HR planning for achieving targets, 24% of the respondents says very good to the HR planning for achieving targets,16% of the respondents say poor to the HR planning for achieving targets,15% of the respondents say excellent to the HR planning for achieving targets, 12% of the respondents say average to the HR planning for achieving targets. It is proves that majority (33%) of the respondents say good to the HR planning for achieving targets.
- 63. 34 TABLE NO: 4.1.6 TIMELINESS PLANNING AND AUDIT FOR HR REQUIREMENTS S.No Particulars No.of Respondents Percentage 1 Highly satisfied 13 17 2 Satisfied 25 33 3 Natural 19 25 4 Dissatisfied 13 17 5 Highly dissatisfied 5 7 Total 75 100.0 CHART NO: 4.2.6 INTERPRETATION It is explain from the above table that , 33% of the respondents satisfied the timeliness planning and audit for hr requirements,25% of the respondents natural the timeliness planning and audit for hr requirements,17% of the respondents highly satisfied the timeliness planning and audit for hr requirements,17% of the respondents dissatisfied the timeliness planning and audit for hr requirements, 7% of the respondents highly dissatisfied the timeliness planning and audit for hr requirements. It is explain that majority (33%) of the respondents satisfied the timeliness planning and audit for hr requirements.
- 64. 35 TABLE NO: 4.1.7 ADEQUATE POOL OF EMPLOYEES AFTER HR PLANNING PROCESS S.No Particulars No.of Respondents Percentage 1 Strongly agree 11 15 2 Agree 24 32 3 Neutral 22 29 4 Disagree 12 16 5 Strongly disagree 6 8 Total 75 100.0 CHART NO: 4.2.7 INTERPRETATION It is interpreted from the above table that, 32% of the respondents agree that the adequate pool of employees after HR planning process,29% of the respondents neutral that the adequate pool of employees after HR planning process,16% of the respondents disagree that the adequate pool of employees after HR planning process,15% of the respondents strongly agree that the adequate pool of employees after HR planning process,8% of the respondents strongly disagree that the adequate pool of employees after HR planning process. It is inferred that majority (32%) of the respondents agree that the adequate pool of employees after HR planning process.
- 65. 36 TABLE NO: 4.1.8 SKILLS, KNOWLEDGE & EDUCATION OF EXISTING EMPLOYEES S.No Particulars No.of Respondents Percentage 1 Always 6 8 2 Often 25 33 3 Sometimes 23 31 4 Rare 13 17 5 Never 8 11 Total 75 100.0 CHART NO: 4.2.8 INTERPRETATION It is reveals from the above table that, 33% of the respondents says skills, knowledge & education of existing employees, 31% of the respondents says sometimes skills, knowledge & education of existing employees, 17% of the respondents says rare skills, knowledge & education of existing employees, 11% of the respondents say never skills, knowledge & education of existing employees, 8% of the respondents rare skills, knowledge & education of existing employees. It is reveals that majority (33%) of the respondents says often skills, knowledge & education of existing employees.
- 66. 37 TABLE NO: 4.1.9 WORK EVENLY DISTRIBUTED AMONG THE EMPLOYEES S.No Particulars No.of Respondents Percentage 1 Strongly agree 8 11 2 Agree 28 38 3 Neutral 22 29 4 Disagree 13 17 5 Strongly Disagree 4 5 Total 75 100.0 CHART NO: 4.2.9 INTERPRETATION It is state from the above table that, 38% of the respondents agree the work evenly distributed among the employee, 29% of the respondents neutral the work evenly distributed among the employee,17% of the respondents disagree the work evenly distributed among the employee,11% of the respondents strongly agree the work evenly distributed among the employee, 5% of the respondents strongly disagree the work evenly distributed among the employee. It is state that majority (38%) of the respondents agree the work evenly distributed among the employee.
- 67. 38 TABLE NO: 4.1.10 HR TRAIN & HIRING EMPLOYEES S.No Particulars No.of Respondents Percentage 1 Strongly agree 8 11 2 Agree 25 33 3 Neutral 30 40 4 Disagree 6 8 5 Strongly disagree 6 8 Total 75 100.0 CHART NO: 4.2.10 INTERPRETATION It is implicit from the above table that, 40% of the respondents neutral the HR train & hiring employees,33% of the respondents agree the HR train & hiring employees,11% of the respondents strongly agree the HR train & hiring employees,8% of the respondents disagree the HR train & hiring employees,8% of the respondents strongly disagree HR train & hiring employees. It is implicit that majority (40%) of the respondents neutral the HR train & hiring employees.
- 68. 39 TABLE NO: 4.1.11 HR FINDS GOOD CANDIDATES FROM NON-TRADITIONAL SOURCES WHEN NECESSARY S.No Particulars No.of Respondents Percentage 1 1 4 5 2 2 8 11 3 3 27 36 4 4 21 28 5 5 15 20 Total 75 100.0 CHART NO: 4.2.11 INTERPRETATION It is denotes from the above table that , 36% of the respondents rate three for HR finds good candidates from non-traditional sources when necessary,28% of the respondents rate four for HR finds good candidates from non-traditional sources when necessary,20% of the respondents rate two for HR finds good candidates from non-traditional sources when necessary,11% of the respondents rate five for HR finds good candidates from non-traditional sources when necessary, 5% of the respondents rate one for HR finds good candidates from non-traditional sources when necessary. It is denotes that majority (36%) of the respondents rate three for HR finds good candidates from non-traditional sources when necessary.
- 69. 40 TABLE NO: 4.1.12 COMPREHENSIVE JOB-DESCRIPTIONS FOR ALL SAID POSITIONS S.No Particulars No.of Respondents Percentage 1 Strongly agree 8 11 2 Agree 9 12 3 Neutral 26 35 4 Disagree 25 33 5 Strongly Disagree 7 9 Total 75 100.0 CHART NO: 4.2.12 INTERPRETATION It is proves from the above table that, 35% of the respondents neutral the comprehensive job-descriptions for all said positions,33% of the respondents disagree the comprehensive job-descriptions for all said positions,12% of the respondents agree the comprehensive job-descriptions for all said positions,11% of the respondents strongly agree the comprehensive job-descriptions for all said positions,9% of the respondents strongly disagree the comprehensive job-descriptions for all said positions. It is proves that majority (35%) of the respondents agree the comprehensive job- descriptions for all said positions.
- 70. 41 TABLE NO: 4.1.13 WELL-MANAGED AND PREPARED TO MEET POTENTIAL CHALLENGES & OPPORTUNITIES S.No Particulars No.of Respondents Percentage 1 Strongly agree 6 8 2 Agree 17 23 3 Neutral 27 36 4 Disagree 17 23 5 Strongly disagree 8 11 Total 75 100.0 CHART NO: 4.2.13 INTERPRETATION It is explains from the above table that, 36% of the respondents neutral the well- managed and prepared to meet potential challenges & opportunities work evenly distributed, 23% of the respondents agree the well-managed and prepared to meet potential challenges & opportunities work evenly distributed ,23% of the respondents agree the well-managed and prepared to meet potential challenges & opportunities work evenly distributed,11% of the respondents strongly disagree the well-managed and prepared to meet potential challenges & opportunities work evenly distributed 8% of the respondents strongly agree well-managed and prepared to meet potential challenges & opportunities work evenly distributed. It is explains that majority (36%) of the respondents neutral the well-managed and prepared to meet potential challenges & opportunities work evenly distributed.
- 71. 42 TABLE NO: 4.1.14 THE COMPANY HAVE FORMAL HR FILING SYSTEM S.No Particulars No.of Respondents Percentage 1 Strongly agree 6 8 2 Aagree 21 28 3 Neutral 25 33 4 Disagree 18 24 5 Strongly Disagree 5 7 Total 75 100.0 CHART NO: 4.2.14 INTERPRETATION It is shows from the above table that, 33% of the respondents neutral the company have formal hr filing system, 28% of the respondents agree the company have formal hr filing system,24% of the respondents disagree the company have formal hr filing system,8% of the respondents strongly agree the company have formal hr filing system,7% of the respondents strongly disagree the company have formal hr filing system. It is shows that majority (33%) of the respondents neutral the company have formal hr filing system.
- 72. 43 TABLE NO: 4.1.15 PERFORMANCE, TRAINING DONE, EXPERIENCE OF EXISTING EMPLOYEES S.No Particulars No.of Respondents Percentage 1 Always 11 15 2 Often 14 19 3 Sometimes 21 28 4 Rare 18 24 5 Never 11 14 Total 75 100.0 CHART NO: 4.2.15 INTERPRETATION It is interpreted from the above table that, 28% of the respondents says sometimes the performance, training done, experience of existing employees,24% of the respondents says rare the performance, training done, experience of existing employees,19% of the respondents says often the performance, training done, experience of existing employees,15% of the respondents says always the performance, training done, experience of existing employees,14% of the respondents says often the performance, training done, experience of existing employees. It is interpreted that majority (28%) of the respondents says sometimes the performance, training done, experience of existing employees.
- 73. 44 TABLE NO: 4.1.16 LEAVES & OVERTIME OF THE EMPLOYEES IN HR AUDIT PROCESS S.No Particulars No.of Respondents Percentage 1 Always 6 8 2 Often 15 20 3 Sometimes 24 32 4 Rare 22 29 5 Never 8 11 Total 75 100.0 CHART NO: 4.2.16 INTERPRETATION It is reveals from the above table that ,32% of the respondents says sometimes the leaves & overtime of the employees in HR audit process,29% of the respondents says rare the leaves & overtime of the employees in HR audit process,,20% of the respondents says often the leaves & overtime of the employees in HR audit process,,11% of the respondents says never the leaves & overtime of the employees in HR audit process,,8% of the respondents says always the leaves & overtime of the employees in HR audit process. It is reveals that majority (32%) of the respondents says sometimes the leaves & overtime of the employees in HR audit process.
- 74. 45 TABLE NO: 4.1.17 SALARIES AND MOTIVATIONAL LEVEL OF EMPLOYEES S.No Particulars No.of Respondents Percentage 1 Strongly agree 4 5 2 Agree 23 31 3 Neutral 29 39 4 Disagree 18 24 5 Strongly disagree 1 1 Total 75 100.0 CHART NO: 4.2.17 INTERPRETATION It is state from the above table that, 39% of the respondents strongly agree the salaries and motivational level of employees,31% of the respondents agree the salaries and motivational level of employees,24% of the respondents disagree the salaries and motivational level of employees,5% of the respondents strongly agree the salaries and motivational level of employees,1% of the respondents strongly disagree the salaries and motivational level of employees. It is state that majority (39%) of the respondents strongly agree the salaries and motivational level of employees.
- 75. 46 TABLE NO: 4.1.18 HR DEPARTMENT’S PERFORMANCE IN HR AUDIT & PLANNING PROCESS S.No Particulars No.of Respondents Percentage 1 1 4 5 2 2 14 19 3 3 25 33 4 4 24 32 5 5 8 11 Total 75 100.0 CHART NO: 4.2.18 INTERPRETATION It is implicit from the above table that, 33% of the respondents rate three for HR department’s performance in hr audit & planning process,32% of the respondents rate four for HR department’s performance in hr audit & planning process,19% of the respondents rate two for HR department’s performance in hr audit & planning process,11% of the respondents rate five for HR department’s performance in hr audit & planning process, 5% of the respondents rate one for HR department’s performance in hr audit & planning process. It is implicit that majority (33%) of the respondents rate three for HR department’s performance in hr audit & planning process.
- 76. 47 TABLE NO:4.1.19 RECRUITMENT & SELECTION PROCESS IS EFFECTIVE FOR THE ORGANIZATIONAL OBJECTIVES S.No Particulars No.of Respondents Percentage 1 Strongly agree 8 11 2 Agree 19 25 3 Neutral 19 25 4 Disagree 15 20 5 Strongly disagree 14 19 Total 75 100.0 CHART NO: 4.2.19 INTERPRETATION It is denotes from the above table that, 25% of the respondents agree the recruitment & selection process is effective for the organizational objectives,25% of the respondents neutral the recruitment & selection process is effective for the organizational objectives,20% of the respondents disagree the recruitment & selection process is effective for the organizational objectives,19% of the respondents strongly disagree the recruitment & selection process is effective for the organizational objectives,11% of the respondents strongly agree the recruitment & selection process is effective for the organizational objectives. It is denotes that majority (25%) of the respondents agree the recruitment & selection process is effective for the organizational objectives.
- 77. 48 TABLE NO: 4.1.20 RECRUITMENT & SELECTION PROCESS EFFICIENCY IN THE ORGANISATION ACTIVITIES S.No Particulars No.of Respondents Percentage 1 Strongly agree 5 7 2 Agree 24 32 3 Neutral 24 32 4 Disagree 12 16 5 Strongly Disagree 10 13 Total 75 100.0 CHART NO: 4.2.20 INTERPRETATION It is proves from the above table that , 32% of the respondents agree the recruitment & selection process efficiency in the organisation activities,32% of the respondents neutral the recruitment & selection process efficiency in the organisation activities,16% of the respondents disagree the recruitment & selection process efficiency in the organisation activities,13% of the respondents strongly disagree the recruitment & selection process efficiency in the organisation activities,7% of the respondents strongly agree the recruitment & selection process efficiency in the organisation activities. It is proves that majority (32%) of the respondents agree the recruitment & selection process efficiency in the organisation activities .
- 78. 49 TABLE NO: 4.1.21 BEST RESOURCES INCREASES THE EFFICIENCY ON ALL ORGANIZATION DEPARTMENT S.No Particulars No.of Respondents Percentage 1 Strongly agree 12 16 2 Agree 18 24 3 Neutral 17 23 4 Disagree 16 21 5 Strongly disagree 12 16 Total 75 100.0 CHART NO: 4.2.21 INTERPRETATION It is explains from the above table that, 24% of the respondents agree the best resources increases the efficiency on all organization department,23% of the respondents neutral the best resources increases the efficiency on all organization department,21% of the respondents disagree the best resources increases the efficiency on all organization department,16% of the respondents strongly disagree the best resources increases the efficiency on all organization department,16% of the respondents strongly agree the best resources increases the efficiency on all organization department. It is explains that majority (24%) of the respondents agree the best resources increases the efficiency on all organization department.
- 79. 50 TABLE NO: 4.1.22 RECRUITMENT & SELECTION PROCESS DEPENDS ON RESOURCE OF RECRUITMENT S.No Particulars No.of Respondents Percentage 1 Strongly agree 15 20 2 Agree 14 19 3 Neutral 26 34 4 Disagree 6 8 5 Strongly Disagree 14 19 Total 75 100.0 CHART NO: 4.2.22 INTERPRETATION It is interpreted from the above table that, 34% of the respondents neutral the recruitment & selection process depends on resource of recruitment,20% of the respondents strongly agree the recruitment & selection process depends on resource of recruitment,19% of the respondents agree the recruitment & selection process depends on resource of recruitment, 19% of the respondents agree the recruitment & selection process depends on resource of recruitment, 8% of the respondents disagree the recruitment & selection process depends on resource of recruitment. It is interpreted that majority (34%) of the respondents neutral recruitment & selection process depends on resource of recruitment.
- 80. 51 TABLE NO: 4.1.23 BEST SOURCE FOR RECRUITMENT & SELECTION PROCESS S.No Particulars No.of Respondents Percentage 1 Promotion 10 13 2 Transfer 18 24 3 Advertisement 22 29 4 Campus recruitment 14 19 5 Placement agencies 11 15 Total 75 100.0 CHART NO: 4.2.23 INTERPRETATION It is shows from the above table that, 29% of the respondents says advertisement is the best source for recruitment & selection process,24% of the respondents says transfer is the best source for recruitment & selection process,19% of the respondents says campus recruitment is the best source for recruitment & selection process,15% of the respondents says placement agencies is the best source for recruitment & selection process, 1% of the respondents says promotion is the best source for recruitment & selection process. It is shows that majority (29%) of the respondents says advertisement is the best source for recruitment & selection process.
- 81. 52 TABLE NO: 4.1.24 RECRUITMENT & SELECTION CAN BE INCREASE BY RECRUITMENT RESOURCES S.No Particulars No.of Respondents Percentage 1 Strongly agree 11 15 2 Agree 15 20 3 Neutral 26 35 4 Disagree 16 21 5 Strongly disagree 7 9 Total 75 100.0 CHART NO: 4.2.24 INTERPRETATION It is reveals from the above table that , 35% of the respondents neutral the recruitment & selection can be increase by recruitment resources ,21% of the respondents disagree the recruitment & selection can be increase by recruitment resources,20% of the respondents disagree the recruitment & selection can be increase by recruitment resources,15% of the respondents strongly agree recruitment & selection can be increase by recruitment resources,9% of the respondents strongly disagree the recruitment & selection can be increase by recruitment resources. It is reveals that majority (35%) of the respondents neutral recruitment & selection can be increase by recruitment resources.
- 82. 53 TABLE NO: 4.1.25 RECRUITMENT & SELECTION PROCESS DEPENDS ON INTERVIEWS S.No Particulars No.of Respondents Percentage 1 Strongly agree 9 12 2 Agree 14 19 3 Neutral 23 31 4 Disagree 25 33 5 Strongly disagree 4 5 Total 75 100.0 CHART NO: 4.2.25 INTERPRETATION It is state from the above table that ,33% of the respondents disagree the recruitment & selection process depends on interviews ,31% of the respondents neutral the recruitment & selection process depends on interviews,19% of the respondents agree the recruitment & selection process depends on interviews,12% of the respondents strongly agree recruitment & selection process depends on interviews,5% of the respondents strongly disagree the recruitment & selection process depends on interviews. It is state that majority (33%) of the respondents disagree the recruitment & selection process depends on interviews.
- 83. 54 TABLE NO: 4.1.26 RECRUITMENT & SELECTION BEHAVIOUR DEPENDS ON RECRUITER S.No Particulars No.of Respondents Percentage 1 Strongly agree 5 7 2 Agree 24 32 3 Neutral 23 31 4 Disagree 17 23 5 Strongly disagree 6 8 Total 75 100.0 CHART NO: 4.2.26 INTERPRETATION It is implicit from the above table ,32% of the respondents agree the recruitment & selection behaviour depends on recruiter,31% of the respondents neutral the recruitment & selection behaviour depends on recruiter,23% of the respondents disagree the recruitment & selection behaviour depends on recruiter,8% of the respondents strongly disagree the recruitment & selection behaviour depends on recruiter,7% of the respondents strongly agree the recruitment & selection behaviour depends on recruiter. It is implicit that majority (32%) of the respondents agree the recruitment & selection behaviour depends on recruiter.
- 84. 55 TABLE NO: 4.1.27 END RESULTS OF RECRUITMENT & SELECTION PROCESS CAN BE WRONG S.No Particulars No.of Respondents Percentage 1 Strongly agree 12 16 2 Agree 17 23 3 Neutral 27 36 4 Disagree 11 15 5 Strongly disagree 8 11 Total 75 100.0 CHART NO: 4.2.27 INTERPRETATION It is denotes from the above table that, 36% of the respondents neutral the end results of recruitment & selection process can be wrong ,23% of the respondents agree the end results of recruitment & selection process can be wrong,16% of the respondents strongly agree the end results of recruitment & selection process can be wrong,15% of the respondents disagree the end results of recruitment & selection process can be wrong,11% of the respondents strongly disagree the end results of recruitment & selection process can be wrong It is denotes that majority (36%) of the respondents neutral the end results of recruitment & selection process can be wrong.
- 85. 56 TABLE NO: 4.1.28 INTERVIEWS ARE THE BASIC FILTER OF THE RECRUITMENT & SELECTION PROCESS S.No Particulars No.of Respondents Percentage 1 Strongly agree 10 13 2 Agree 19 25 3 Neutral 23 30 4 Disagree 15 20 5 Strongly disagree 8 10 Total 75 100.0 CHART NO: 4.2.28 INTERPRETATION It is proves from the above table that, 30% of the respondents neutral the interviews are the basic filter of the recruitment & selection process, 25% of the respondents agree the interviews are the basic filter of the recruitment & selection process, 20% of the respondents disagree the interviews are the basic filter of the recruitment & selection process, 13% of the respondents strongly agree the interviews are the basic filter of the recruitment & selection process, 10% of the respondents strongly disagree the interviews are the basic filter of the recruitment & selection process. It is proves that majority (30%) of the respondents neutral the interviews are the basic filter of the recruitment & selection process.
- 86. 57 TABLE NO: 4.1.29 DIFFERENT METHODS OF INTERVIEWS SHOULD BE USED S.No Particulars No.of Respondents Percentage 1 Strongly agree 12 16 2 Agree 19 25 3 Neutral 19 25 4 Disagree 16 21 5 Strongly Disagree 9 12 Total 75 100.0 CHART NO: 4.2.29 INTERPRETATION It is explain from the above table that, 25% of the respondents agree the different methods of interviews should be used, 25% of the respondents neutral the different methods of interviews should be used, 21% of the respondents disagree the different methods of interviews should be used, 16% of the respondents strongly agree the different methods of interviews should be used, 12% of the respondents strongly disagree the different methods of interviews should be used. It is explain that majority (25%) of the respondents agree the different methods of interviews should be used.
- 87. 58 TABLE NO: 4.1.30 WHICH METHOD SHOULD BE USED FOR RECRUITMENT S.No Particulars No.of Respondents Percentage 1 Promotion 13 17 2 Transfer 18 24 3 Advertisement 17 23 4 Campus recruitment 14 19 5 Placement agencies 13 17 Total 75 100.0 CHART NO: 4.2.30 INTERPRETATION It is shows from the above table that, 24% of the respondents says transfer method should be used for recruitment, 23% of the respondents says advertisement method should be used for recruitment, 19% of the respondents says campus recruitment method should be used for recruitment, 17% of the respondents says promotion method should be used for recruitment, 17% of the respondents says placement agencies method should be used for recruitment. It is shows that majority (24%) of the respondents says transfer method should be used for recruitment.
- 88. 59 CHI-SQUARE TEST-1 RELATIONSHIP BETWEEN RESPONDENTS AGE AND HR PLANNING FOR ACHIEVING TARGETS NULL HYPOTHESIS There is no significant difference among the respondents age and HR planning for achieving targets ALTERNATIVE HYPOTHESIS There is a significant difference among the respondents age and HR planning for achieving targets TABLE NO: 4.3.1 Age HR planning for achieving targets Chi-Square 50.173a 11.333b df 3 4 Asymp. Sig. .000 .023 a.0 cells (.0%) have expected frequencies less than 5. The minimum expected cell frequency is 18.8. b.0 cells (.0%) have expected frequencies less than 5. The minimum expected cell frequency is 15.0. INTERPRETATION From the above analysis using chi-square test it is found that the table value is < than 0.05.So we reject the null hypothesis and accept the alternative hypothesis. Therefore there is significant difference among the respondents age & HR planning for achieving targets
- 89. 61 CHI-SQUARE TEST-2 RELATIONSHIP BETWEEN GENDER AND TIMELINESS PLANNING AND AUDIT FOR HR REQUIREMENTS NULL HYPOTHESIS There is no significant difference among the respondents gender and timeliness planning and audit for hr requirements ALTERNATIVE HYPOTHESIS There is a significant difference among the respondents gender and timeliness planning and audit for hr requirements TABLE NO: 4.3.2 Gender Timeliness planning and audit for hr requirements Chi-Square 40.333a 14.933b df 1 4 Asymp. Sig. .000 .005 a.0 cells (.0%) have expected frequencies less than 5. The minimum expected cell frequency is 37.5. b. 0 cells (.0%) have expected frequencies less than 5. The minimum expected cell frequency is 15.0. INTERPRETATION From the above analysis using chi-square test it is found that the table vale is < than 0.05 so we reject the null hypothesis and accept the alternative hypothesis. Therefore there is significant difference among the gender and timeliness planning and audit for hr requirements
- 90. 62 CHI-SQUARE TEST-3 RELATIONSHIP BETWEEN EXPERIENCE OF THE RESPOND AND LEAVES & OVERTIME OF THE EMPLOYEES IN HR AUDIT PROCESS NULL HYPOTHESIS There is a significant difference among the experience of the respond and leaves & overtime of the employees in hr audit process. ALTERNATIVE HYPOTHESIS There is no significant difference among experience of the respond and leaves & overtime of the employees in hr audit process. TABLE NO: 4.3.3 Experience of the respond Leaves & overtime of the employees in hr audit process. Chi-Square 26.920a 17.333b df 3 4 Asymp. Sig. .000 .002 a.0 cells (.0%) have expected frequencies less than 5. The minimum expected cell frequency is 18.8. b.0 cells (.0%) have expected frequencies less than 5. The minimum expected cell frequency is 15.0. INTERPRETATION From the above analysis using chi-square test it is found that the table vale is < than 0.05. So we reject the null hypothesis and accept the alternative hypothesis. Therefore there is significant difference among the experience of the respond and leaves & overtime of the employees in hr audit process.
- 91. 63 CHI-SQUARE TEST-4 RELATIONSHIP BETWEEN RESPONDENTS AGE AND WHICH METHOD SHOULD BE USED FOR RECRUITMENT NULL HYPOTHESIS There is a significant difference among the respondents age and which method should be used for recruitment alternative hypothesis There is no significant difference among the respondents age and which method should be used for recruitment alternative hypothesis TABLE NO: 4.3.4 Respondents age Method should be used for recruitment Chi-Square 50.173a 1.467b df 3 4 Asymp. Sig. .000 .833 a.0 cells (.0%) have expected frequencies less than 5. The minimum expected cell frequency is 18.8. b 0 cells (.0%) have expected frequencies less than 5. The minimum expected cell frequency is 15.0. INTERPRETATION From the above analysis using chi-square test it is found that the table value is > than0.05. So we accept the null hypothesis and reject the alternative hypothesis. Therefore there is significant difference among the respondents age and which method should be used for recruitment alternative hypothesis.
- 92. 64 CHI-SQUARE TEST-5 RELATIONSHIP BETWEEN RESPONDENTS EDUCATION QUALIFICATION AND RECRUITMENT & SELECTION PROCESS EFFICIENCY IN THE ORGANISATION ACTIVITIES NULL HYPOTHESIS There is a significant difference among the respondents education qualification and recruitment & selection process efficiency in the organisation activities. ALTERNATIVE HYPOTHESIS There is no significant difference among the respondents education qualification and recruitment & selection process efficiency in the organisation activities. TABLE NO: 4.3.5 Respondents education qualification Efficiency in the organisation activities Chi-Square 47.120a 19.733b df 2 4 Asymp. Sig. .000 .001 a.0 cells (.0%) have expected frequencies less than 5. The minimum expected cell frequency is 25.0. b.0 cells (.0%) have expected frequencies less than 5. The minimum expected cell frequency is 15.0. INTERPRETATION From the above analysis using chi-square test it is found that the table value is < than 0.05.So we reject the null hypothesis and accept the alternative hypothesis. Therefore there is significant difference among education qualification and recruitment & selection process efficiency in the organisation activities.
- 93. FINDINGS
- 94. 64 CHAPTER-5 5.1 FINDINGS Majority 55 of the respondents age is between 26-30yrs. Most 87 of the respondents belong to male category. Most 71 of the respondents are Under Graduate. Majority 44 of the response experience is 2-5 years. Majority 33 of the respondents say good to the HR planning for achieving targets. Majority 33 of the respondents satisfied the timeliness planning and audit for hr requirements. Majority 32 of the respondents are agree with that the adequate pool of employees after HR planning process. Majority 33 of the respondents says often HR planning according to the skills, knowledge & education of existing employees. Majority 38 of the respondents are agree with the work evenly distributed among the employee. Majority 40 of the respondents are neutral with the HR train & hiring employees. Majority 36 of the respondents rate three for HR finds good candidates from non- traditional sources when necessary. Majority 35 of the respondents are agree with the comprehensive job-descriptions for all said positions. Majority 36 of the respondents are neutral with the well-managed and prepared to meet potential challenges & opportunities work evenly distributed. Majority 33 of the respondents are neutral with the company have formal hr filing system. Majority 28 of the respondents says sometimes company keeps track of leaves, skills, employees performance, training done, experience of existing employees. Majority 32 of the respondents says sometimes the leaves & overtime of the employees in HR audit process. Majority 39 of the respondents strongly are agree with the HR climate, job satisfaction ,working conditions, employee salaries and motivational level of employees. Majority 33 of the respondents rate three for HR department’s performance in hr audit & planning process. Majority 25 of the respondents are agree with the recruitment & selection process is effective for the organizational objectives. Majority 32 of the respondents are agree with the recruitment & selection process efficiency in the organisation activities. Majority 24 of the respondents are agree with the best resources increases the efficiency on all organization department.
- 95. 65 Majority 34 of the respondents are neutral with recruitment & selection process depends on resource of recruitment. Majority 29 of the respondents says advertisement is the best source for recruitment & selection process. Majority 35 of the respondents are neutral with recruitment & selection can be increase by recruitment resources. Majority 33 of the respondents are disagree with the recruitment & selection process depends on interviews. Majority 32 of the respondents are agree with the recruitment & selection behaviour depends on recruiter. Majority 36 of the respondents are neutral with the end results of recruitment & selection process can be wrong. Majority 30 of the respondents are neutral with the interviews are the basic filter of the recruitment & selection process. Majority 25 of the respondents are agree with the different methods of interviews should be used. Majority 24 of the respondents says transfer method should be used for recruitment.
- 96. SUGGESTION
- 97. 66 5.2 SUGGESTION Human resources are the set of individuals who make up the workforce of an organization, business sectors or economy. “Human capital” is sometimes used synonymously with human resources, although human capital typically refers to a more narrow view (i.e the knowledge the individuals embody and can contribute to an organization).Likewise, other terms sometimes used include “Manpower”, “talent” , “labour”, or simply “people” . Human resource department should be more practical and efficient so that the recruitment and selection become more effective. The company should follow new technology / trends in recruitment process. HR department should give counselling to employee every month. HR department has to say company policy to employee before joining the organization.
- 98. CONCLUSION
- 99. 67 CHAPTER-6 CONCLUSION HR is playing administrative role too. Recruitment and selection in case of fresher’s are very well structured but for experienced people, it needs to be more structured. It focuses excessively on the intellectual and intelligence of people and missing the organizational fit. As it is in expansion stage, it’s improving its recruitment and selection process. So it can be concluded from above facts and findings that techniques of sourcing candidates were the prevailing sources of Recruitment in Augusta. Majority of the employees were satisfied with the recruitment process it was found that their colleagues have been also selected by the same process. It was found that Recruitment Policy of the organization is quite visible and process is followed impartially. So finally it can be concluded that organization is purely considered as people and task oriented both.
- 100. BIBLOGRAPHY
- 101. 68 CHAPTER-7 BIBLIOGRAPHY Achermann, J., Yeung, A.M. and Bommel, E. (2007) Better IT Management for Banks, The McKinsey Quarterly, retrieved on 2 February 2010. Alvesson, M. (2001) Knowledge Work: Ambiguity, Image and Identity. Human Relations, 54(7): 863-886. Bagshaw, M. (2004) Is Diversity Divisive? A Positive Training Approach. Industrial and Commercial Training 36(4): 153-157. Bamberger, P. and Meshoulam, I. (2000) Human Resource Strategy, Thousand Oaks (CA): Sage Publications Dwivedi, S. R. (2006) Managing Human Resource Personnel Management in Indian Enterprises, 2nd ed. Ekkirala, V. (2006) Human Resource Management in Cross-cultural Context Challenges and Responsibilities. HRM Review, ICFAI, Feburary: 43-50. Fahey and King, W. (1977) Environmental Scanning for Corporate Planning. Business Horizon: 61-71 Kothari, R.C. (2004) Research Methodology: Methods and Techniques, 2nd ed. New Delhi: New Age International, Ltd. Publishers. Swaminathan, S.P. and Rajkumar, S. (2008-2009) The Causes and Consequences of Human Resources Wastage (HRW) in Organizations. The Alternative, Department of Management, B.I.T. Mesra, Journal, 8(1). WEBSITE REFERENCES www.google.com www.augustahitech.com www.nwlink.com www.umich.edu www.doja.com
- 102. APPENDIX
- 103. 69 APPENDIX “TECHNIQUES OF SOURCING CANDIDATES: AN EXPLORATION OF THE CURRENT STRATEGIES OF RECRUITMENTS AT AUGUSTA HI-TECH SOFT SOLUTIONS,COIMBATORE” I, Praveen Kumar student of Kalaignarkarunanidhi Institute of Technology, Coimbatore is conducting a study on “Techniques of sourcing candidates: An exploration of the current strategies of recruitments at Augusta Hi-tech Soft Solutions ,Coimbatore ” at Hedge Equities as per the academic requirement of the university. I kindly request you to fill the necessary details asked below (Please answer the questions by a tick mark). I also assure that the details of the questionnaire will not be used for any external purpose. 1. Name of respondent : 2. Age of respondents: a. 20-25yrs b. 26-30yrs c. 31-350yrs d. 36-40 e. 40yrs&above 3. Gender : a. male b. female 4. Education qualification a. School level b. Diploma c. U.G d. P.G e. Ph.D 5.How long are you working in this organisation? a.< 1year b.2-5 yrs c.5-10yrs d.10-15yrs e. More than 15 yrs 6. Income level: a. 15000 & below b. 15001-20000 c.20001-25000 d.25000-50000 e. Above 50000 7. Mobile number: 8. Designation:
- 104. 70 9. Does the company do proper HR planning for achieving targets? a. Excellent b. Very good c. Good. d. Average e. Poor 10.The organization doing timeliness planning and audit for HR requirements a. Highly satisfied b. Satisfied c Natural d. Dissatisfied e. Highly dissatisfied 11. Does the HR provides an adequate pool of employees after HR planning process? a. Strongly agree b. Agree c. Neutral d. Disagree e. Strongly disagree 12. Do you think company is doing HR Planning according to the skills, knowledge and education of existing employees? a. Always b. Often c. Sometimes d. Rare e. Never 13. Is the work evenly distributed among the employees because of existing HR Planning Process? a. Strongly agree b. Agree c. Neutral d. Disagree e. Strongly disagree 14. Does HR train hiring employees to make the best hiring decisions? a. Strongly agree b. Agree c. Neutral d. Disagree e. Strongly disagree 15. Rate how well HR finds good candidates from non-traditional sources when necessary? a.1 b.2 c.3 d.4 e.5 16. Does the company have comprehensive job-descriptions for all said positions? a. Strongly agree b. Agree c. Neutral d. Disagree e. Strongly disagree 17. Do you think HR audit give a sense of confidence in the human resource department that it is well-managed and prepared to meet potential challenges and opportunities? a. Strongly agree b. Agree c. Neutral d. Disagree e. Strongly disagree 18. Does the company have formal HR filing system? a. Strongly agree b. Agree c. Neutral d. Disagree e. Strongly disagree 19. Does the company keeps track of leaves, skills, employees performance, training done, experience of existing employees? a. Always b. Often c. Sometimes d. Rare e. Never
- 105. 71 20.Does the company consider leaves and overtime of the employees in HR audit process? a. Always b. Often c. Sometimes d. Rare e. Never 21. Does HR climate, Job satisfaction ,working conditions, employee salaries and motivational level of employees are also considered in HR audit process? a. Strongly agree b. Agree c. Neutral d. Disagree e. Strongly disagree 22.How would you rate the HR department’s performance in HR audit & planning process? a.1 b.2 c.3 d.4 e.5 23. Recruitment & selection process is effective for the organizational objectives? a. Strongly agree b. Agree c. Neutral d. Disagree e. Strongly disagree 24. Recruitment & Selection process efficiency in the organisation activities? a. Strongly agree b. Agree c. Neutral d. Disagree e. Strongly disagree 25.Do you think best resources increases the efficiency on all organization department? a. Strongly agree b. Agree c. Neutral d. Disagree e. Strongly disagree 26. Recruitment & Selection process depends on resource of recruitment? a. Strongly agree b. Agree c. Neutral d. Disagree e. Strongly disagree 27. According to you which is the best source for Recruitment & Selection process? a. Promotion b. Transfer c. Advertisements d. Campus recruitment e. Placement agencies 28.Better result of Recruitment & Selection can be increase by recruitment resources? a. Strongly agree b. Agree c. Neutral d. Disagree e. Strongly disagree 29. Recruitment & Selection process depends on interviews? a. Strongly agree b. Agree c. Neutral d. Disagree e. Strongly disagree 30. Recruitment & Selection behaviour depends on recruiter? a. Strongly agree b. Agree c. Neutral d. Disagree e. Strongly disagree
- 106. 72 31.End results of Recruitment & Selection process can be wrong because of recruiters? a. Strongly agree b. Agree c. Neutral d. Disagree e. Strongly disagree 32.Intereviews are the basic filter of the Recruitment & Selection process? a. Strongly agree b. Agree c. Neutral d. Disagree e. Strongly disagree 33.Different methods of interviews should be used? a. Strongly agree b. Agree c. Neutral d. Disagree e. Strongly disagree 34.Which method should be used for recruitment? a. Promotion b. Transfer c. Advertisements d. Campus recruitment e. Placement agencies