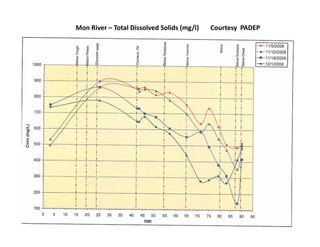
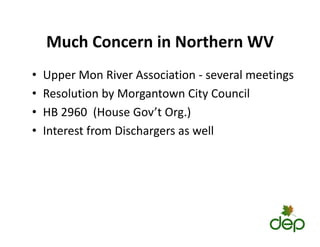
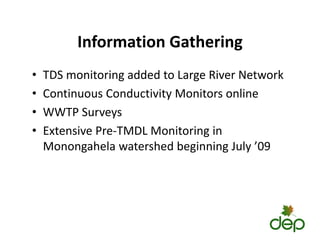
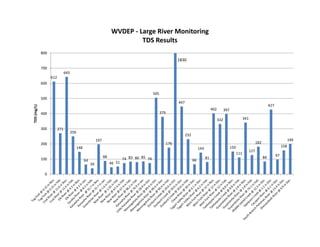
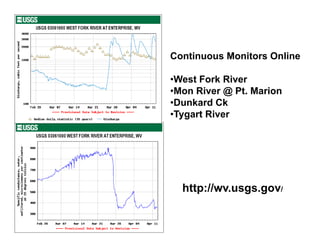
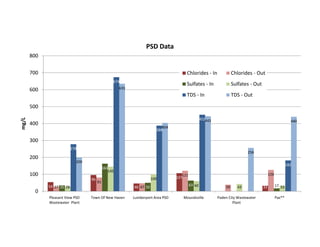
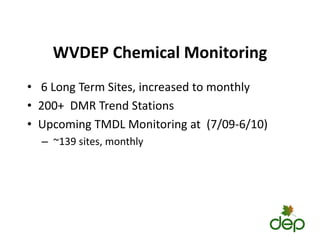
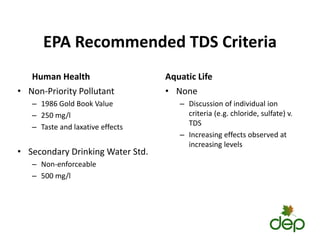
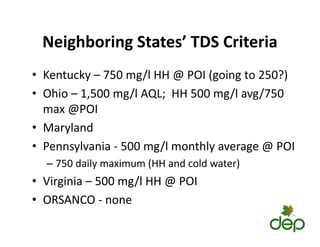
TDS – Total Dissolved Solids
TDS Total Dissolved Solids
Patrick Campbell, DEP‐DWWM
M 18 2009
May 18, 2009
What is TDS?
• Total Dissolved Solids (milligrams per liter) (mg/l)
– Amount of dissolved matter in water
Amount of dissolved matter in water
– Ocean water 35,000 mg/l
Fresh water normally less than 100 mg/l
– Fresh water normally less than 100 mg/l
– Rain less than 10 mg/l
St l l t d / d ti it
• Strongly correlated w/ conductivity
– e.g. TDS 500 mg/l ~= Conductivity 750 µs/cm (~66%)
• PA WQ Standard to protect drinking water use =
500 mg/l Monthly Avg. / 750 maximum
Mon River – Total Dissolved Solids (mg/l) Courtesy PADEP
Much Concern in Northern WV
• Upper Mon River Association ‐ several meetings
Upper Mon River Association several meetings
• Resolution by Morgantown City Council
2960 ( G ’ O )
• HB 2960 (House Gov’t Org.)
• Interest from Dischargers as well
Information Gathering
• TDS monitoring added to Large River Network
TDS monitoring added to Large River Network
• Continuous Conductivity Monitors online
S
• WWTP Surveys
• Extensive Pre‐TMDL Monitoring in
Monongahela watershed beginning July ’09
WVDEP ‐ Large River Monitoring
TDS Results
612
643
700
800
1830
612
505
447
02
427
500
600
/L)
271
250
197
379
232
402
332
397
341
199
300
400
TDS
(mg/
148
64
39
197
88
46 51
74 83 80 85 74
176
66
143
81
150
111
127
182
84 97
158
199
100
200
0
Continuous Monitors Online
W t F k Ri
•West Fork River
•Mon River @ Pt. Marion
•Dunkard Ck
•Tygart River
http://wv.usgs.gov/
PSD Data
700
800
PSD Data
Chlorides ‐ In Chlorides ‐ Out
674
635
500
600
Sulfates ‐ In Sulfates ‐ Out
TDS ‐ In TDS ‐ Out
388
452
404
443 440
300
400
500
mg/L
163
145
278
182
200
256
200
300
54
96
46
107
33
27
81
47
121
39
126
35 50
63 17
28
145
100
60 43 33
0
100
Pleasant View PSD
W Pl
Town Of New Haven Lumberport Area PSD Moundsville Paden City Wastewater
Pl
Pax**
Wastewater Plant Plant
WVDEP Chemical Monitoring
• 6 Long Term Sites, increased to monthly
• 200+ DMR Trend Stations
200+ DMR Trend Stations
• Upcoming TMDL Monitoring at (7/09‐6/10)
~139 it thl
– ~139 sites, monthly
Sources of TDS
Sources of TDS
• Mines
Mines
• Landfills
d l
• Road salt
• Brine
• WWTPs
• Scrubbers
Scrubbers
• Water softeners
M h
• Many others
EPA Recommended TDS Criteria
Human Health Aquatic Life
Human Health
• Non‐Priority Pollutant
– 1986 Gold Book Value
Aquatic Life
• None
– Discussion of individual ion
– 250 mg/l
– Taste and laxative effects
criteria (e.g. chloride, sulfate) v.
TDS
– Increasing effects observed at
• Secondary Drinking Water Std.
– Non‐enforceable
increasing levels
– 500 mg/l
Neighboring States’ TDS Criteria
Neighboring States TDS Criteria
• Kentucky – 750 mg/l HH @ POI (going to 250?)
Kentucky 750 mg/l HH @ POI (going to 250?)
• Ohio – 1,500 mg/l AQL; HH 500 mg/l avg/750
max @POI
max @POI
• Maryland
• Pennsylvania ‐ 500 mg/l monthly average @ POI
– 750 daily maximum (HH and cold water)
• Virginia – 500 mg/l HH @ POI
• ORSANCO ‐ none
ORSANCO none
Next Steps
Next Steps
• Information gathering continues
Information gathering continues
• Dialogue w/ EPA
S li i i f i b /2/09
• Solicitation of input by 7/2/09
• More updates as triennial review continues
Thanks for your interest!

TDS – Total Dissolved Dissolved Solids.pdf

  • 1.
    TDS – TotalDissolved Solids TDS Total Dissolved Solids Patrick Campbell, DEP‐DWWM M 18 2009 May 18, 2009
  • 2.
    What is TDS? •Total Dissolved Solids (milligrams per liter) (mg/l) – Amount of dissolved matter in water Amount of dissolved matter in water – Ocean water 35,000 mg/l Fresh water normally less than 100 mg/l – Fresh water normally less than 100 mg/l – Rain less than 10 mg/l St l l t d / d ti it • Strongly correlated w/ conductivity – e.g. TDS 500 mg/l ~= Conductivity 750 µs/cm (~66%) • PA WQ Standard to protect drinking water use = 500 mg/l Monthly Avg. / 750 maximum
  • 3.
    Mon River –Total Dissolved Solids (mg/l) Courtesy PADEP
  • 4.
    Much Concern inNorthern WV Much Concern in Northern WV • Upper Mon River Association ‐ several meetings Upper Mon River Association several meetings • Resolution by Morgantown City Council 2960 ( G ’ O ) • HB 2960 (House Gov’t Org.) • Interest from Dischargers as well
  • 5.
    Information Gathering Information Gathering •TDS monitoring added to Large River Network TDS monitoring added to Large River Network • Continuous Conductivity Monitors online S • WWTP Surveys • Extensive Pre‐TMDL Monitoring in Monongahela watershed beginning July ’09
  • 6.
    WVDEP ‐ LargeRiver Monitoring TDS Results 612 643 700 800 1830 612 505 447 02 427 500 600 /L) 271 250 197 379 232 402 332 397 341 199 300 400 TDS (mg/ 148 64 39 197 88 46 51 74 83 80 85 74 176 66 143 81 150 111 127 182 84 97 158 199 100 200 0
  • 7.
    Continuous Monitors Online Wt F k Ri •West Fork River •Mon River @ Pt. Marion •Dunkard Ck •Tygart River http://wv.usgs.gov/
  • 8.
    PSD Data 700 800 PSD Data Chlorides‐ In Chlorides ‐ Out 674 635 500 600 Sulfates ‐ In Sulfates ‐ Out TDS ‐ In TDS ‐ Out 388 452 404 443 440 300 400 500 mg/L 163 145 278 182 200 256 200 300 54 96 46 107 33 27 81 47 121 39 126 35 50 63 17 28 145 100 60 43 33 0 100 Pleasant View PSD W Pl Town Of New Haven Lumberport Area PSD Moundsville Paden City Wastewater Pl Pax** Wastewater Plant Plant
  • 9.
    WVDEP Chemical Monitoring •6 Long Term Sites, increased to monthly • 200+ DMR Trend Stations 200+ DMR Trend Stations • Upcoming TMDL Monitoring at (7/09‐6/10) ~139 it thl – ~139 sites, monthly
  • 10.
    Sources of TDS Sourcesof TDS • Mines Mines • Landfills d l • Road salt • Brine • WWTPs • Scrubbers Scrubbers • Water softeners M h • Many others
  • 11.
    EPA Recommended TDSCriteria EPA Recommended TDS Criteria Human Health Aquatic Life Human Health • Non‐Priority Pollutant – 1986 Gold Book Value Aquatic Life • None – Discussion of individual ion – 250 mg/l – Taste and laxative effects criteria (e.g. chloride, sulfate) v. TDS – Increasing effects observed at • Secondary Drinking Water Std. – Non‐enforceable increasing levels – 500 mg/l
  • 12.
    Neighboring States’ TDSCriteria Neighboring States TDS Criteria • Kentucky – 750 mg/l HH @ POI (going to 250?) Kentucky 750 mg/l HH @ POI (going to 250?) • Ohio – 1,500 mg/l AQL; HH 500 mg/l avg/750 max @POI max @POI • Maryland • Pennsylvania ‐ 500 mg/l monthly average @ POI – 750 daily maximum (HH and cold water) • Virginia – 500 mg/l HH @ POI • ORSANCO ‐ none ORSANCO none
  • 13.
    Next Steps Next Steps •Information gathering continues Information gathering continues • Dialogue w/ EPA S li i i f i b /2/09 • Solicitation of input by 7/2/09 • More updates as triennial review continues
  • 14.
    Thanks for yourinterest!