SlideShare a Scribd company logo
Page 1 of 55
Internship Report
on
Financial Performance of Niloy Motors Limited
Submitted To
Dr. Md. Golam Morshed
Assistant Professor
Department of Business Administration
School of Business
Uttara University
Submitted By
Taskin Rahman
ID: 2193061021
Program: MBA for BBA
Batch: 50th
Major: Accounting
Department of Business Administration
Uttara University
Date of submission: August 30, 2020
Page 2 of 55
Letter of Transmittal
August 30, 2020
Dr. Md. Golam Morshed
Assistant Professor
Department of Business Administration
School of Business
Uttara University
Subject: Submission of Internship Report on “Financial Performance of Niloy Motors
Limited.”
Dear Sir,
With due respect, I am submitting my internship report on the topic “Financial Performance of
Niloy Motors Limited” which was assigned to me as a part of my MBA Program. It is pleasure
to inform you that I had already finished my internship in a reputed organization in Niloy Motors
limited. It was a great opportunity acquire knowledge and experience in respect of the functions,
procedures and operational activities other than my topic of study. This report is integrated parts
of MBA program which I am very much enrich our academic background about to enter
professional field. In preparing this report I tried my level best to accumulate relevant
information from all the available sources. I shall be highly encouraged if you are kind to receive
this internee report paper. Therefore I sincerely hope that you will appreciate my effort and I
shall be grateful if my report is accepted for the appropriate purpose.
Sincerely yours
……………………….
Taskin Rahman
ID: 2193061021
Batch: 50th
Program: MBA for BBA
Major in Accounting
Department of Business Administration
Uttara University
Page 3 of 55
Student’s Declaration
I hereby declare that the report of internship titled “Financial Performance of Niloy Motors
Limited” is prepared by me after the completing 3 months of internship in Niloy Motors limited.
I declare that this paper is my original work and prepared for academic purpose which is a part of
BBA Program.
………………………..
Taskin Rahman
ID: 2193061021
Batch: 50th
Program: MBA for BBA
Major in Accounting
Department of Business Administration
Uttara University
Page 4 of 55
Supervisor’s Declearation
This is to certify that Taskin Rahman a student of MBA, ID-2193061021, has successfully
completed his internship program on “Financial Performance of Niloy Motors Limited of
Niloy Motors limited” under my supervision for the partial fulfillment of the award of MBA
degree.
He has done his job according to my supervision and guidance. He has tried his best to do this
successfully. I think his program will help him in the future to build up his finer career.
…………………..
Dr. Md. Golam Morshed
Assistant Professor
Department of Business Administration
School of Business
Uttara University
Page 5 of 55
Acknowledgement
First I would like to express my deepest gratitude to almighty Allah for giving me the strength
and the composure to finish the report within the schedule time.
At the very outset, I am deeply indebted to my honorable supervisor Soeb Dr. Md. Golam
Morshed, Assistant Professor, Department of Business Administration of Uttara University, for
his whole- hearted supervision to me in preparing this report.
In the preparation of this report, I acknowledge the encouragement and assistance given by a
number of people from Niloy Motors Limited. Specially thanks my internship supervisor
Abdullah Al Rashed (AGM) of Niloy Motors Limited. I also grateful to all the department staffs
of Niloy Motors Limitedfor giving me helpful support.
My heartfelt gratitude goes to my friend Rashed Ahmed Rabbi for reviewing the whole report so
carefully and expertly and for giving me valuable advices and suggestions to complete the whole
report in a right manner. His suggestion and comments to make the report good one was really a
great source of sprit for me.
Page 6 of 55
Table of Content
Chapter Topic Page No.
Title Page
Letter of Transmittal
Student’s Declaration
Supervisor’s Declaration
Acknowledgement
Table of Content
Table of Table
Table of Figure
Executive Summary
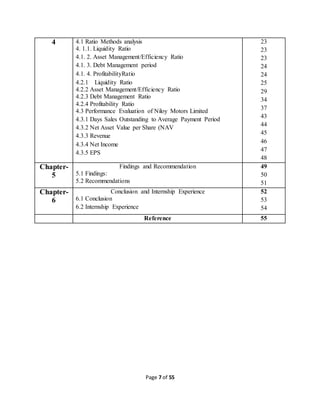
1
2
3
4
5
6-7
8
8
9
Chapter-
1
Introduction
1.1Background & Description of the Study
1.2 Objectives of the study
1.2.1 Broad Objectives
1.2.2 Specific Objectives
1.3 Major Difficulties Faced For Accomplishing Internship
1.3.1 Lack of communication
1.3.3 Lack of Time
10
11
11
11
12
12
12
12
Chapter-
2
Company Profile
2.1 Overview of Niloy Motors Limited
2.2.1. Regional Operation of NML
2.2 Mission & Vision
2.3. Structure of the Organization
2.4 Product & Service Offering
2.4.1 ProductSegment100 CC
2.4.2Product Segment 102 CC:
2.4.3 Product Segment 125 CC:
2.4.4 Product Segment 150 CC
2.10 Operational Network
13
14
14
14
15
16
16
17
17
18
10
Chapter-
3
Data Collection and Processing
3.1 Data Description
3.2 Ways of Data Collection
3.2.1 Primary source of data
3.2.2 Secondary sources of data
3.2 Data Processing
19
20
20
20
21
21
Chapter- Discussions on the Study Topic 22
Page 7 of 55
4 4.1 Ratio Methods analysis
4. 1.1. Liquidity Ratio
4.1. 2. Asset Management/Efficiency Ratio
4.1. 3. Debt Management period
4.1. 4. ProfitabilityRatio
4.2.1 Liquidity Ratio
4.2.2 Asset Management/Efficiency Ratio
4.2.3 Debt Management Ratio
4.2.4 Profitability Ratio
4.3 Performance Evaluation of Niloy Motors Limited
4.3.1 Days Sales Outstanding to Average Payment Period
4.3.2 Net Asset Value per Share (NAV
4.3.3 Revenue
4.3.4 Net Income
4.3.5 EPS
23
23
23
24
24
25
29
34
37
43
44
45
46
47
48
Chapter-
5
Findings and Recommendation
5.1 Findings:
5.2 Recommendations
49
50
51
Chapter-
6
Conclusion and Internship Experience
6.1 Conclusion
6.2 Internship Experience
52
53
54
Reference 55
Page 8 of 55
Table of Table
Topic Page No.
Table- 1: Current Ratio 25
Table 2: Working capital 26
Table 3: Cash Conversion Cycle 27
Table 4: Inventory Turnover Ratio 29
Table 5 : Total Asset Turnover Ratio 30
Table 6: Day’s Sales Outstanding 31
Table 7: Average Payment Period 32
Table 8: Debt to Asset Ratio 34
Table 9: Times Interest Earned Ratio 35
Table 10: Net Profit Margin Ratio 37
Table 11: Gross Profit Margin Ratio 38
Table 12: Operating Profit Margin Ratio 39
Table 13: Return on Equity (ROE) Ratio 40
Table 14: Days Sales outstanding to Average Payment Period 44
Figure 15: Compare NAV of Niloy Motors with other companies 45
Table 16: Compare Revenue of Niloy motors Ltd. with others company 46
Table 17: Compare Net Income of Niloy Motors with others company 47
Table of Figure
Topic Page No.
Figure- 1: Current Ratio 25
Figure 2: Working Capital 26
Figure 3: Cash Conversion Cycle 27
Figure 4: Inventory Turnover Ratio 29
Figure 5: Total Asset turnover Ratio 30
Figure 6: Day’s Sales Outstanding 31
Figure 7: Average Payment Period 32
Figure 8: Debt to Asset Ratio 34
Figure 9: Times Interest Earned Ratio 35
Figure 10: Net Profit Margin Ratio 37
Figure 11: Gross Profit Margin Ratio 38
Figure 12: Operating Profit Margin Ratio 39
Figure 13: Return on Equity (ROE) Ratio 40
Figure 14: Days Sales outstanding to Average Payment Period 44
Figure 15: Compare NAV of Niloy Motors with other companies 45
Figure 16: Compare Revenue of Niloy motors Ltd. with others company 46
Table 17: Compare Net Income of Niloy Motors with others company 47
Page 9 of 55
Executive Summery
The main focus of this report is on the Financial Statement Analysis and Performance
Evaluation of Niloy Motors Limited. In order to focus on the financial performance and
evaluation of Niloy Motors Limited, the study focuses on the financial statement and ratio
analysis, liquidity ratio, Efficiency ratio, Debt Management and Profitability and also
analyze the market position by comparing Niloy Motors Revenue, EPS, NAV, Net Income
with other ceramic companies. The study has been conducted mainly based on secondary
data. Moreover, on the study describe the internship experience and objectives of the study.
Some information has also been collected from the discussion with the officers. Trend
analyses are mainly conducted to analyze the trend of liquidities, profitability, debt
management and Efficiency of Niloy Motors Limited. Recovery performance of Niloy
Motors within the Auto Mobile industry is also analyzed in the report. Niloy Motors results
of the study shows that, increasing trend of inventory turnover ratio, gross profit margin
ratio maintaining of debt to asset ratio. Niloy Motors is in second position covers 23% of
market by their selling excellent. Proper and effective monitoring system should be
developed in order to ensure the proper maintain liquidity and to minimize the debt of
Niloy Motors Limited.
Page 10 of 55
Chapter- 01
Introduction
Page 11 of 55
1.1 Backgroundof the Study
Financial performance analysis can identify the financial strengths and weaknesses of the firm by
properly establishing the relationship between the items of balance sheet and profit and loss. It
helps a firm to identify short term and long term growth forecasting. This analysis can be
undertaken by management of the firm or by parties outside the namely, owner, creditors,
investors. Financial statement analysis involves the re-organization of the entire financial data
contained the financial statements. It is the establishment of significant relationships between the
individual components of balance sheet and profit loss account. This is done through the
application tools of financial analysis like ratio analysis, trend analysis, common size balance
sheet and comparative balance sheet. This is used for determining the investment value of the
business, credit rating and for testing efficiency of operation. Every company need to analyze
financial statement to know the performance of a company and company take their decision and
recovery procedure if need.
This internship report is prepared as a mandatory course fulfillment of the requirement of MBA
program. It is my great pleasure to permit to complete internship report on “Financial
Performance of Niloy Motors Limited”. I am student of MBA program. I sincerely believe that
my practical knowledge and experiences gathered from this study will be very helpful in my
future life for doing any types of research work.
1.2 Objective of the Study
1.2.1 Broad objective
To analyze the financial performance of Niloy Motors Limited.
1.2.2 Specific Objectives
The study includes the following specific objectives:
 To analyze the Methods of Ratio
 To Analyze the Liquidity Ratio, Asset Management/Efficiency Ratio, Debt
Management Ratio, Profitability Ratio
 To Analyze the Evaluation of Financial Performance of Niloy Motors Limited.
Page 12 of 55
1.3 Major Difficulties Faced for Accomplishing Internship
As I am doing internship at Niloy Motors Ltd. There I am identifying many problems of the
Niloy Motors also as an intern. Those are problems are described below:
1.3.1 Lack of communication
As I am doing internship there and I am working here not for long time. For this I couldn’t
introduced with the employees and staffs well which create communication gaps among us.
1.3.2 Lack of Time
As there was only three months to complete the report, it was almost impossible to cover the
performance of the account department fully, where a regular employee gets awarded after 1 or 2
years of his probationary period.
Page 13 of 55
Chapter- 02
Company Profile
Page 14 of 55
2.1 Overview of Niloy Motors Limited:
Niloy Motors Limited(NML)is sister concern of Nitol Niloy Group.NML is a HERO motorcycle
assembler and distributorcompany in Bangladesh. NML start journey from 2012 agreement with
hero motorcorp India. TheNML operatesin whole Bangladesh with 08 Region,occupiesa
leadingpositioninthe marketsof several Region and Assemble & distribution 21 Model of
Motorcycle.
Theyplayasignificantroleinlocalmotorcycle market.InBangladeshtheyare the top employerand
thecompanyofchoicefor people in all areas of our business. Theyhave 01 assembly plant, 04
warehouse (Distribution Point), 14 own showroom (whole sales & retail sale), and around 150
dealers (retail sale) and also 120 above spare parts & service center in Bangladesh.
In2016,NML is top motorcycle seller in local motorcycle market .Theyemploymore
than5000peoplein NNG & above 1000 people in NML. NML is the top VAT & customs duty
payer in local motorcycle market. Honorable Managing Director Abdul Musabbir Ahmad
Received top Tax payer award-2016 from honorable Finance minister Abul mal Abdul Mohit.
Withtheirgeographicdiversity,strong brands,talentedpeopleandprovenstrategy,theNMLis
wellplacedtoachievefurthersuccess.Inparticular,they areconfidentthattheirinvestmentsin
bothinnovative Motorcycle products.
2.2.1. Regional Operation of NML:
Theyholdrobust marketpositions in each ofthefollowingregions-
 Dhaka Region ;
 Mymensingh Region ;
 Chittagong Region ;
 Sylhet Region ;
 Jessore Region ;
 Bogra Region ;
 Rangpur Region ; and
 Barisal Region.
2.2 Mission & Vision:
2.2.1. Mission of NML:
NML's mission is to enrich the quality of life of people through responsible application of
knowledge, skills and technology. NML is committed to the pursuit of excellence through world-
class products, innovative processes and empowered employees to provide the highest level of
satisfaction to its customers.
Page 15 of 55
2.2.2. Vision of NML:
Endeavor to attain a position of leadership in each category of its businesses.
Attain a high level of productivity in all its operations through effective and efficient use of
resources, adoption of appropriate technology and alignment with our core competencies.
 Develop its employees by encouraging empowerment and rewarding innovation.
 Promote an environment for learning and personal growth of its employees.
 Provide products and services of high and consistent quality, ensuring value for money to
its customers.
 Encourage and assist in the qualitative improvement of the services of its suppliers and
distributors.
 Establish harmonious relationship with the community and promote greater
environmental responsibility within its sphere of influence.
2.3. Structure of the Organization:
Thestructureismuchdecentralizedwiththeparentcompanyretainingauthority foroverall
strategicdirectionoftheFirmandfinancialcontrol.Thefollowingfigureshowstheflowfrom theparent
companyto NML:
NITOL NILOY GROUP Parent Company
Niloy Motors Limited Sister Concern
Motorcycle Assembling Production Stage
Sales Operation Dealer Stage
Sales Operation Showroom Stage Distribution Operation
Sales Operation Corporate Stage
Structure of Niloy Motors Limited
Page 16 of 55
Figure 02: Relation of Distribution with Production
2.4 Product & Service Offering:
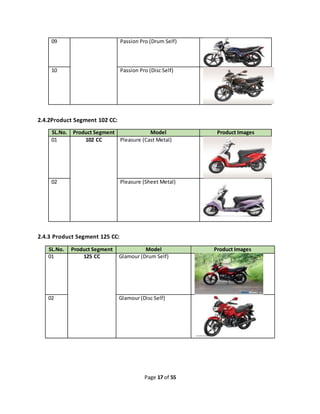
NML is assembler & distributer of Hero Motorcycle in Bangladesh. NML offering 20 different
model of motorcycle in Bangladesh motorcycle for customer. NML is strong service provide after
sale service in Bangladesh motorcycle market.
Theproduct segments and different model areshown below:
2.4.1 Product Segment 100 CC:
SL.No. Product Segment Model Product Images
01 100 CC HF Dawn (Spoke Wheel)
02 Dawn (Cast Wheel)
03 SplendorPlus(SpokeWheel)
04 Splendor Plus (Cast Wheel)
05 Splendor Pro (Cast Wheel)
06 HF Deluxe (Cast Wheel)
07 HF Deluxe (Kick Cast)
08 Splendor Ismart (Drum Self)
Page 17 of 55
09 Passion Pro (Drum Self)
10 Passion Pro (Disc Self)
2.4.2Product Segment 102 CC:
SL.No. Product Segment Model Product Images
01 102 CC Pleasure (Cast Metal)
02 Pleasure (Sheet Metal)
2.4.3 Product Segment 125 CC:
SL.No. Product Segment Model Product Images
01 125 CC Glamour (Drum Self)
02 Glamour (Disc Self)
Page 18 of 55
03 Super Splendor (Drum Self)
2.4.4 Product Segment 150 CC:
SL.No. Product Segment Model Product Images
01 150 CC Hunk (Single Disc)
02 Hunk (Double Disc)
03 Xtreme (Single Disc)
04 Xtreme (Double Disc)
05 Xtreme Sports (Single Disc)
Page 19 of 55
Chapter- 03
Data Collection and Processing
Page 20 of 55
3.1 Data Description
The study contains both primary and secondary data. Secondary data had been collected from
both internal and external sources.
Primary data sources: The executives and officer of Niloy Motors Limited.
Secondary data sources:
 Annual report of Niloy Motors Ltd.
 Website of Niloy Motors Ltd.
 Internal report.
 Different papers/ Manuals of Niloy Motors Ltd.
3.2 Ways of Data Collection
I collect my data from various ways which based on internal ways. Maximum primary data I
collected from our intern training season.There Person is trained before joining internship. Then
some of data I have collect from my job place. There are many different departments. They were
very helpful for me to collect actual data and information. And some of secondary data I
collected financial data from various web links of Niloy Motors Limited.
3.2.1 Primary source of data
 Face to face conversation: Some primary data are collected by talking interview and by
discussion with the executives and officer of Niloy Motors Limited.
 Observation: Here primary data are collected through spending three month in the Niloy
Motors Limited during the working hour. Here I observed the total financial process of
Niloy Motors Limited.
Page 21 of 55
3.2.2 Secondary sources of data
 By browsing annual report of Niloy Motors Limited.
 By browsing Website of Niloy Motors Limited.
 By browsing data collected from internal report.
 I read Different papers/ Manuals of Niloy Motors Limited.
3.2 Data Processing
The bank officials of different departments of Niloy Motors Limited and their general officers,
borrowers and account holders are considered as the sample unit for this report paper and after
their approval I added any data in my report.I used necessary number of table, chart to present
the report.
Page 22 of 55
Chapter- 04
Discussion of the Objective
Page 23 of 55
Objective- 01 To analyze the Methods of Ratio.
4.1 Ratio Methods analysis
Common methods of Farr Ceramics Ltd. is financial statement analysis include
fundamentalanalysis, horizontal and vertical analysis and the use of financial ratios. Historical
information combined with a series of assumptions and adjustments to the financial information
used to project future performance. Formulas of ratio are given below-
4. 1.1. Liquidity Ratio:
Current Assets
Current Ratio=
Current Liabilities
Working Capital= Current Assets – CurrentLiabilities
Cash conversion cycle = DSO + DIO −DPO
Days sales outstanding = 365/receivables turnover
ratio Days inventory outstanding = 365/inventory
turnover ratio Days payables outstanding =
365/payables turnover ratio Cash conversion cycle =
DSO + DIO − DPO
4.1. 2. Asset Management/Efficiency Ratio:
Cost of Goods Sold
Inventory Turnover=
Average Inventory
Days inventory outstanding = 365/inventory turnover ratio = 365/10 = 36.4 days
Page 24 of 55
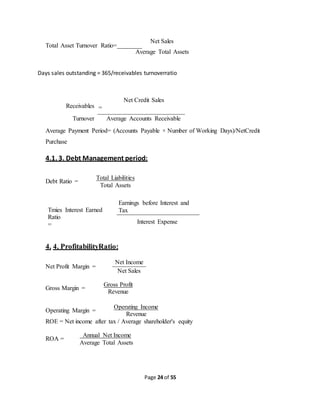
Total Asset Turnover Ratio=
Net Sales
Average Total Assets
Days sales outstanding = 365/receivables turnoverratio
Receivables
Net Credit Sales
=
Turnover Average Accounts Receivable
Average Payment Period= (Accounts Payable × Number of Working Days)/NetCredit
Purchase
4.1. 3. Debt Management period:
Debt Ratio =
Total Liabilities
Total Assets
Tmies Interest Earned
Ratio
=
Earnings before Interest and
Tax
Interest Expense
4. 4. ProfitabilityRatio:
Net Profit Margin =
Net Income
Net Sales
Gross Margin =
Gross Profit
Revenue
Operating Margin =
Operating Income
Revenue
ROE = Net income after tax / Average shareholder's equity
ROA =
Annual Net Income
Average Total Assets
Page 25 of 55
Objective- 02:to Analyze the Liquidity Ratio, AssetManagement/Efficiency
Ratio, Debt ManagementRatio, Profitability Ratio
4.2.2 Liquidity Ratio
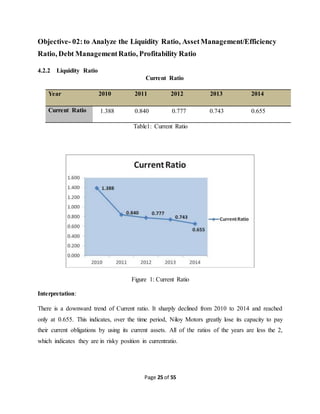
Current Ratio
Year 2010 2011 2012 2013 2014
Current Ratio 1.388 0.840 0.777 0.743 0.655
Table1: Current Ratio
Figure 1: Current Ratio
Interpretation:
There is a downward trend of Current ratio. It sharply declined from 2010 to 2014 and reached
only at 0.655. This indicates, over the time period, Niloy Motors greatly lose its capacity to pay
their current obligations by using its current assets. All of the ratios of the years are less the 2,
which indicates they are in risky position in currentratio.
Page 26 of 55
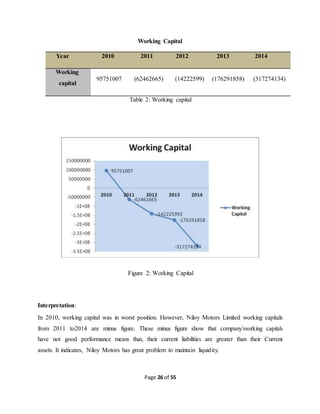
Working Capital
Year 2010 2011 2012 2013 2014
Working
capital
95751007 (62462665) (14222599) (176291858) (317274134)
Table 2: Working capital
Figure 2: Working Capital
Interpretation:
In 2010, working capital was in worst position. However, Niloy Motors Limited working capitals
from 2011 to2014 are minus figure. These minus figure show that company‟sworking capitals
have not good performance means that, their current liabilities are greater than their Current
assets. It indicates, Niloy Motors has great problem to maintain liquidity.
Page 27 of 55
Cash Conversion Cycle
Year 2010 2011 2012 2013 2014
Cash Conversion
Cycle
145 -7 74 72 46
Table 3: Cash Conversion Cycle
Figure 3: Cash Conversion Cycle
Interpretation:
Cash conversion cycle is the time it takes a company to convert its resource inputs into cash. It
measures how effectively a company is managing its working capital. We can see that, cash
conversion cycle was highly efficient in 2011 They needed -7 days to convert their assets into
cash and worst situation in 2010 when needed145days.
Page 28 of 55
Overall Interpretation of Liquidity Ratio of Niloy Motors Limited
Liquidity ratio expresses a company's ability to repay short-term creditors out of its total cash. It
is the result of dividing the total cash by short-term borrowings. It shows the number of times
short-term liabilities are covered by cash.
Ratios Interpretation Remarks
Current Ratio There is a downward trend of Current ratio Negative
Working
capital
There is a downward trend of Working capital Negative
Cash
Conversion
Cycle
There is a worst situation in cash conversion cycle except
2011.
Medium
Liquidity
Position
Overall position of liquidity is not good Negative
There is a downward trend of Current ratio, and Working capital. Again there is a worst
situation in cash conversion cycle except 2011. Hence, it can be seen that, overall position
of liquidity is not good. Niloy Motors need to take some immediate step to recovery
liquidity position.
Page 29 of 55
4.2.2 AssetManagement/EfficiencyRatio
Inventory Turnover Ratio:
Year 2010 2011 2012 2013 2014
Inventory
Turnover Ratio
3.3 3.9 2.3 2.5 3.4
Table 4: Inventory Turnover Ratio
Figure 4: Inventory Turnover Ratio
Interpretation:
Inventory Turnover Ratio measures how effectively inventory is managed by Niloy Motors
comparing cost of goods sold with average inventory for a period. Over the span of 5 years
Inventory turnover ratio was worst position in 2012 at 2.3 It implies on that time Niloy Motors
had poor sales and, therefore, excess inventory. However, in 2011 it was peak and reached 3.9,
which indicate strong sales or ineffective buying.
Page 30 of 55
Total Asset Turnover Ratio:
Year 2010 2011 2012 2013 2014
Total Asset
Turnover Ratio
57% 31% 24% 22% 35%
Table 5 : Total Asset Turnover Ratio
Figure 5: Total Asset turnover Ratio
Interpretation:
In 2010, total asset turnover ratio is 57%. After that, it declined and reached only at 22% in 2013
which means, Farr Ceramics had lower ability to generate sales from its assets during those time.
This ratio also indicates, Niloy Motors is not efficient to use its assets to generate sales.
However, it took recovery and reached 35% in2014.
Page 31 of 55
Average Collection Period/Days’ Sales Outstanding:
Year 2010 2011 2012 2013 2014
Days’ Sales
Outstanding
41.8 28.2 26.3 28.5 20.5
Table 6: Day’s Sales Outstanding
Figure 6: Day’s Sales Outstanding
Interpretation:
It shows how well a company can collect cash from its customers. The sooner cash can be
collected, the sooner this cash can be used for other operations. Both liquidity and cash flows
increase with a lower day‟s sales outstanding measurement. Niloy Motors Ltd. has a downward
trend of Days; sales outstanding. It declined from 41.8 days to 20.5days. This indicates they
increase their strange to collect cash from their customers over the time period.
Page 32 of 55
Average payment Period:
Year 2010 2011 2012 2013 2014
Average
Payment Period
252 255 221 226 160
Table 7: Average Payment Period
Figure 7: Average Payment Period
Interpretation:
Average payment period means the average period taken by the company in making payments to
its creditors. If this period will be low, it will be good for our liquidity because more smartly, we
will pay our creditors, more amount of credit purchase, we can get. From 2010 to 2013 Niloy
Motors was smartly maintain their liquidity by taking more days, 252 days and 226 days
accordingly. However, in 2014 it takes 160 days for their credit purchase which cut their risk.
Overall average payment period is in good position because its liquidity is not satisfactory.
Page 33 of 55
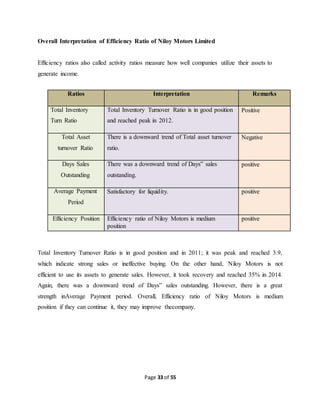
Overall Interpretation of Efficiency Ratio of Niloy Motors Limited
Efficiency ratios also called activity ratios measure how well companies utilize their assets to
generate income.
Ratios Interpretation Remarks
Total Inventory
Turn Ratio
Total Inventory Turnover Ratio is in good position
and reached peak in 2012.
Positive
Total Asset
turnover Ratio
There is a downward trend of Total asset turnover
ratio.
Negative
Days Sales
Outstanding
There was a downward trend of Days‟ sales
outstanding.
positive
Average Payment
Period
Satisfactory for liquidity. positive
Efficiency Position Efficiency ratio of Niloy Motors is medium
position
positive
Total Inventory Turnover Ratio is in good position and in 2011; it was peak and reached 3.9,
which indicate strong sales or ineffective buying. On the other hand, Niloy Motors is not
efficient to use its assets to generate sales. However, it took recovery and reached 35% in 2014.
Again, there was a downward trend of Days‟ sales outstanding. However, there is a great
strength inAverage Payment period. Overall, Efficiency ratio of Niloy Motors is medium
position if they can continue it, they may improve thecompany.
Page 34 of 55
4.2.3 DebtManagementRatio
Debt to AssetRatio:
Year 2010 2011 2012 2013 2014
Debt to Asset
Ratio
85% 58% 60% 56% 57%
Table 8: Debt to Asset Ratio
Figure 8: Debt to Asset Ratio
Interpretation:
This ratio measures the financial leverage of Niloy Motors Ltd. It fluctuated over the time period
and reached from 85% to 57%. Moreover, it is a downward trend. The company must decrease
their debt to asset ratio. Moreover, it performed greatly in 2013 at only 56%. They must lower
their debtlevel.
Page 35 of 55
Times Interest Earned (TIE) Ratio:
Year 2010 2011 2012 2013 2014
TIE 3.55 5.76 1.27 0.10 0.29
Table 9: Times Interest Earned Ratio
Figure 9: Times Interest Earned Ratio
Interpretation:
Times interest earned (TIE) ratio shows how many times the annual interest expenses are
covered by the net operating income (income before interest and tax) of the company. In 2010
and 2011 it is adequate to protect the creditors‟ interest in the firm at 3.55 times and 5, 76 times
respectively. After that, ratio is less than 1 in 2013 and 2014, means the company is likely to
have problems in paying interest on its borrowings.
Page 36 of 55
Overall Interpretation of Debt Management Ratio of Niloy Motors Ltd.
Debt Management Ratios attempt to measure the firm's use of Financial Leverage and ability to
avoid financial distress in the long run. These ratios are also known as Long-Term Solvency
Ratios.
Ratios Interpretation Remarks
Debt to Asset
Ratio
There is a downward trend of Debt to Asset Ratio.
They must lower their debt level more.
Negative
Times Interest
Earned Ratio
There is a problem in paying interest on its borrowing
after 2012.
Negative
Debt
Management
Position
Overall position of debt management is in medium
position because of times interest earned ratio.
Negative
There is a downward trend of debt to asset ratio; it indicates company has lower level of
liabilities compared with assets and considered low leveraged and low risk but need to decrease
more debt. On the other hand, times interest earned ratio is less than 1 in 2013 and 2014, means
the company is likely to have problems in paying interest on its borrowings. Hence, overall
position of debt management ratio is notgood.
Page 37 of 55
4.2.4 Profitability Ratio
Net Profit Margin Ratio:
Year 2010 2011 2012 2013 2014
Net Profit
Margin Ratio
17% 19% 11% 2% 5%
Table 10: Net Profit Margin Ratio
Figure 10: Net Profit Margin Ratio
Interpretation:
Net Profit Margin Ration of Niloy Motors increased slowly from 2010 to 2011 and reached its
peak in 2011 at 19%. After that, it dramatically declined and reached only at 2%. It means, in
2011 Niloy Motors is in high position in profitability by earned amount of net income with each
dollar of sales.Net profit margin is not in good position except 2011.
Page 38 of 55
Gross Profit Margin Ratio:
Year 2010 2011 2012 2013 2014
Gross Profit
Margin Ratio
28% 34% 32% 32% 32%
Table 11: Gross Profit Margin Ratio
Figure 11: Gross Profit Margin Ratio
Interpretation:
Gross margin ratio is a profitability ratio that compares the gross margin of a business to the net
sales. Gross Profit of Niloy Motors increased from 2010 to 2011 and reached its peak at 34% and
it remained constant at 32% from 2012 to 2014. Hence, it is in better position by improvement.
Page 39 of 55
Operating Profit Margin Ratio:
Year 2010 2011 2012 2013 2014
Operating Profit
Margin Ratio
22% 26% 24% 2% 6%
Table 12: Operating Profit Margin Ratio
Figure 12: Operating Profit Margin Ratio
Interpretation:
Operating Profit Margin Ratio of Niloy Motors fluctuated over the time, it increased 2010 to
2011 and reached 26% which is higher value and favorable for company, indicates which
indicates that more proportion of revenue is converted to operating income then it fall by 2%. It
dramatically declined in 2013 and reached only at 2%. It recovers and reached 6% in 2014 that
the profitability is improving. Overall operating profit margin ratio is good position except 2013.
Page 40 of 55
Return On Equity (ROE) Ratio:
Year 2010 2011 2012 2013 2014
ROERatio 32% 7% 3% 0% 2%
Table 13: Return on Equity (ROE) Ratio
Figure 13: Return on Equity (ROE) Ratio
Interpretation:
There is a downward trend of Return on Equity ratio. It dramatically falls from 2010 to 2011 and
reached 7% only and then slowly declined till 2013 and gone to 0% then it recovered and
reached 2%. It indicates ability of Niloy Motors to generate profits from its shareholder
investment getting worse on the time period, which is harmful for thecompany.
Page 41 of 55
Return On Asset (ROE) Ratio:
Year 2010 2011 2012 2013 2014
ROARatio 10% 6% 3% 0% 2%
Table4.4.5: Return on Asset (ROA) Ratio
Figure.4.4.5: Return on Asset (ROA) Ratio
Interpretation:
It emerge that, over the span of five years, return on asset of Niloy Motors dramatically declined
and gone to zero in 2013. Furthermore, it increased by only 2% in 2014. It indicates, net income
produced by total assets is getting worse year by year. Hence, Niloy Motors is not efficient
company to manage its assets to generateprofits.
Page 42 of 55
Overall Interpretation of Profitability Ratio of Niloy Motors
Profitability is simply the capacity to make a profit, and a profit is what is left over from
income earned after you have deducted all costs and expenses related to earning the income.
Ratios Interpretation Remarks
Net Profit Margin
Ratio
Net profit margin is not in good position except 2011 Positive
Gross Profit
Margin Ratio
There is a increasing trend in gross profit margin ratio
it remain constant from 2012 to 2014
Positive
Operating profit
Marin Ratio
Overall operating profit margin ratio is good except
2013.
Positive
Return on Equity
ratio
There is a downward trend of Return on Equity ratio Negative
Return on Asset
Ratio
There is a downward trend of Return on Asset Ratio Negative
Profitability
Position
Overall position is good except ROA and ROE Positive
Niloy Motors is in high position in profitability by earned amount of net income with each dollar
of sales in 2011 but it is worst in other year’s position except 2011. On the other hand, Gross
Profit Margin Ratio is in better position by improvement. Operating Profit Margin Ratio of Niloy
Motors fluctuated over the time and overall operating profit margin ratio is good position except
2013. Moreover, Niloy Motors generates profits from its shareholder investment getting worse
on the time period. Hence, in profitability, Niloy Motors is good enough and they need to
concentrate more about their Equity, Assets andsales.
Page 43 of 55
Objective- 03: To Analyze the Evaluation of Financial Performance of Niloy Motors
Limited.
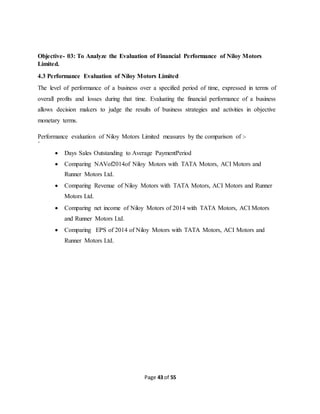
4.3 Performance Evaluation of Niloy Motors Limited
The level of performance of a business over a specified period of time, expressed in terms of
overall profits and losses during that time. Evaluating the financial performance of a business
allows decision makers to judge the results of business strategies and activities in objective
monetary terms.
Performance evaluation of Niloy Motors Limited measures by the comparison of :-
`
 Days Sales Outstanding to Average PaymentPeriod
 Comparing NAVof2014of Niloy Motors with TATA Motors, ACI Motors and
Runner Motors Ltd.
 Comparing Revenue of Niloy Motors with TATA Motors, ACI Motors and Runner
Motors Ltd.
 Comparing net income of Niloy Motors of 2014 with TATA Motors, ACI Motors
and Runner Motors Ltd.
 Comparing EPS of 2014 of Niloy Motors with TATA Motors, ACI Motors and
Runner Motors Ltd.
Page 44 of 55
4.3.1 Days Sales Outstanding to Average Payment Period
Year 2010 2011 2012 2013 2014
Days’ Sales
Outstanding
41.8 28.2 26.3 28.5 20.5
Average
Payment Period
252 255 221 226 160
Table 14: Days Sales outstanding to Average Payment Period
Figure 14: Days Sales outstanding to Average Payment Period
Interpretation:
Days sales outstanding declined over the period that indicates they increase their strange to
collect cash from their customers and it increase liquidity and cash flows with a lower days. On
the other hand, Average Payment period fluctuated and it declined when the sales outstanding
declined. It indicates Niloy Motors Ltd. is highly efficient to manage their liquidity. When they
collected their cash in delay they pay to their creditors in delay, which ensure balance liquidity
and keep company risk free.
Page 45 of 55
4.3.2 Net Asset Value per Share (NAV) of 2014 of Niloy Motors, Tata Motors, ACI Motors
and Runner Motors Ltd.
Companies name Value
Niloy Motors Limited 43.52
Tata Motors Limited 95.19
ACI Motors LTD 29.02
Runner Motors LTD 13.18
Table 15: Compare NAV of Niloy Motors Ltd. with other companies
Figure 15: Compare NAV of Niloy Motors with other companies
Interpretation:
Net Asset Value per Share (NAVPS) refers to the value of a single unit, or share, or a fund.
This number for a mutual fund indicates the price at which shares are bought and sold.
Niloy Motors Ltd. is in the second position in NAV inmarket.
Niloy Motors Ltd.
TataMotors Ltd
ACI Motors Ltd.
Runner Motors Ltd.
NAV of Niloy Motors,Tata Motors, ACI Motors and Runner
Motors Ltd.
Page 46 of 55
4.3.3 Revenue of 2014 of Niloy Motors Ltd. compare with Tata Motors, ACI
Motors and Runner Motors Ltd.
Companies name Value %
Niloy Motors Limited 893863503 23%
TATA Motors Limited 692427630 17%
ACI LTD 1677657674 42%
Runner Motors LTD 692791034 18%
Table 16: Compare Revenue of Niloy Motors with others company
Table 16: Compare Revenue of Niloy motors Ltd. with others company
Interpretation:
Revenue is shown usually as the top item in an income (profit and loss)
statement from which all charges, costs, and expenses are subtracted to arrive at net income,
also called sales or turnover. The position of revenue in Niloy Motors Ltd. is second by 23%.
Niloy motors quality full product can bit the marketgreatly.
Niloy Motors Ltd.
TataMotors Ltd
ACI Motors Ltd.
Runner Motors Ltd.
Sales position of Niloy Motors in compare to others
Page 47 of 55
4.3.4 Net Income of 2014 of Niloy compare with TATA, ACI and Runners Motors Limited
Companies name Value
Niloy Motors Limited 41072321
TATA Motors Limited 2544389
ACI Motors LTD 15425038
Runner Motors LTD 41088653
Table 17: Compare Net Income of Niloy Motors Ltd. with others company
Table 17: Compare Net Income of Niloy Motors with others company
Interpretation:
The company's total earnings, reflecting revenues adjusted for costs of doing bus iness,
depreciation,interest, taxes and otherexpenses. It measures the profitability of a company. It can
be seen that, Net profit of Niloy Motors Ltd. is excellent position in the ceramics market. In 2014
its net profit exit ACI and Runner and bit to the TATA Ltd. Niloy motors earned 41072321
which are almost similar to TATA Motors Ltd.
Niloy Motors Ltd.
TataMotors Ltd
ACI Motors Ltd.
Runner Motors Ltd.
Net Income of Niloy Motors ltd. compare to others
Page 48 of 55
4.3.5 EPS of2014 of Niloy Motors compare withTATA, ACI and Runner
Motors Limited
Companies name Value
Niloy Motors Limited 0.82
TATA Motors Limited 0.11
ACI Motors LTD 0.02
Runner motors LTD 0.49
Table 5.5: Compare EPS of Niloy Motors Ltd. with others company
Table 5.5: Compare EPS of Niloy Motors with others company
Interpretation:
Earnings per share are generally considered to be the single most important variable in
determining a share's price. It is also a major component used to calculate the price- to-earnings
valuation ratio. Niloy Motors Ltd. has higher earnings per share which always better than a lower
ratio because this means the company is more profitable and the company has more profits to
distribute to its shareholders comparing to other company.
Niloy Motors Ltd.
TataMotors Ltd
ACI Motors Ltd.
Runner Motors Ltd.
EPS of Niloy Motors Compare with others
Page 49 of 55
Chapter- 05
Findings and Recommendation
Page 50 of 55
5.1 Findings:
The study, Financial Statement Analysis and Performance Evaluation of Farr Ceramics Limited,
reveals the following majors findings:
 Niloy Motors greatly lose its capacity to pay their current obligations by using its current
assets, which indicates they are in risky position in currentratio.
 Niloy Motors current liabilities are greater than their Current assets. It indicates, Niloy
Motors has great problem to maintainliquidity.
 Cash conversion cycle was highly efficient in 2011 They needed -7 days to convert their
assets into cash and worst situation in 2010 when needed145days.
 Ni;loy Motors has lower ability to generate sales from its assets during 2010 to2014.
 Niloy Motors has lower level of liabilities compared with assets and considered low
leveraged and low risk. Moreover, it performed greatly in 2013 at only56%.
 After 2012 Times Interest Earned ratio is less than 1, means the company is likely to have
problems in paying interest on itsborrowings.
 Net profit margin of Niloy Motors Ltd. is not in good position except2011.
 Gross Profit of Niloy Motors Ltd. increased from 2010 to 2011 and reached its peak at
34% and it remained constant at 32% from 2012 to2014
 Ability of Niloy Motors Ltd to generate profits from its shareholders investment getting
worse on the time period, which is harmful for the company and at the same time net
income produced by total assets, is getting worse year byyear.
 When Niloy Motors Ltd collected their cash in delay, they pay to their creditors in delay,
which ensure balance liquidity and keep company riskfree.
 Niloy Motors Ltd is in the second position in NAV and revenues in themarket
 In 2014 its net profit exit ACI and Runner Motors and bit to the TATA Motors Ltd. Niloy
Motors Ltd earned 41072321 which are almost similar to TATA Motors.
 Niloy Motors Ltd has higher earnings per share which always better than a lower ratio
because this means the company is more profitable and the company has more profits to
distribute to its shareholders comparing to othercompany
Page 51 of 55
5.2 Recommendation:
The Financial Statement Analysis and Performance Evaluation of Niloy Motors Ltd. require the
following recommendation that may help the Niloy Motors Ltd. to improve financial Performace
and to be a key member in the ceramic sector of Bangladesh:
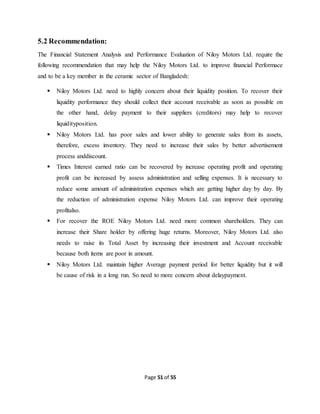
 Niloy Motors Ltd. need to highly concern about their liquidity position. To recover their
liquidity performance they should collect their account receivable as soon as possible on
the other hand, delay payment to their suppliers (creditors) may help to recover
liquidityposition.
 Niloy Motors Ltd. has poor sales and lower ability to generate sales from its assets,
therefore, excess inventory. They need to increase their sales by better advertisement
process anddiscount.
 Times Interest earned ratio can be recovered by increase operating profit and operating
profit can be increased by assess administration and selling expenses. It is necessary to
reduce some amount of administration expenses which are getting higher day by day. By
the reduction of administration expense Niloy Motors Ltd. can improve their operating
profitalso.
 For recover the ROE Niloy Motors Ltd. need more common shareholders. They can
increase their Share holder by offering huge returns. Moreover, Niloy Motors Ltd. also
needs to raise its Total Asset by increasing their investment and Account receivable
because both items are poor in amount.
 Niloy Motors Ltd. maintain higher Average payment period for better liquidity but it will
be cause of risk in a long run. So need to more concern about delaypayment.
Page 52 of 55
Chapter- 06
Conclusion and Internship Experience
Page 53 of 55
6.1 Conclusion:
Niloy Motors Ltd. is one of the private limited company in the Motors industry in Bangladesh,
which commenced in 2005. The study concentrated on the financial performance evaluation. The
products line of Nitol Niloy Groupwhich is much diversified in terms of items and designs. It has
been able to develop house brands namely PARR Euro Fine Porcelain Tableware. Niloy Motors
Ltd. has tremendous problem in maintaining liquidity but they try to main it by delay payment to
their creditors. At the same time it is not so good in debt management. However, Niloy Motors
Ltd. is highly efficient to control its inventory, creditors and sales. On the other hand, Niloy
Motors Ltd. is in high position in profitability by improving net profit, gross profit and operating
profit. Though they have problems in ROE and ROA they should recover it by giving deep
concentration. However, Comparing Net income, NAV, of Niloy Motors Ltd. of 2014 with
TATA Motors, ACI and Runner Motors Limited, it is in second position and also it already cover
23% of market by their selling. Overall it is take good position in market byimproving.
Page 54 of 55
6.2 Internship Experience
6.2.1 Description of Section Where I Intern Worked
For my internship purpose I worked in the Active of Account Department of Nitol Niloy Group’s
Niloy Motors Brach. It was my fast experience to work any organization. After completion of
academic study, all of us an organization is best opportunity to practice corporate culture and
utilize academic learning. I got the privilege to work at Niloy Motors Ltd. for a Period of 12
consecutive weeks. I experienced that every desk is assigned with specific jobs and particular
persons, I worked with, I came to learn a lot of things which will help me not only in
Professional life but also in my personal life.
6.2.2 My Experience
Research has found the following effects of interviewer experience on the interviewing process.
 I work as an Account Officer in Niloy Motors Limited
 In this job my main interest or duty is to maintain the receivable of Amar Hero project
and Making the Bank Recondition in every month.
 The invironment of my work is good
Page 55 of 55
Reference
Annual report of Niloy Motors Limited.
Project profile 2013, 2014 of Niloy Motors Limited.
Auditing report 2010, 2011, 2012, 2013 and 2014 of Niloy Motors Limited.
www.niloymotors.com

More Related Content

What's hot

Summer training project report on Internal Audit Functions and its performanc...
Summer training project report on Internal Audit Functions and its performanc...Summer training project report on Internal Audit Functions and its performanc...
Summer training project report on Internal Audit Functions and its performanc...
Debasish Phukan
 
Performance Analysis of IPDC Finance LTD in terms of Profitability, Liquidity...
Performance Analysis of IPDC Finance LTD in terms of Profitability, Liquidity...Performance Analysis of IPDC Finance LTD in terms of Profitability, Liquidity...
Performance Analysis of IPDC Finance LTD in terms of Profitability, Liquidity...
Md. Ali Ridwan
 
Project on Industrial Exposure
Project on Industrial ExposureProject on Industrial Exposure
Project on Industrial Exposure
Mouizz Shaikh
 
Selection Process Of Apparel Promoters Ltd
Selection Process  Of Apparel Promoters LtdSelection Process  Of Apparel Promoters Ltd
Selection Process Of Apparel Promoters Ltd
Ariful Saimon
 
Comparative study of financial statements
Comparative study of financial statementsComparative study of financial statements
Comparative study of financial statements
Supa Buoy
 
Applications of Statistical Techniques
Applications of Statistical TechniquesApplications of Statistical Techniques
Applications of Statistical Techniques
Mohammad Istiaq Hasan
 
Analysis of Selected stocks by using ARIMA Model
Analysis of Selected stocks by using ARIMA ModelAnalysis of Selected stocks by using ARIMA Model
Analysis of Selected stocks by using ARIMA Model
nandu makham
 
Analysis on financial performance of RSRM
Analysis on financial performance of RSRMAnalysis on financial performance of RSRM
Analysis on financial performance of RSRM
Abu Nahiyan
 
Hn3513151319
Hn3513151319Hn3513151319
Hn3513151319
IJERA Editor
 
financial statements of PIA
financial statements of PIAfinancial statements of PIA
financial statements of PIA
Neha Advani
 
Internship report on Investment Management: Evidence from Al-Arafah Islami Ba...
Internship report on Investment Management: Evidence from Al-Arafah Islami Ba...Internship report on Investment Management: Evidence from Al-Arafah Islami Ba...
Internship report on Investment Management: Evidence from Al-Arafah Islami Ba...
Abdullah Al Roman
 
SQUARE Pharmaceuticals Ltd Wholly owned subsidiary entry mode Africa Country ...
SQUARE Pharmaceuticals Ltd Wholly owned subsidiary entry mode Africa Country ...SQUARE Pharmaceuticals Ltd Wholly owned subsidiary entry mode Africa Country ...
SQUARE Pharmaceuticals Ltd Wholly owned subsidiary entry mode Africa Country ...
Shorab Hossain
 
HRM Individial Report_s3446621_NguyenQuangThuan
HRM Individial Report_s3446621_NguyenQuangThuanHRM Individial Report_s3446621_NguyenQuangThuan
HRM Individial Report_s3446621_NguyenQuangThuan
Thuan Nguyen Quang
 
Financial Statement Analysis of Square Pharmaceuticals Company Limited
Financial Statement Analysis of Square Pharmaceuticals Company LimitedFinancial Statement Analysis of Square Pharmaceuticals Company Limited
Financial Statement Analysis of Square Pharmaceuticals Company Limited
Mohammad Istiaq Hasan
 
Summer Internship Report (Shekhar Chandra) (CA)
Summer Internship Report (Shekhar Chandra) (CA)Summer Internship Report (Shekhar Chandra) (CA)
Summer Internship Report (Shekhar Chandra) (CA)
AakashBhalla2
 
Tt pump operator cum mechanic
Tt pump operator cum mechanicTt pump operator cum mechanic
Tt pump operator cum mechanic
Atish Verma
 
Cts pump operator cum mechanic
Cts pump operator cum mechanicCts pump operator cum mechanic
Cts pump operator cum mechanic
Atish Verma
 

What's hot (18)

Summer training project report on Internal Audit Functions and its performanc...
Summer training project report on Internal Audit Functions and its performanc...Summer training project report on Internal Audit Functions and its performanc...
Summer training project report on Internal Audit Functions and its performanc...
 
Performance Analysis of IPDC Finance LTD in terms of Profitability, Liquidity...
Performance Analysis of IPDC Finance LTD in terms of Profitability, Liquidity...Performance Analysis of IPDC Finance LTD in terms of Profitability, Liquidity...
Performance Analysis of IPDC Finance LTD in terms of Profitability, Liquidity...
 
Project on Industrial Exposure
Project on Industrial ExposureProject on Industrial Exposure
Project on Industrial Exposure
 
Selection Process Of Apparel Promoters Ltd
Selection Process  Of Apparel Promoters LtdSelection Process  Of Apparel Promoters Ltd
Selection Process Of Apparel Promoters Ltd
 
Comparative study of financial statements
Comparative study of financial statementsComparative study of financial statements
Comparative study of financial statements
 
Applications of Statistical Techniques
Applications of Statistical TechniquesApplications of Statistical Techniques
Applications of Statistical Techniques
 
Analysis of Selected stocks by using ARIMA Model
Analysis of Selected stocks by using ARIMA ModelAnalysis of Selected stocks by using ARIMA Model
Analysis of Selected stocks by using ARIMA Model
 
Analysis on financial performance of RSRM
Analysis on financial performance of RSRMAnalysis on financial performance of RSRM
Analysis on financial performance of RSRM
 
Hn3513151319
Hn3513151319Hn3513151319
Hn3513151319
 
financial statements of PIA
financial statements of PIAfinancial statements of PIA
financial statements of PIA
 
Internship report on Investment Management: Evidence from Al-Arafah Islami Ba...
Internship report on Investment Management: Evidence from Al-Arafah Islami Ba...Internship report on Investment Management: Evidence from Al-Arafah Islami Ba...
Internship report on Investment Management: Evidence from Al-Arafah Islami Ba...
 
SQUARE Pharmaceuticals Ltd Wholly owned subsidiary entry mode Africa Country ...
SQUARE Pharmaceuticals Ltd Wholly owned subsidiary entry mode Africa Country ...SQUARE Pharmaceuticals Ltd Wholly owned subsidiary entry mode Africa Country ...
SQUARE Pharmaceuticals Ltd Wholly owned subsidiary entry mode Africa Country ...
 
HRM Individial Report_s3446621_NguyenQuangThuan
HRM Individial Report_s3446621_NguyenQuangThuanHRM Individial Report_s3446621_NguyenQuangThuan
HRM Individial Report_s3446621_NguyenQuangThuan
 
Financial Statement Analysis of Square Pharmaceuticals Company Limited
Financial Statement Analysis of Square Pharmaceuticals Company LimitedFinancial Statement Analysis of Square Pharmaceuticals Company Limited
Financial Statement Analysis of Square Pharmaceuticals Company Limited
 
Summer Internship Report (Shekhar Chandra) (CA)
Summer Internship Report (Shekhar Chandra) (CA)Summer Internship Report (Shekhar Chandra) (CA)
Summer Internship Report (Shekhar Chandra) (CA)
 
Tt pump operator cum mechanic
Tt pump operator cum mechanicTt pump operator cum mechanic
Tt pump operator cum mechanic
 
Cts pump operator cum mechanic
Cts pump operator cum mechanicCts pump operator cum mechanic
Cts pump operator cum mechanic
 
Report presentation
Report presentationReport presentation
Report presentation
 

Similar to Taskin.docx

Internship Report
Internship ReportInternship Report
Internship ReportTapash Paul
 
Project report on Financial Statement Analysis and interpretation of A Company
Project report on Financial Statement Analysis and interpretation of A CompanyProject report on Financial Statement Analysis and interpretation of A Company
Project report on Financial Statement Analysis and interpretation of A Company
Pinkey Rana
 
Projectreportofpinkeyrana 150902165622-lva1-app6892
Projectreportofpinkeyrana 150902165622-lva1-app6892Projectreportofpinkeyrana 150902165622-lva1-app6892
Projectreportofpinkeyrana 150902165622-lva1-app6892
bhawnasingh108
 
Taskin- Presentation.pptx
Taskin- Presentation.pptxTaskin- Presentation.pptx
Taskin- Presentation.pptx
MdAhasanHabibLabu
 
Equity Share Analysis of GTPL Hathway Ltd (Internship report)
Equity Share Analysis of GTPL Hathway Ltd (Internship report)Equity Share Analysis of GTPL Hathway Ltd (Internship report)
Equity Share Analysis of GTPL Hathway Ltd (Internship report)
Gyananjaya Behera
 
Internship report on Functions and Process of SME banking of Mercantile Bank ...
Internship report on Functions and Process of SME banking of Mercantile Bank ...Internship report on Functions and Process of SME banking of Mercantile Bank ...
Internship report on Functions and Process of SME banking of Mercantile Bank ...
Tanvir Sazzad
 
General Accounting and Financial system of Dekko Accessories Limited
General Accounting and Financial system of Dekko Accessories LimitedGeneral Accounting and Financial system of Dekko Accessories Limited
General Accounting and Financial system of Dekko Accessories Limited
Md. Shumon Iftikher
 
General accounting and financial system of Dekko Accessories Limited
General accounting and financial system of Dekko Accessories LimitedGeneral accounting and financial system of Dekko Accessories Limited
General accounting and financial system of Dekko Accessories Limited
Md. Shumon Iftikher
 
General Accounting & Financial system
General Accounting & Financial systemGeneral Accounting & Financial system
General Accounting & Financial systemMd. Shumon Iftikher
 
Internship Report on “An Analysis of Financial Performance of Al-Arafah Islam...
Internship Report on “An Analysis of Financial Performance of Al-Arafah Islam...Internship Report on “An Analysis of Financial Performance of Al-Arafah Islam...
Internship Report on “An Analysis of Financial Performance of Al-Arafah Islam...
Ignatious Gomes
 
dipakwaghmarefinalproject-191111051008.pdf
dipakwaghmarefinalproject-191111051008.pdfdipakwaghmarefinalproject-191111051008.pdf
dipakwaghmarefinalproject-191111051008.pdf
Kanika513907
 
Federal Bank Project
Federal Bank ProjectFederal Bank Project
Federal Bank ProjectPaul Jose
 
Working capital ak
Working capital akWorking capital ak
Working capital ak
Akhilesh Kumar
 
Internship report-on-nrb-commercial-bank-ltd
Internship report-on-nrb-commercial-bank-ltdInternship report-on-nrb-commercial-bank-ltd
Internship report-on-nrb-commercial-bank-ltd
Hamdard University Bangladesh
 
239809541 22105138-maruti-suzuki-1
239809541 22105138-maruti-suzuki-1239809541 22105138-maruti-suzuki-1
239809541 22105138-maruti-suzuki-1
homeworkping4
 
Financial Performance Analysis
Financial Performance Analysis Financial Performance Analysis
Financial Performance Analysis
A.m. Mathavan
 
InternshipReport_Sabiha_DIIT (1).pdf
InternshipReport_Sabiha_DIIT (1).pdfInternshipReport_Sabiha_DIIT (1).pdf
InternshipReport_Sabiha_DIIT (1).pdf
MdSalimHossain4
 
FINANCIAL ANALYSIS OF RELIANCE JIO PDF.pdf
FINANCIAL ANALYSIS OF RELIANCE JIO PDF.pdfFINANCIAL ANALYSIS OF RELIANCE JIO PDF.pdf
FINANCIAL ANALYSIS OF RELIANCE JIO PDF.pdf
VismayTyagi
 
Competitive advantage By Bangladesh Commerce Bank Ltd
Competitive advantage By Bangladesh Commerce Bank LtdCompetitive advantage By Bangladesh Commerce Bank Ltd
Competitive advantage By Bangladesh Commerce Bank Ltd
Asad Saimon
 

Similar to Taskin.docx (20)

Internship Report
Internship ReportInternship Report
Internship Report
 
Fahmida rahman
Fahmida rahmanFahmida rahman
Fahmida rahman
 
Project report on Financial Statement Analysis and interpretation of A Company
Project report on Financial Statement Analysis and interpretation of A CompanyProject report on Financial Statement Analysis and interpretation of A Company
Project report on Financial Statement Analysis and interpretation of A Company
 
Projectreportofpinkeyrana 150902165622-lva1-app6892
Projectreportofpinkeyrana 150902165622-lva1-app6892Projectreportofpinkeyrana 150902165622-lva1-app6892
Projectreportofpinkeyrana 150902165622-lva1-app6892
 
Taskin- Presentation.pptx
Taskin- Presentation.pptxTaskin- Presentation.pptx
Taskin- Presentation.pptx
 
Equity Share Analysis of GTPL Hathway Ltd (Internship report)
Equity Share Analysis of GTPL Hathway Ltd (Internship report)Equity Share Analysis of GTPL Hathway Ltd (Internship report)
Equity Share Analysis of GTPL Hathway Ltd (Internship report)
 
Internship report on Functions and Process of SME banking of Mercantile Bank ...
Internship report on Functions and Process of SME banking of Mercantile Bank ...Internship report on Functions and Process of SME banking of Mercantile Bank ...
Internship report on Functions and Process of SME banking of Mercantile Bank ...
 
General Accounting and Financial system of Dekko Accessories Limited
General Accounting and Financial system of Dekko Accessories LimitedGeneral Accounting and Financial system of Dekko Accessories Limited
General Accounting and Financial system of Dekko Accessories Limited
 
General accounting and financial system of Dekko Accessories Limited
General accounting and financial system of Dekko Accessories LimitedGeneral accounting and financial system of Dekko Accessories Limited
General accounting and financial system of Dekko Accessories Limited
 
General Accounting & Financial system
General Accounting & Financial systemGeneral Accounting & Financial system
General Accounting & Financial system
 
Internship Report on “An Analysis of Financial Performance of Al-Arafah Islam...
Internship Report on “An Analysis of Financial Performance of Al-Arafah Islam...Internship Report on “An Analysis of Financial Performance of Al-Arafah Islam...
Internship Report on “An Analysis of Financial Performance of Al-Arafah Islam...
 
dipakwaghmarefinalproject-191111051008.pdf
dipakwaghmarefinalproject-191111051008.pdfdipakwaghmarefinalproject-191111051008.pdf
dipakwaghmarefinalproject-191111051008.pdf
 
Federal Bank Project
Federal Bank ProjectFederal Bank Project
Federal Bank Project
 
Working capital ak
Working capital akWorking capital ak
Working capital ak
 
Internship report-on-nrb-commercial-bank-ltd
Internship report-on-nrb-commercial-bank-ltdInternship report-on-nrb-commercial-bank-ltd
Internship report-on-nrb-commercial-bank-ltd
 
239809541 22105138-maruti-suzuki-1
239809541 22105138-maruti-suzuki-1239809541 22105138-maruti-suzuki-1
239809541 22105138-maruti-suzuki-1
 
Financial Performance Analysis
Financial Performance Analysis Financial Performance Analysis
Financial Performance Analysis
 
InternshipReport_Sabiha_DIIT (1).pdf
InternshipReport_Sabiha_DIIT (1).pdfInternshipReport_Sabiha_DIIT (1).pdf
InternshipReport_Sabiha_DIIT (1).pdf
 
FINANCIAL ANALYSIS OF RELIANCE JIO PDF.pdf
FINANCIAL ANALYSIS OF RELIANCE JIO PDF.pdfFINANCIAL ANALYSIS OF RELIANCE JIO PDF.pdf
FINANCIAL ANALYSIS OF RELIANCE JIO PDF.pdf
 
Competitive advantage By Bangladesh Commerce Bank Ltd
Competitive advantage By Bangladesh Commerce Bank LtdCompetitive advantage By Bangladesh Commerce Bank Ltd
Competitive advantage By Bangladesh Commerce Bank Ltd
 

Recently uploaded

Sample_Global Non-invasive Prenatal Testing (NIPT) Market, 2019-2030.pdf
Sample_Global Non-invasive Prenatal Testing (NIPT) Market, 2019-2030.pdfSample_Global Non-invasive Prenatal Testing (NIPT) Market, 2019-2030.pdf
Sample_Global Non-invasive Prenatal Testing (NIPT) Market, 2019-2030.pdf
Linda486226
 
一比一原版(Deakin毕业证书)迪肯大学毕业证如何办理
一比一原版(Deakin毕业证书)迪肯大学毕业证如何办理一比一原版(Deakin毕业证书)迪肯大学毕业证如何办理
一比一原版(Deakin毕业证书)迪肯大学毕业证如何办理
oz8q3jxlp
 
Adjusting primitives for graph : SHORT REPORT / NOTES
Adjusting primitives for graph : SHORT REPORT / NOTESAdjusting primitives for graph : SHORT REPORT / NOTES
Adjusting primitives for graph : SHORT REPORT / NOTES
Subhajit Sahu
 
Opendatabay - Open Data Marketplace.pptx
Opendatabay - Open Data Marketplace.pptxOpendatabay - Open Data Marketplace.pptx
Opendatabay - Open Data Marketplace.pptx
Opendatabay
 
standardisation of garbhpala offhgfffghh
standardisation of garbhpala offhgfffghhstandardisation of garbhpala offhgfffghh
standardisation of garbhpala offhgfffghh
ArpitMalhotra16
 
Malana- Gimlet Market Analysis (Portfolio 2)
Malana- Gimlet Market Analysis (Portfolio 2)Malana- Gimlet Market Analysis (Portfolio 2)
Malana- Gimlet Market Analysis (Portfolio 2)
TravisMalana
 
一比一原版(YU毕业证)约克大学毕业证成绩单
一比一原版(YU毕业证)约克大学毕业证成绩单一比一原版(YU毕业证)约克大学毕业证成绩单
一比一原版(YU毕业证)约克大学毕业证成绩单
enxupq
 
一比一原版(CBU毕业证)卡普顿大学毕业证成绩单
一比一原版(CBU毕业证)卡普顿大学毕业证成绩单一比一原版(CBU毕业证)卡普顿大学毕业证成绩单
一比一原版(CBU毕业证)卡普顿大学毕业证成绩单
nscud
 
一比一原版(TWU毕业证)西三一大学毕业证成绩单
一比一原版(TWU毕业证)西三一大学毕业证成绩单一比一原版(TWU毕业证)西三一大学毕业证成绩单
一比一原版(TWU毕业证)西三一大学毕业证成绩单
ocavb
 
Q1’2024 Update: MYCI’s Leap Year Rebound
Q1’2024 Update: MYCI’s Leap Year ReboundQ1’2024 Update: MYCI’s Leap Year Rebound
Q1’2024 Update: MYCI’s Leap Year Rebound
Oppotus
 
一比一原版(BU毕业证)波士顿大学毕业证成绩单
一比一原版(BU毕业证)波士顿大学毕业证成绩单一比一原版(BU毕业证)波士顿大学毕业证成绩单
一比一原版(BU毕业证)波士顿大学毕业证成绩单
ewymefz
 
社内勉強会資料_LLM Agents                              .
社内勉強会資料_LLM Agents                              .社内勉強会資料_LLM Agents                              .
社内勉強会資料_LLM Agents                              .
NABLAS株式会社
 
一比一原版(Adelaide毕业证书)阿德莱德大学毕业证如何办理
一比一原版(Adelaide毕业证书)阿德莱德大学毕业证如何办理一比一原版(Adelaide毕业证书)阿德莱德大学毕业证如何办理
一比一原版(Adelaide毕业证书)阿德莱德大学毕业证如何办理
slg6lamcq
 
一比一原版(IIT毕业证)伊利诺伊理工大学毕业证成绩单
一比一原版(IIT毕业证)伊利诺伊理工大学毕业证成绩单一比一原版(IIT毕业证)伊利诺伊理工大学毕业证成绩单
一比一原版(IIT毕业证)伊利诺伊理工大学毕业证成绩单
ewymefz
 
Best best suvichar in gujarati english meaning of this sentence as Silk road ...
Best best suvichar in gujarati english meaning of this sentence as Silk road ...Best best suvichar in gujarati english meaning of this sentence as Silk road ...
Best best suvichar in gujarati english meaning of this sentence as Silk road ...
AbhimanyuSinha9
 
一比一原版(CBU毕业证)不列颠海角大学毕业证成绩单
一比一原版(CBU毕业证)不列颠海角大学毕业证成绩单一比一原版(CBU毕业证)不列颠海角大学毕业证成绩单
一比一原版(CBU毕业证)不列颠海角大学毕业证成绩单
nscud
 
Ch03-Managing the Object-Oriented Information Systems Project a.pdf
Ch03-Managing the Object-Oriented Information Systems Project a.pdfCh03-Managing the Object-Oriented Information Systems Project a.pdf
Ch03-Managing the Object-Oriented Information Systems Project a.pdf
haila53
 
1.Seydhcuxhxyxhccuuxuxyxyxmisolids 2019.pptx
1.Seydhcuxhxyxhccuuxuxyxyxmisolids 2019.pptx1.Seydhcuxhxyxhccuuxuxyxyxmisolids 2019.pptx
1.Seydhcuxhxyxhccuuxuxyxyxmisolids 2019.pptx
Tiktokethiodaily
 
一比一原版(UofS毕业证书)萨省大学毕业证如何办理
一比一原版(UofS毕业证书)萨省大学毕业证如何办理一比一原版(UofS毕业证书)萨省大学毕业证如何办理
一比一原版(UofS毕业证书)萨省大学毕业证如何办理
v3tuleee
 
Machine learning and optimization techniques for electrical drives.pptx
Machine learning and optimization techniques for electrical drives.pptxMachine learning and optimization techniques for electrical drives.pptx
Machine learning and optimization techniques for electrical drives.pptx
balafet
 

Recently uploaded (20)

Sample_Global Non-invasive Prenatal Testing (NIPT) Market, 2019-2030.pdf
Sample_Global Non-invasive Prenatal Testing (NIPT) Market, 2019-2030.pdfSample_Global Non-invasive Prenatal Testing (NIPT) Market, 2019-2030.pdf
Sample_Global Non-invasive Prenatal Testing (NIPT) Market, 2019-2030.pdf
 
一比一原版(Deakin毕业证书)迪肯大学毕业证如何办理
一比一原版(Deakin毕业证书)迪肯大学毕业证如何办理一比一原版(Deakin毕业证书)迪肯大学毕业证如何办理
一比一原版(Deakin毕业证书)迪肯大学毕业证如何办理
 
Adjusting primitives for graph : SHORT REPORT / NOTES
Adjusting primitives for graph : SHORT REPORT / NOTESAdjusting primitives for graph : SHORT REPORT / NOTES
Adjusting primitives for graph : SHORT REPORT / NOTES
 
Opendatabay - Open Data Marketplace.pptx
Opendatabay - Open Data Marketplace.pptxOpendatabay - Open Data Marketplace.pptx
Opendatabay - Open Data Marketplace.pptx
 
standardisation of garbhpala offhgfffghh
standardisation of garbhpala offhgfffghhstandardisation of garbhpala offhgfffghh
standardisation of garbhpala offhgfffghh
 
Malana- Gimlet Market Analysis (Portfolio 2)
Malana- Gimlet Market Analysis (Portfolio 2)Malana- Gimlet Market Analysis (Portfolio 2)
Malana- Gimlet Market Analysis (Portfolio 2)
 
一比一原版(YU毕业证)约克大学毕业证成绩单
一比一原版(YU毕业证)约克大学毕业证成绩单一比一原版(YU毕业证)约克大学毕业证成绩单
一比一原版(YU毕业证)约克大学毕业证成绩单
 
一比一原版(CBU毕业证)卡普顿大学毕业证成绩单
一比一原版(CBU毕业证)卡普顿大学毕业证成绩单一比一原版(CBU毕业证)卡普顿大学毕业证成绩单
一比一原版(CBU毕业证)卡普顿大学毕业证成绩单
 
一比一原版(TWU毕业证)西三一大学毕业证成绩单
一比一原版(TWU毕业证)西三一大学毕业证成绩单一比一原版(TWU毕业证)西三一大学毕业证成绩单
一比一原版(TWU毕业证)西三一大学毕业证成绩单
 
Q1’2024 Update: MYCI’s Leap Year Rebound
Q1’2024 Update: MYCI’s Leap Year ReboundQ1’2024 Update: MYCI’s Leap Year Rebound
Q1’2024 Update: MYCI’s Leap Year Rebound
 
一比一原版(BU毕业证)波士顿大学毕业证成绩单
一比一原版(BU毕业证)波士顿大学毕业证成绩单一比一原版(BU毕业证)波士顿大学毕业证成绩单
一比一原版(BU毕业证)波士顿大学毕业证成绩单
 
社内勉強会資料_LLM Agents                              .
社内勉強会資料_LLM Agents                              .社内勉強会資料_LLM Agents                              .
社内勉強会資料_LLM Agents                              .
 
一比一原版(Adelaide毕业证书)阿德莱德大学毕业证如何办理
一比一原版(Adelaide毕业证书)阿德莱德大学毕业证如何办理一比一原版(Adelaide毕业证书)阿德莱德大学毕业证如何办理
一比一原版(Adelaide毕业证书)阿德莱德大学毕业证如何办理
 
一比一原版(IIT毕业证)伊利诺伊理工大学毕业证成绩单
一比一原版(IIT毕业证)伊利诺伊理工大学毕业证成绩单一比一原版(IIT毕业证)伊利诺伊理工大学毕业证成绩单
一比一原版(IIT毕业证)伊利诺伊理工大学毕业证成绩单
 
Best best suvichar in gujarati english meaning of this sentence as Silk road ...
Best best suvichar in gujarati english meaning of this sentence as Silk road ...Best best suvichar in gujarati english meaning of this sentence as Silk road ...
Best best suvichar in gujarati english meaning of this sentence as Silk road ...
 
一比一原版(CBU毕业证)不列颠海角大学毕业证成绩单
一比一原版(CBU毕业证)不列颠海角大学毕业证成绩单一比一原版(CBU毕业证)不列颠海角大学毕业证成绩单
一比一原版(CBU毕业证)不列颠海角大学毕业证成绩单
 
Ch03-Managing the Object-Oriented Information Systems Project a.pdf
Ch03-Managing the Object-Oriented Information Systems Project a.pdfCh03-Managing the Object-Oriented Information Systems Project a.pdf
Ch03-Managing the Object-Oriented Information Systems Project a.pdf
 
1.Seydhcuxhxyxhccuuxuxyxyxmisolids 2019.pptx
1.Seydhcuxhxyxhccuuxuxyxyxmisolids 2019.pptx1.Seydhcuxhxyxhccuuxuxyxyxmisolids 2019.pptx
1.Seydhcuxhxyxhccuuxuxyxyxmisolids 2019.pptx
 
一比一原版(UofS毕业证书)萨省大学毕业证如何办理
一比一原版(UofS毕业证书)萨省大学毕业证如何办理一比一原版(UofS毕业证书)萨省大学毕业证如何办理
一比一原版(UofS毕业证书)萨省大学毕业证如何办理
 
Machine learning and optimization techniques for electrical drives.pptx
Machine learning and optimization techniques for electrical drives.pptxMachine learning and optimization techniques for electrical drives.pptx
Machine learning and optimization techniques for electrical drives.pptx
 

Taskin.docx

  • 1. Page 1 of 55 Internship Report on Financial Performance of Niloy Motors Limited Submitted To Dr. Md. Golam Morshed Assistant Professor Department of Business Administration School of Business Uttara University Submitted By Taskin Rahman ID: 2193061021 Program: MBA for BBA Batch: 50th Major: Accounting Department of Business Administration Uttara University Date of submission: August 30, 2020
  • 2. Page 2 of 55 Letter of Transmittal August 30, 2020 Dr. Md. Golam Morshed Assistant Professor Department of Business Administration School of Business Uttara University Subject: Submission of Internship Report on “Financial Performance of Niloy Motors Limited.” Dear Sir, With due respect, I am submitting my internship report on the topic “Financial Performance of Niloy Motors Limited” which was assigned to me as a part of my MBA Program. It is pleasure to inform you that I had already finished my internship in a reputed organization in Niloy Motors limited. It was a great opportunity acquire knowledge and experience in respect of the functions, procedures and operational activities other than my topic of study. This report is integrated parts of MBA program which I am very much enrich our academic background about to enter professional field. In preparing this report I tried my level best to accumulate relevant information from all the available sources. I shall be highly encouraged if you are kind to receive this internee report paper. Therefore I sincerely hope that you will appreciate my effort and I shall be grateful if my report is accepted for the appropriate purpose. Sincerely yours ………………………. Taskin Rahman ID: 2193061021 Batch: 50th Program: MBA for BBA Major in Accounting Department of Business Administration Uttara University
  • 3. Page 3 of 55 Student’s Declaration I hereby declare that the report of internship titled “Financial Performance of Niloy Motors Limited” is prepared by me after the completing 3 months of internship in Niloy Motors limited. I declare that this paper is my original work and prepared for academic purpose which is a part of BBA Program. ……………………….. Taskin Rahman ID: 2193061021 Batch: 50th Program: MBA for BBA Major in Accounting Department of Business Administration Uttara University
  • 4. Page 4 of 55 Supervisor’s Declearation This is to certify that Taskin Rahman a student of MBA, ID-2193061021, has successfully completed his internship program on “Financial Performance of Niloy Motors Limited of Niloy Motors limited” under my supervision for the partial fulfillment of the award of MBA degree. He has done his job according to my supervision and guidance. He has tried his best to do this successfully. I think his program will help him in the future to build up his finer career. ………………….. Dr. Md. Golam Morshed Assistant Professor Department of Business Administration School of Business Uttara University
  • 5. Page 5 of 55 Acknowledgement First I would like to express my deepest gratitude to almighty Allah for giving me the strength and the composure to finish the report within the schedule time. At the very outset, I am deeply indebted to my honorable supervisor Soeb Dr. Md. Golam Morshed, Assistant Professor, Department of Business Administration of Uttara University, for his whole- hearted supervision to me in preparing this report. In the preparation of this report, I acknowledge the encouragement and assistance given by a number of people from Niloy Motors Limited. Specially thanks my internship supervisor Abdullah Al Rashed (AGM) of Niloy Motors Limited. I also grateful to all the department staffs of Niloy Motors Limitedfor giving me helpful support. My heartfelt gratitude goes to my friend Rashed Ahmed Rabbi for reviewing the whole report so carefully and expertly and for giving me valuable advices and suggestions to complete the whole report in a right manner. His suggestion and comments to make the report good one was really a great source of sprit for me.
  • 6. Page 6 of 55 Table of Content Chapter Topic Page No. Title Page Letter of Transmittal Student’s Declaration Supervisor’s Declaration Acknowledgement Table of Content Table of Table Table of Figure Executive Summary 1 2 3 4 5 6-7 8 8 9 Chapter- 1 Introduction 1.1Background & Description of the Study 1.2 Objectives of the study 1.2.1 Broad Objectives 1.2.2 Specific Objectives 1.3 Major Difficulties Faced For Accomplishing Internship 1.3.1 Lack of communication 1.3.3 Lack of Time 10 11 11 11 12 12 12 12 Chapter- 2 Company Profile 2.1 Overview of Niloy Motors Limited 2.2.1. Regional Operation of NML 2.2 Mission & Vision 2.3. Structure of the Organization 2.4 Product & Service Offering 2.4.1 ProductSegment100 CC 2.4.2Product Segment 102 CC: 2.4.3 Product Segment 125 CC: 2.4.4 Product Segment 150 CC 2.10 Operational Network 13 14 14 14 15 16 16 17 17 18 10 Chapter- 3 Data Collection and Processing 3.1 Data Description 3.2 Ways of Data Collection 3.2.1 Primary source of data 3.2.2 Secondary sources of data 3.2 Data Processing 19 20 20 20 21 21 Chapter- Discussions on the Study Topic 22
  • 7. Page 7 of 55 4 4.1 Ratio Methods analysis 4. 1.1. Liquidity Ratio 4.1. 2. Asset Management/Efficiency Ratio 4.1. 3. Debt Management period 4.1. 4. ProfitabilityRatio 4.2.1 Liquidity Ratio 4.2.2 Asset Management/Efficiency Ratio 4.2.3 Debt Management Ratio 4.2.4 Profitability Ratio 4.3 Performance Evaluation of Niloy Motors Limited 4.3.1 Days Sales Outstanding to Average Payment Period 4.3.2 Net Asset Value per Share (NAV 4.3.3 Revenue 4.3.4 Net Income 4.3.5 EPS 23 23 23 24 24 25 29 34 37 43 44 45 46 47 48 Chapter- 5 Findings and Recommendation 5.1 Findings: 5.2 Recommendations 49 50 51 Chapter- 6 Conclusion and Internship Experience 6.1 Conclusion 6.2 Internship Experience 52 53 54 Reference 55
  • 8. Page 8 of 55 Table of Table Topic Page No. Table- 1: Current Ratio 25 Table 2: Working capital 26 Table 3: Cash Conversion Cycle 27 Table 4: Inventory Turnover Ratio 29 Table 5 : Total Asset Turnover Ratio 30 Table 6: Day’s Sales Outstanding 31 Table 7: Average Payment Period 32 Table 8: Debt to Asset Ratio 34 Table 9: Times Interest Earned Ratio 35 Table 10: Net Profit Margin Ratio 37 Table 11: Gross Profit Margin Ratio 38 Table 12: Operating Profit Margin Ratio 39 Table 13: Return on Equity (ROE) Ratio 40 Table 14: Days Sales outstanding to Average Payment Period 44 Figure 15: Compare NAV of Niloy Motors with other companies 45 Table 16: Compare Revenue of Niloy motors Ltd. with others company 46 Table 17: Compare Net Income of Niloy Motors with others company 47 Table of Figure Topic Page No. Figure- 1: Current Ratio 25 Figure 2: Working Capital 26 Figure 3: Cash Conversion Cycle 27 Figure 4: Inventory Turnover Ratio 29 Figure 5: Total Asset turnover Ratio 30 Figure 6: Day’s Sales Outstanding 31 Figure 7: Average Payment Period 32 Figure 8: Debt to Asset Ratio 34 Figure 9: Times Interest Earned Ratio 35 Figure 10: Net Profit Margin Ratio 37 Figure 11: Gross Profit Margin Ratio 38 Figure 12: Operating Profit Margin Ratio 39 Figure 13: Return on Equity (ROE) Ratio 40 Figure 14: Days Sales outstanding to Average Payment Period 44 Figure 15: Compare NAV of Niloy Motors with other companies 45 Figure 16: Compare Revenue of Niloy motors Ltd. with others company 46 Table 17: Compare Net Income of Niloy Motors with others company 47
  • 9. Page 9 of 55 Executive Summery The main focus of this report is on the Financial Statement Analysis and Performance Evaluation of Niloy Motors Limited. In order to focus on the financial performance and evaluation of Niloy Motors Limited, the study focuses on the financial statement and ratio analysis, liquidity ratio, Efficiency ratio, Debt Management and Profitability and also analyze the market position by comparing Niloy Motors Revenue, EPS, NAV, Net Income with other ceramic companies. The study has been conducted mainly based on secondary data. Moreover, on the study describe the internship experience and objectives of the study. Some information has also been collected from the discussion with the officers. Trend analyses are mainly conducted to analyze the trend of liquidities, profitability, debt management and Efficiency of Niloy Motors Limited. Recovery performance of Niloy Motors within the Auto Mobile industry is also analyzed in the report. Niloy Motors results of the study shows that, increasing trend of inventory turnover ratio, gross profit margin ratio maintaining of debt to asset ratio. Niloy Motors is in second position covers 23% of market by their selling excellent. Proper and effective monitoring system should be developed in order to ensure the proper maintain liquidity and to minimize the debt of Niloy Motors Limited.
  • 10. Page 10 of 55 Chapter- 01 Introduction
  • 11. Page 11 of 55 1.1 Backgroundof the Study Financial performance analysis can identify the financial strengths and weaknesses of the firm by properly establishing the relationship between the items of balance sheet and profit and loss. It helps a firm to identify short term and long term growth forecasting. This analysis can be undertaken by management of the firm or by parties outside the namely, owner, creditors, investors. Financial statement analysis involves the re-organization of the entire financial data contained the financial statements. It is the establishment of significant relationships between the individual components of balance sheet and profit loss account. This is done through the application tools of financial analysis like ratio analysis, trend analysis, common size balance sheet and comparative balance sheet. This is used for determining the investment value of the business, credit rating and for testing efficiency of operation. Every company need to analyze financial statement to know the performance of a company and company take their decision and recovery procedure if need. This internship report is prepared as a mandatory course fulfillment of the requirement of MBA program. It is my great pleasure to permit to complete internship report on “Financial Performance of Niloy Motors Limited”. I am student of MBA program. I sincerely believe that my practical knowledge and experiences gathered from this study will be very helpful in my future life for doing any types of research work. 1.2 Objective of the Study 1.2.1 Broad objective To analyze the financial performance of Niloy Motors Limited. 1.2.2 Specific Objectives The study includes the following specific objectives:  To analyze the Methods of Ratio  To Analyze the Liquidity Ratio, Asset Management/Efficiency Ratio, Debt Management Ratio, Profitability Ratio  To Analyze the Evaluation of Financial Performance of Niloy Motors Limited.
  • 12. Page 12 of 55 1.3 Major Difficulties Faced for Accomplishing Internship As I am doing internship at Niloy Motors Ltd. There I am identifying many problems of the Niloy Motors also as an intern. Those are problems are described below: 1.3.1 Lack of communication As I am doing internship there and I am working here not for long time. For this I couldn’t introduced with the employees and staffs well which create communication gaps among us. 1.3.2 Lack of Time As there was only three months to complete the report, it was almost impossible to cover the performance of the account department fully, where a regular employee gets awarded after 1 or 2 years of his probationary period.
  • 13. Page 13 of 55 Chapter- 02 Company Profile
  • 14. Page 14 of 55 2.1 Overview of Niloy Motors Limited: Niloy Motors Limited(NML)is sister concern of Nitol Niloy Group.NML is a HERO motorcycle assembler and distributorcompany in Bangladesh. NML start journey from 2012 agreement with hero motorcorp India. TheNML operatesin whole Bangladesh with 08 Region,occupiesa leadingpositioninthe marketsof several Region and Assemble & distribution 21 Model of Motorcycle. Theyplayasignificantroleinlocalmotorcycle market.InBangladeshtheyare the top employerand thecompanyofchoicefor people in all areas of our business. Theyhave 01 assembly plant, 04 warehouse (Distribution Point), 14 own showroom (whole sales & retail sale), and around 150 dealers (retail sale) and also 120 above spare parts & service center in Bangladesh. In2016,NML is top motorcycle seller in local motorcycle market .Theyemploymore than5000peoplein NNG & above 1000 people in NML. NML is the top VAT & customs duty payer in local motorcycle market. Honorable Managing Director Abdul Musabbir Ahmad Received top Tax payer award-2016 from honorable Finance minister Abul mal Abdul Mohit. Withtheirgeographicdiversity,strong brands,talentedpeopleandprovenstrategy,theNMLis wellplacedtoachievefurthersuccess.Inparticular,they areconfidentthattheirinvestmentsin bothinnovative Motorcycle products. 2.2.1. Regional Operation of NML: Theyholdrobust marketpositions in each ofthefollowingregions-  Dhaka Region ;  Mymensingh Region ;  Chittagong Region ;  Sylhet Region ;  Jessore Region ;  Bogra Region ;  Rangpur Region ; and  Barisal Region. 2.2 Mission & Vision: 2.2.1. Mission of NML: NML's mission is to enrich the quality of life of people through responsible application of knowledge, skills and technology. NML is committed to the pursuit of excellence through world- class products, innovative processes and empowered employees to provide the highest level of satisfaction to its customers.
  • 15. Page 15 of 55 2.2.2. Vision of NML: Endeavor to attain a position of leadership in each category of its businesses. Attain a high level of productivity in all its operations through effective and efficient use of resources, adoption of appropriate technology and alignment with our core competencies.  Develop its employees by encouraging empowerment and rewarding innovation.  Promote an environment for learning and personal growth of its employees.  Provide products and services of high and consistent quality, ensuring value for money to its customers.  Encourage and assist in the qualitative improvement of the services of its suppliers and distributors.  Establish harmonious relationship with the community and promote greater environmental responsibility within its sphere of influence. 2.3. Structure of the Organization: Thestructureismuchdecentralizedwiththeparentcompanyretainingauthority foroverall strategicdirectionoftheFirmandfinancialcontrol.Thefollowingfigureshowstheflowfrom theparent companyto NML: NITOL NILOY GROUP Parent Company Niloy Motors Limited Sister Concern Motorcycle Assembling Production Stage Sales Operation Dealer Stage Sales Operation Showroom Stage Distribution Operation Sales Operation Corporate Stage Structure of Niloy Motors Limited
  • 16. Page 16 of 55 Figure 02: Relation of Distribution with Production 2.4 Product & Service Offering: NML is assembler & distributer of Hero Motorcycle in Bangladesh. NML offering 20 different model of motorcycle in Bangladesh motorcycle for customer. NML is strong service provide after sale service in Bangladesh motorcycle market. Theproduct segments and different model areshown below: 2.4.1 Product Segment 100 CC: SL.No. Product Segment Model Product Images 01 100 CC HF Dawn (Spoke Wheel) 02 Dawn (Cast Wheel) 03 SplendorPlus(SpokeWheel) 04 Splendor Plus (Cast Wheel) 05 Splendor Pro (Cast Wheel) 06 HF Deluxe (Cast Wheel) 07 HF Deluxe (Kick Cast) 08 Splendor Ismart (Drum Self)
  • 17. Page 17 of 55 09 Passion Pro (Drum Self) 10 Passion Pro (Disc Self) 2.4.2Product Segment 102 CC: SL.No. Product Segment Model Product Images 01 102 CC Pleasure (Cast Metal) 02 Pleasure (Sheet Metal) 2.4.3 Product Segment 125 CC: SL.No. Product Segment Model Product Images 01 125 CC Glamour (Drum Self) 02 Glamour (Disc Self)
  • 18. Page 18 of 55 03 Super Splendor (Drum Self) 2.4.4 Product Segment 150 CC: SL.No. Product Segment Model Product Images 01 150 CC Hunk (Single Disc) 02 Hunk (Double Disc) 03 Xtreme (Single Disc) 04 Xtreme (Double Disc) 05 Xtreme Sports (Single Disc)
  • 19. Page 19 of 55 Chapter- 03 Data Collection and Processing
  • 20. Page 20 of 55 3.1 Data Description The study contains both primary and secondary data. Secondary data had been collected from both internal and external sources. Primary data sources: The executives and officer of Niloy Motors Limited. Secondary data sources:  Annual report of Niloy Motors Ltd.  Website of Niloy Motors Ltd.  Internal report.  Different papers/ Manuals of Niloy Motors Ltd. 3.2 Ways of Data Collection I collect my data from various ways which based on internal ways. Maximum primary data I collected from our intern training season.There Person is trained before joining internship. Then some of data I have collect from my job place. There are many different departments. They were very helpful for me to collect actual data and information. And some of secondary data I collected financial data from various web links of Niloy Motors Limited. 3.2.1 Primary source of data  Face to face conversation: Some primary data are collected by talking interview and by discussion with the executives and officer of Niloy Motors Limited.  Observation: Here primary data are collected through spending three month in the Niloy Motors Limited during the working hour. Here I observed the total financial process of Niloy Motors Limited.
  • 21. Page 21 of 55 3.2.2 Secondary sources of data  By browsing annual report of Niloy Motors Limited.  By browsing Website of Niloy Motors Limited.  By browsing data collected from internal report.  I read Different papers/ Manuals of Niloy Motors Limited. 3.2 Data Processing The bank officials of different departments of Niloy Motors Limited and their general officers, borrowers and account holders are considered as the sample unit for this report paper and after their approval I added any data in my report.I used necessary number of table, chart to present the report.
  • 22. Page 22 of 55 Chapter- 04 Discussion of the Objective
  • 23. Page 23 of 55 Objective- 01 To analyze the Methods of Ratio. 4.1 Ratio Methods analysis Common methods of Farr Ceramics Ltd. is financial statement analysis include fundamentalanalysis, horizontal and vertical analysis and the use of financial ratios. Historical information combined with a series of assumptions and adjustments to the financial information used to project future performance. Formulas of ratio are given below- 4. 1.1. Liquidity Ratio: Current Assets Current Ratio= Current Liabilities Working Capital= Current Assets – CurrentLiabilities Cash conversion cycle = DSO + DIO −DPO Days sales outstanding = 365/receivables turnover ratio Days inventory outstanding = 365/inventory turnover ratio Days payables outstanding = 365/payables turnover ratio Cash conversion cycle = DSO + DIO − DPO 4.1. 2. Asset Management/Efficiency Ratio: Cost of Goods Sold Inventory Turnover= Average Inventory Days inventory outstanding = 365/inventory turnover ratio = 365/10 = 36.4 days
  • 24. Page 24 of 55 Total Asset Turnover Ratio= Net Sales Average Total Assets Days sales outstanding = 365/receivables turnoverratio Receivables Net Credit Sales = Turnover Average Accounts Receivable Average Payment Period= (Accounts Payable × Number of Working Days)/NetCredit Purchase 4.1. 3. Debt Management period: Debt Ratio = Total Liabilities Total Assets Tmies Interest Earned Ratio = Earnings before Interest and Tax Interest Expense 4. 4. ProfitabilityRatio: Net Profit Margin = Net Income Net Sales Gross Margin = Gross Profit Revenue Operating Margin = Operating Income Revenue ROE = Net income after tax / Average shareholder's equity ROA = Annual Net Income Average Total Assets
  • 25. Page 25 of 55 Objective- 02:to Analyze the Liquidity Ratio, AssetManagement/Efficiency Ratio, Debt ManagementRatio, Profitability Ratio 4.2.2 Liquidity Ratio Current Ratio Year 2010 2011 2012 2013 2014 Current Ratio 1.388 0.840 0.777 0.743 0.655 Table1: Current Ratio Figure 1: Current Ratio Interpretation: There is a downward trend of Current ratio. It sharply declined from 2010 to 2014 and reached only at 0.655. This indicates, over the time period, Niloy Motors greatly lose its capacity to pay their current obligations by using its current assets. All of the ratios of the years are less the 2, which indicates they are in risky position in currentratio.
  • 26. Page 26 of 55 Working Capital Year 2010 2011 2012 2013 2014 Working capital 95751007 (62462665) (14222599) (176291858) (317274134) Table 2: Working capital Figure 2: Working Capital Interpretation: In 2010, working capital was in worst position. However, Niloy Motors Limited working capitals from 2011 to2014 are minus figure. These minus figure show that company‟sworking capitals have not good performance means that, their current liabilities are greater than their Current assets. It indicates, Niloy Motors has great problem to maintain liquidity.
  • 27. Page 27 of 55 Cash Conversion Cycle Year 2010 2011 2012 2013 2014 Cash Conversion Cycle 145 -7 74 72 46 Table 3: Cash Conversion Cycle Figure 3: Cash Conversion Cycle Interpretation: Cash conversion cycle is the time it takes a company to convert its resource inputs into cash. It measures how effectively a company is managing its working capital. We can see that, cash conversion cycle was highly efficient in 2011 They needed -7 days to convert their assets into cash and worst situation in 2010 when needed145days.
  • 28. Page 28 of 55 Overall Interpretation of Liquidity Ratio of Niloy Motors Limited Liquidity ratio expresses a company's ability to repay short-term creditors out of its total cash. It is the result of dividing the total cash by short-term borrowings. It shows the number of times short-term liabilities are covered by cash. Ratios Interpretation Remarks Current Ratio There is a downward trend of Current ratio Negative Working capital There is a downward trend of Working capital Negative Cash Conversion Cycle There is a worst situation in cash conversion cycle except 2011. Medium Liquidity Position Overall position of liquidity is not good Negative There is a downward trend of Current ratio, and Working capital. Again there is a worst situation in cash conversion cycle except 2011. Hence, it can be seen that, overall position of liquidity is not good. Niloy Motors need to take some immediate step to recovery liquidity position.
  • 29. Page 29 of 55 4.2.2 AssetManagement/EfficiencyRatio Inventory Turnover Ratio: Year 2010 2011 2012 2013 2014 Inventory Turnover Ratio 3.3 3.9 2.3 2.5 3.4 Table 4: Inventory Turnover Ratio Figure 4: Inventory Turnover Ratio Interpretation: Inventory Turnover Ratio measures how effectively inventory is managed by Niloy Motors comparing cost of goods sold with average inventory for a period. Over the span of 5 years Inventory turnover ratio was worst position in 2012 at 2.3 It implies on that time Niloy Motors had poor sales and, therefore, excess inventory. However, in 2011 it was peak and reached 3.9, which indicate strong sales or ineffective buying.
  • 30. Page 30 of 55 Total Asset Turnover Ratio: Year 2010 2011 2012 2013 2014 Total Asset Turnover Ratio 57% 31% 24% 22% 35% Table 5 : Total Asset Turnover Ratio Figure 5: Total Asset turnover Ratio Interpretation: In 2010, total asset turnover ratio is 57%. After that, it declined and reached only at 22% in 2013 which means, Farr Ceramics had lower ability to generate sales from its assets during those time. This ratio also indicates, Niloy Motors is not efficient to use its assets to generate sales. However, it took recovery and reached 35% in2014.
  • 31. Page 31 of 55 Average Collection Period/Days’ Sales Outstanding: Year 2010 2011 2012 2013 2014 Days’ Sales Outstanding 41.8 28.2 26.3 28.5 20.5 Table 6: Day’s Sales Outstanding Figure 6: Day’s Sales Outstanding Interpretation: It shows how well a company can collect cash from its customers. The sooner cash can be collected, the sooner this cash can be used for other operations. Both liquidity and cash flows increase with a lower day‟s sales outstanding measurement. Niloy Motors Ltd. has a downward trend of Days; sales outstanding. It declined from 41.8 days to 20.5days. This indicates they increase their strange to collect cash from their customers over the time period.
  • 32. Page 32 of 55 Average payment Period: Year 2010 2011 2012 2013 2014 Average Payment Period 252 255 221 226 160 Table 7: Average Payment Period Figure 7: Average Payment Period Interpretation: Average payment period means the average period taken by the company in making payments to its creditors. If this period will be low, it will be good for our liquidity because more smartly, we will pay our creditors, more amount of credit purchase, we can get. From 2010 to 2013 Niloy Motors was smartly maintain their liquidity by taking more days, 252 days and 226 days accordingly. However, in 2014 it takes 160 days for their credit purchase which cut their risk. Overall average payment period is in good position because its liquidity is not satisfactory.
  • 33. Page 33 of 55 Overall Interpretation of Efficiency Ratio of Niloy Motors Limited Efficiency ratios also called activity ratios measure how well companies utilize their assets to generate income. Ratios Interpretation Remarks Total Inventory Turn Ratio Total Inventory Turnover Ratio is in good position and reached peak in 2012. Positive Total Asset turnover Ratio There is a downward trend of Total asset turnover ratio. Negative Days Sales Outstanding There was a downward trend of Days‟ sales outstanding. positive Average Payment Period Satisfactory for liquidity. positive Efficiency Position Efficiency ratio of Niloy Motors is medium position positive Total Inventory Turnover Ratio is in good position and in 2011; it was peak and reached 3.9, which indicate strong sales or ineffective buying. On the other hand, Niloy Motors is not efficient to use its assets to generate sales. However, it took recovery and reached 35% in 2014. Again, there was a downward trend of Days‟ sales outstanding. However, there is a great strength inAverage Payment period. Overall, Efficiency ratio of Niloy Motors is medium position if they can continue it, they may improve thecompany.
  • 34. Page 34 of 55 4.2.3 DebtManagementRatio Debt to AssetRatio: Year 2010 2011 2012 2013 2014 Debt to Asset Ratio 85% 58% 60% 56% 57% Table 8: Debt to Asset Ratio Figure 8: Debt to Asset Ratio Interpretation: This ratio measures the financial leverage of Niloy Motors Ltd. It fluctuated over the time period and reached from 85% to 57%. Moreover, it is a downward trend. The company must decrease their debt to asset ratio. Moreover, it performed greatly in 2013 at only 56%. They must lower their debtlevel.
  • 35. Page 35 of 55 Times Interest Earned (TIE) Ratio: Year 2010 2011 2012 2013 2014 TIE 3.55 5.76 1.27 0.10 0.29 Table 9: Times Interest Earned Ratio Figure 9: Times Interest Earned Ratio Interpretation: Times interest earned (TIE) ratio shows how many times the annual interest expenses are covered by the net operating income (income before interest and tax) of the company. In 2010 and 2011 it is adequate to protect the creditors‟ interest in the firm at 3.55 times and 5, 76 times respectively. After that, ratio is less than 1 in 2013 and 2014, means the company is likely to have problems in paying interest on its borrowings.
  • 36. Page 36 of 55 Overall Interpretation of Debt Management Ratio of Niloy Motors Ltd. Debt Management Ratios attempt to measure the firm's use of Financial Leverage and ability to avoid financial distress in the long run. These ratios are also known as Long-Term Solvency Ratios. Ratios Interpretation Remarks Debt to Asset Ratio There is a downward trend of Debt to Asset Ratio. They must lower their debt level more. Negative Times Interest Earned Ratio There is a problem in paying interest on its borrowing after 2012. Negative Debt Management Position Overall position of debt management is in medium position because of times interest earned ratio. Negative There is a downward trend of debt to asset ratio; it indicates company has lower level of liabilities compared with assets and considered low leveraged and low risk but need to decrease more debt. On the other hand, times interest earned ratio is less than 1 in 2013 and 2014, means the company is likely to have problems in paying interest on its borrowings. Hence, overall position of debt management ratio is notgood.
  • 37. Page 37 of 55 4.2.4 Profitability Ratio Net Profit Margin Ratio: Year 2010 2011 2012 2013 2014 Net Profit Margin Ratio 17% 19% 11% 2% 5% Table 10: Net Profit Margin Ratio Figure 10: Net Profit Margin Ratio Interpretation: Net Profit Margin Ration of Niloy Motors increased slowly from 2010 to 2011 and reached its peak in 2011 at 19%. After that, it dramatically declined and reached only at 2%. It means, in 2011 Niloy Motors is in high position in profitability by earned amount of net income with each dollar of sales.Net profit margin is not in good position except 2011.
  • 38. Page 38 of 55 Gross Profit Margin Ratio: Year 2010 2011 2012 2013 2014 Gross Profit Margin Ratio 28% 34% 32% 32% 32% Table 11: Gross Profit Margin Ratio Figure 11: Gross Profit Margin Ratio Interpretation: Gross margin ratio is a profitability ratio that compares the gross margin of a business to the net sales. Gross Profit of Niloy Motors increased from 2010 to 2011 and reached its peak at 34% and it remained constant at 32% from 2012 to 2014. Hence, it is in better position by improvement.
  • 39. Page 39 of 55 Operating Profit Margin Ratio: Year 2010 2011 2012 2013 2014 Operating Profit Margin Ratio 22% 26% 24% 2% 6% Table 12: Operating Profit Margin Ratio Figure 12: Operating Profit Margin Ratio Interpretation: Operating Profit Margin Ratio of Niloy Motors fluctuated over the time, it increased 2010 to 2011 and reached 26% which is higher value and favorable for company, indicates which indicates that more proportion of revenue is converted to operating income then it fall by 2%. It dramatically declined in 2013 and reached only at 2%. It recovers and reached 6% in 2014 that the profitability is improving. Overall operating profit margin ratio is good position except 2013.
  • 40. Page 40 of 55 Return On Equity (ROE) Ratio: Year 2010 2011 2012 2013 2014 ROERatio 32% 7% 3% 0% 2% Table 13: Return on Equity (ROE) Ratio Figure 13: Return on Equity (ROE) Ratio Interpretation: There is a downward trend of Return on Equity ratio. It dramatically falls from 2010 to 2011 and reached 7% only and then slowly declined till 2013 and gone to 0% then it recovered and reached 2%. It indicates ability of Niloy Motors to generate profits from its shareholder investment getting worse on the time period, which is harmful for thecompany.
  • 41. Page 41 of 55 Return On Asset (ROE) Ratio: Year 2010 2011 2012 2013 2014 ROARatio 10% 6% 3% 0% 2% Table4.4.5: Return on Asset (ROA) Ratio Figure.4.4.5: Return on Asset (ROA) Ratio Interpretation: It emerge that, over the span of five years, return on asset of Niloy Motors dramatically declined and gone to zero in 2013. Furthermore, it increased by only 2% in 2014. It indicates, net income produced by total assets is getting worse year by year. Hence, Niloy Motors is not efficient company to manage its assets to generateprofits.
  • 42. Page 42 of 55 Overall Interpretation of Profitability Ratio of Niloy Motors Profitability is simply the capacity to make a profit, and a profit is what is left over from income earned after you have deducted all costs and expenses related to earning the income. Ratios Interpretation Remarks Net Profit Margin Ratio Net profit margin is not in good position except 2011 Positive Gross Profit Margin Ratio There is a increasing trend in gross profit margin ratio it remain constant from 2012 to 2014 Positive Operating profit Marin Ratio Overall operating profit margin ratio is good except 2013. Positive Return on Equity ratio There is a downward trend of Return on Equity ratio Negative Return on Asset Ratio There is a downward trend of Return on Asset Ratio Negative Profitability Position Overall position is good except ROA and ROE Positive Niloy Motors is in high position in profitability by earned amount of net income with each dollar of sales in 2011 but it is worst in other year’s position except 2011. On the other hand, Gross Profit Margin Ratio is in better position by improvement. Operating Profit Margin Ratio of Niloy Motors fluctuated over the time and overall operating profit margin ratio is good position except 2013. Moreover, Niloy Motors generates profits from its shareholder investment getting worse on the time period. Hence, in profitability, Niloy Motors is good enough and they need to concentrate more about their Equity, Assets andsales.
  • 43. Page 43 of 55 Objective- 03: To Analyze the Evaluation of Financial Performance of Niloy Motors Limited. 4.3 Performance Evaluation of Niloy Motors Limited The level of performance of a business over a specified period of time, expressed in terms of overall profits and losses during that time. Evaluating the financial performance of a business allows decision makers to judge the results of business strategies and activities in objective monetary terms. Performance evaluation of Niloy Motors Limited measures by the comparison of :- `  Days Sales Outstanding to Average PaymentPeriod  Comparing NAVof2014of Niloy Motors with TATA Motors, ACI Motors and Runner Motors Ltd.  Comparing Revenue of Niloy Motors with TATA Motors, ACI Motors and Runner Motors Ltd.  Comparing net income of Niloy Motors of 2014 with TATA Motors, ACI Motors and Runner Motors Ltd.  Comparing EPS of 2014 of Niloy Motors with TATA Motors, ACI Motors and Runner Motors Ltd.
  • 44. Page 44 of 55 4.3.1 Days Sales Outstanding to Average Payment Period Year 2010 2011 2012 2013 2014 Days’ Sales Outstanding 41.8 28.2 26.3 28.5 20.5 Average Payment Period 252 255 221 226 160 Table 14: Days Sales outstanding to Average Payment Period Figure 14: Days Sales outstanding to Average Payment Period Interpretation: Days sales outstanding declined over the period that indicates they increase their strange to collect cash from their customers and it increase liquidity and cash flows with a lower days. On the other hand, Average Payment period fluctuated and it declined when the sales outstanding declined. It indicates Niloy Motors Ltd. is highly efficient to manage their liquidity. When they collected their cash in delay they pay to their creditors in delay, which ensure balance liquidity and keep company risk free.
  • 45. Page 45 of 55 4.3.2 Net Asset Value per Share (NAV) of 2014 of Niloy Motors, Tata Motors, ACI Motors and Runner Motors Ltd. Companies name Value Niloy Motors Limited 43.52 Tata Motors Limited 95.19 ACI Motors LTD 29.02 Runner Motors LTD 13.18 Table 15: Compare NAV of Niloy Motors Ltd. with other companies Figure 15: Compare NAV of Niloy Motors with other companies Interpretation: Net Asset Value per Share (NAVPS) refers to the value of a single unit, or share, or a fund. This number for a mutual fund indicates the price at which shares are bought and sold. Niloy Motors Ltd. is in the second position in NAV inmarket. Niloy Motors Ltd. TataMotors Ltd ACI Motors Ltd. Runner Motors Ltd. NAV of Niloy Motors,Tata Motors, ACI Motors and Runner Motors Ltd.
  • 46. Page 46 of 55 4.3.3 Revenue of 2014 of Niloy Motors Ltd. compare with Tata Motors, ACI Motors and Runner Motors Ltd. Companies name Value % Niloy Motors Limited 893863503 23% TATA Motors Limited 692427630 17% ACI LTD 1677657674 42% Runner Motors LTD 692791034 18% Table 16: Compare Revenue of Niloy Motors with others company Table 16: Compare Revenue of Niloy motors Ltd. with others company Interpretation: Revenue is shown usually as the top item in an income (profit and loss) statement from which all charges, costs, and expenses are subtracted to arrive at net income, also called sales or turnover. The position of revenue in Niloy Motors Ltd. is second by 23%. Niloy motors quality full product can bit the marketgreatly. Niloy Motors Ltd. TataMotors Ltd ACI Motors Ltd. Runner Motors Ltd. Sales position of Niloy Motors in compare to others
  • 47. Page 47 of 55 4.3.4 Net Income of 2014 of Niloy compare with TATA, ACI and Runners Motors Limited Companies name Value Niloy Motors Limited 41072321 TATA Motors Limited 2544389 ACI Motors LTD 15425038 Runner Motors LTD 41088653 Table 17: Compare Net Income of Niloy Motors Ltd. with others company Table 17: Compare Net Income of Niloy Motors with others company Interpretation: The company's total earnings, reflecting revenues adjusted for costs of doing bus iness, depreciation,interest, taxes and otherexpenses. It measures the profitability of a company. It can be seen that, Net profit of Niloy Motors Ltd. is excellent position in the ceramics market. In 2014 its net profit exit ACI and Runner and bit to the TATA Ltd. Niloy motors earned 41072321 which are almost similar to TATA Motors Ltd. Niloy Motors Ltd. TataMotors Ltd ACI Motors Ltd. Runner Motors Ltd. Net Income of Niloy Motors ltd. compare to others
  • 48. Page 48 of 55 4.3.5 EPS of2014 of Niloy Motors compare withTATA, ACI and Runner Motors Limited Companies name Value Niloy Motors Limited 0.82 TATA Motors Limited 0.11 ACI Motors LTD 0.02 Runner motors LTD 0.49 Table 5.5: Compare EPS of Niloy Motors Ltd. with others company Table 5.5: Compare EPS of Niloy Motors with others company Interpretation: Earnings per share are generally considered to be the single most important variable in determining a share's price. It is also a major component used to calculate the price- to-earnings valuation ratio. Niloy Motors Ltd. has higher earnings per share which always better than a lower ratio because this means the company is more profitable and the company has more profits to distribute to its shareholders comparing to other company. Niloy Motors Ltd. TataMotors Ltd ACI Motors Ltd. Runner Motors Ltd. EPS of Niloy Motors Compare with others
  • 49. Page 49 of 55 Chapter- 05 Findings and Recommendation
  • 50. Page 50 of 55 5.1 Findings: The study, Financial Statement Analysis and Performance Evaluation of Farr Ceramics Limited, reveals the following majors findings:  Niloy Motors greatly lose its capacity to pay their current obligations by using its current assets, which indicates they are in risky position in currentratio.  Niloy Motors current liabilities are greater than their Current assets. It indicates, Niloy Motors has great problem to maintainliquidity.  Cash conversion cycle was highly efficient in 2011 They needed -7 days to convert their assets into cash and worst situation in 2010 when needed145days.  Ni;loy Motors has lower ability to generate sales from its assets during 2010 to2014.  Niloy Motors has lower level of liabilities compared with assets and considered low leveraged and low risk. Moreover, it performed greatly in 2013 at only56%.  After 2012 Times Interest Earned ratio is less than 1, means the company is likely to have problems in paying interest on itsborrowings.  Net profit margin of Niloy Motors Ltd. is not in good position except2011.  Gross Profit of Niloy Motors Ltd. increased from 2010 to 2011 and reached its peak at 34% and it remained constant at 32% from 2012 to2014  Ability of Niloy Motors Ltd to generate profits from its shareholders investment getting worse on the time period, which is harmful for the company and at the same time net income produced by total assets, is getting worse year byyear.  When Niloy Motors Ltd collected their cash in delay, they pay to their creditors in delay, which ensure balance liquidity and keep company riskfree.  Niloy Motors Ltd is in the second position in NAV and revenues in themarket  In 2014 its net profit exit ACI and Runner Motors and bit to the TATA Motors Ltd. Niloy Motors Ltd earned 41072321 which are almost similar to TATA Motors.  Niloy Motors Ltd has higher earnings per share which always better than a lower ratio because this means the company is more profitable and the company has more profits to distribute to its shareholders comparing to othercompany
  • 51. Page 51 of 55 5.2 Recommendation: The Financial Statement Analysis and Performance Evaluation of Niloy Motors Ltd. require the following recommendation that may help the Niloy Motors Ltd. to improve financial Performace and to be a key member in the ceramic sector of Bangladesh:  Niloy Motors Ltd. need to highly concern about their liquidity position. To recover their liquidity performance they should collect their account receivable as soon as possible on the other hand, delay payment to their suppliers (creditors) may help to recover liquidityposition.  Niloy Motors Ltd. has poor sales and lower ability to generate sales from its assets, therefore, excess inventory. They need to increase their sales by better advertisement process anddiscount.  Times Interest earned ratio can be recovered by increase operating profit and operating profit can be increased by assess administration and selling expenses. It is necessary to reduce some amount of administration expenses which are getting higher day by day. By the reduction of administration expense Niloy Motors Ltd. can improve their operating profitalso.  For recover the ROE Niloy Motors Ltd. need more common shareholders. They can increase their Share holder by offering huge returns. Moreover, Niloy Motors Ltd. also needs to raise its Total Asset by increasing their investment and Account receivable because both items are poor in amount.  Niloy Motors Ltd. maintain higher Average payment period for better liquidity but it will be cause of risk in a long run. So need to more concern about delaypayment.
  • 52. Page 52 of 55 Chapter- 06 Conclusion and Internship Experience
  • 53. Page 53 of 55 6.1 Conclusion: Niloy Motors Ltd. is one of the private limited company in the Motors industry in Bangladesh, which commenced in 2005. The study concentrated on the financial performance evaluation. The products line of Nitol Niloy Groupwhich is much diversified in terms of items and designs. It has been able to develop house brands namely PARR Euro Fine Porcelain Tableware. Niloy Motors Ltd. has tremendous problem in maintaining liquidity but they try to main it by delay payment to their creditors. At the same time it is not so good in debt management. However, Niloy Motors Ltd. is highly efficient to control its inventory, creditors and sales. On the other hand, Niloy Motors Ltd. is in high position in profitability by improving net profit, gross profit and operating profit. Though they have problems in ROE and ROA they should recover it by giving deep concentration. However, Comparing Net income, NAV, of Niloy Motors Ltd. of 2014 with TATA Motors, ACI and Runner Motors Limited, it is in second position and also it already cover 23% of market by their selling. Overall it is take good position in market byimproving.
  • 54. Page 54 of 55 6.2 Internship Experience 6.2.1 Description of Section Where I Intern Worked For my internship purpose I worked in the Active of Account Department of Nitol Niloy Group’s Niloy Motors Brach. It was my fast experience to work any organization. After completion of academic study, all of us an organization is best opportunity to practice corporate culture and utilize academic learning. I got the privilege to work at Niloy Motors Ltd. for a Period of 12 consecutive weeks. I experienced that every desk is assigned with specific jobs and particular persons, I worked with, I came to learn a lot of things which will help me not only in Professional life but also in my personal life. 6.2.2 My Experience Research has found the following effects of interviewer experience on the interviewing process.  I work as an Account Officer in Niloy Motors Limited  In this job my main interest or duty is to maintain the receivable of Amar Hero project and Making the Bank Recondition in every month.  The invironment of my work is good
  • 55. Page 55 of 55 Reference Annual report of Niloy Motors Limited. Project profile 2013, 2014 of Niloy Motors Limited. Auditing report 2010, 2011, 2012, 2013 and 2014 of Niloy Motors Limited. www.niloymotors.com