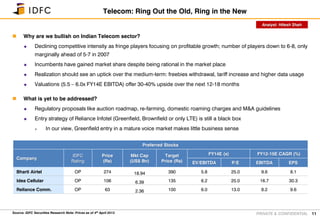
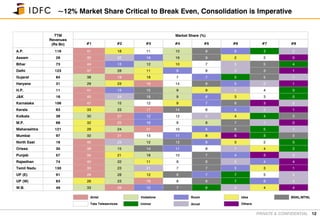
The document discusses the Indian telecom sector and provides recommendations. It notes that competitive intensity is declining as smaller players focus on profitable growth, with the number of players consolidating to 6-8 from more previously. Incumbents have gained market share while being rational in the market. Realizations should increase over the medium term as freebies are withdrawn and data usage rises. The document recommends Bharti Airtel, Idea Cellular and Reliance Communications as preferred stocks based on valuations offering 30-40% upside over the next 12-18 months. It notes regulatory issues still need to be addressed and questions Reliance Infotel's entry strategy.

![PRIVATE & CONFIDENTIAL
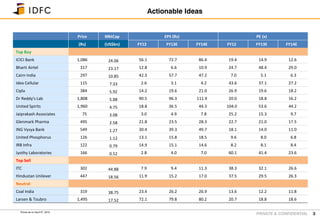
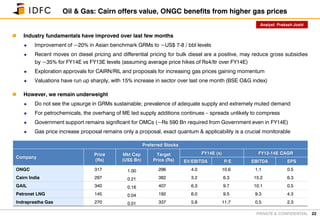
Auto: Hopes of demand recovery dashed again
28
Selective opportunities exist in the auto space
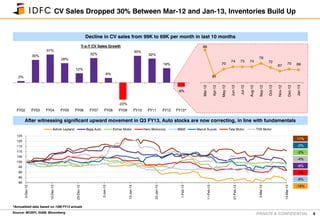
HCV demand extremely weak – closer to bottom; moderation in demand for UVs and diesel cars
Demand pullback looks elusive in 4Q FY13; cut in FY14 estimates certain
Preference for stocks with export tilt and leverage
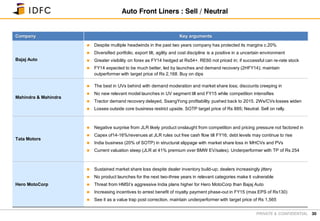
Recommend selling Tata Motors (Stock factoring in 40% premium over BMW for JLR while ignoring competition
launches and Jaguar dependence for growth; standalone business structurally weak). Don’t see upside in M&M. Hero
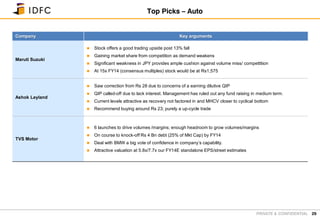
MotoCorp a value trap. Recommend buying Maruti Suzuki post steep fall (forex to cushion volume miss/competition),
Ashok Leyland (tactical upcycle trade) and TVS Motor (contrarian call as best risk:reward; significant launches [6 in
2013] and BMW deal). Recommend adding Bajaj Auto and Eicher Motors on dips (structural picks).
Source: IDFC Securities Research Note: Prices as of 25th January 2013
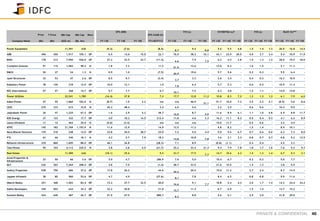
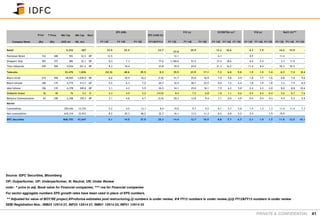
Preferred Stocks
Company
Price
(Rs)
Mkt Cap
(US$ Bn)
Target
Price (Rs)
FY14E (x) FY12-14E CAGR (%)
EV/EBITDA PE EBITDA EPS
Maruti Suzuki 1,417 8.23 1,485* 6.6 14.2 32.1 36.0
Ashok Leyland 23 1.19 30 7.2 8.4 6.5 14.0
TVS Motor 40 0.37 62 3.7 5.8 13.1 14.4
Analyst: Pramod Kumar
* - street ascribes a P/E multiple of 15x.](https://image.slidesharecdn.com/tapasijemishrareport-170619133047/85/Tapasije-mishra-report-28-320.jpg)