SlideShare a Scribd company logo
1 of 7
The District & TAMU Bus Operations
                 Transit Initiatives
The District and TAMU Bus Operations have a long standing history of coordinating the two
systems that date back to 1991 when The District installed passenger shelters in the two
cities. At that time the two systems worked together to create shared stops in the City of
College Station.

Since that time the two systems have cooperated on numerous projects which include but are
not limited to:

1.   TAMU allows The District to utilize their radio tower and their radio frequency;
2.   TAMU allows affiliates to ride TAMU buses, which includes Blinn students.
3.   TAMU and The District continue to work together to coordinate stops and shelter
     locations;
4.   The District sought and received a Congressional earmark in 1996 to procure small buses
     for TAMU which are in use today;
5.   The two systems over the past 2 years have began to use the same bus and rider tracking
     system on all buses (Mentor);
6.   Two years ago, The District took over all ADA paratransit operations from TAMU. Since
     that time, TAMU has taken back the service after central funds were provided for faculty
     and staff ridership;
7.  Effective September 1, 2011 The District began allowing all TAMU students to ride BTD
    buses without charge upon showing their student ID;
8. Two years ago TAMU began to report all of their performance and ridership data to The
    District so it could be reflected in the National Transit Database each year so we could
    demonstrate to FTA that the two cities are a high transit use location;
9. TAMU agreed to serve on The District’s Parking board which is responsible for establishing
    parking rates for the new Kelly Terminal and Garage;
10. Over the past summer The District provided summer employment opportunities to
    TAMU drivers during the summer break.

The two systems are continually studying ways in which we could coordinate bus routes in the
two systems in order to eliminate any duplicate bus routes or just makes routes more
efficient. For example a project that has been discussed is for The District taking responsibility
for TAMU routes in far south College Station so TAMU could use their resources closer to the
campus where the density shows a greater need for more service. The District would then
establish a shared transfer stop where the patrons from S. College Station could transfer to a
TAMU bus for the final leg of their trip if it was the campus.

The District and TAMU Bus Operations will continue to work to coordinate the two systems
into a seamless mobility program serving the two cities and Brazos County always keeping in
mind the funding parameters that are placed on each system by their respective funding
partners.
MILEAGE
          0%            10%                 20%                 30%                40%          50%            60%                 70%             80%        90%   100%

                                                                                                                                                                       221,437
Sep-10          36,665                    16,768                                                               168,004

Sep-11         36,611                  14,348                                                                183,807                                                   234,766

Oct-10           36,361                     15,662                                                              152,056
                                                                                                                                                                       204,079
Oct-11         36,003               15,314                                                                   187,285
                                                                                                                                                                       238,602
Nov-10          34,311                    15,237                                                               154,320
                                                                                                                                                                       203,868
Nov-11         34,864                   15,012                                                                169,047

Dec-10                  32,805                                14,951                                                      86,974                                       218,923

Dec-11                   36,316                                 16,382                                                      88,217
                                                                                                                                                                       134,730

Jan-11                  34,862                              16,028                                                        96,362
                                                                                                                                                                       140,915
Jan-12             36,665                            16,948                                                           121,385

Feb-11          34,242                     15,493                                                              149,195                                                 147,252

Feb-12         36,466                  16,725                                                                 183,385
                                                                                                                                                                       174,998
Mar-11            39,982                           19,273                                                            143,805
                                                                                                                                                                       198,930
Mar-12            37,280                        15,169                                                           141,402

Apr-11          35,113                    16,660                                                               160,787                                                 236,576

Apr-12         33,617               14,749                                                                   176,431
                                                                                                                                                                       203,060
May-11                    36,644                                16,329                                                      88,132

                          36,709                                 14,798                                                     84,334                                     193,851
May-12

Jun-11                             38,468                                          17,276                                                56,342                        212,560

Jun-12                         35,173                                      16,412                                                   62,243
                                                                                                                                                                       224,797
 Jul-11                          34,812                                         15,056                                               57,197

 Jul-12                    32,157                                      16,101                                                   67,346                                 141,105

Aug-11                        40,068                                   17,679                                                   80,245
                                                                                                                                                                       135,841
Aug-12                    38,657                                16,870                                                      92,931
                                                                                                                                                                       112,086
TOTAL             864,851                          385,240                                                        2,951,232

                                   THE DISTRICT FIXED MILES                                  THE DISTRICT D&R MILES                               A&M MILES            113,828
HOURS
          0%             10%                    20%                30%                40%           50%           60%                 70%                80%       90%   100%


Sep-10          2,272                    1,119                                                                   12,265                                                    15,656

Sep-11         2,354                924                                                                        13,904
                                                                                                                                                                           17,182
Oct-10          2,310                    1,043                                                                   11,937
                                                                                                                                                                           15,290
Oct-11          2,348               946                                                                        13,655

Nov-10          2,179               1,019                                                                       12,474                                                     16,949

Nov-11         2,200                 982                                                                       12,813
                                                                                                                                                                           15,672
Dec-10                  2,065                              1,045                                                            6,370

                         2,226                               966                                                            6,659                                          15,995
Dec-11
                        2,200                             1,032                                                            7,193                                           9,480
Jan-11
                  2,266                     1,039                                                                  10,384                                                  9,851
Jan-12

Feb-11           2,160                      1,033                                                                  9,994                                                   10,425

Feb-12         2,201              1,050                                                                        13,950
                                                                                                                                                                           13,689
Mar-11            2,530                     1,213                                                                  11,446

Mar-12           2,324                    952                                                                    11,936                                                    13,187

Apr-11          2,201                1,091                                                                      12,172
                                                                                                                                                                           17,201

Apr-12         1,954               972                                                                         12,744
                                                                                                                                                                           15,189
May-11                     2,313                                   1,044                                                       5,739

May-12                   2,129                              947                                                             6,403                                          15,212

Jun-11                               2,420                                              1,058                                                  3,376
                                                                                                                                                                           15,464
Jun-12                           2,024                                       1,016                                                     3,851
                                                                                                                                                                           15,670
 Jul-11                             2,214                                              936                                                    3,239
                                                                                                                                                                           9,096
 Jul-12                          2,010                                        1,009                                                        3,689
                                                                                                                                                                           9,479
Aug-11                     2,554                                     1,142                                                         5,993
                                                                                                                                                                           6,854
Aug-12                    2,239                                   1,046                                                       5,911
                                                                                                                                                                           6,891
TOTAL             53,693                         24,624                                                             218,097
                                                                                                                                                                           6,389
                                   THE DISTRICT FIXED HOURS                                     THE DISTRICT D&R HOURS                                 A&M HOURS
RIDERSHIP
          0%                    10%                 20%               30%           40%       50%                  60%            70%    80%         90%   100%


Sep-10     32,298        3,014                                                                 815,510
                                                                                                                                                              850,822
Sep-11    34,056        2,496                                                                 923,712
                                                                                                                                                              960,264
Oct-10    25,655 2,709                                                                        734,905

Oct-11    33,288         2,421                                                                 813,452                                                        763,269

Nov-10    26,839 2,517                                                                         685,208
                                                                                                                                                              849,161
Nov-11     31,669        2,359                                                                 730,497
                                   2,596                                                                                                                      714,564
Dec-10          29,638                                                                              276,375

Dec-11           31,166                 2,212                                                        244,556                                                  764,525

Jan-11      32,436              2,521                                                            412,820
                                                                                                                                                              308,609
Jan-12             30,711                  2,519                                                         202,123

Feb-11         33,945     2,258                                                                 604,462                                                       277,934


Feb-12    31,809        2,550                                                                  717,317
                                                                                                                                                              447,777

Mar-11     30,460        2,738                                                                 595,508
                                                                                                                                                              235,353
Mar-12      32,115        2,338                                                                 536,481

Apr-11    26,110 2,687                                                                         625,001                                                        640,665

Apr-12     29,260        2,334                                                                 581,849
                                                                                                                                                              751,676
May-11                   25,423                      2,504                                                  114,830
                                                                                                                                                              628,706
May-12               31,595                        2,666                                                   166,556

Jun-11                    28,905                           2,511                                               113,800                                        570,934

Jun-12                     32,074                            2,574                                             118,981
                                                                                                                                                              653,798
 Jul-11                               33,500                                2,274                                        80,258

                                32,231                             2,647                                            100,448                                   613,443
 Jul-12

Aug-11             35,145                   2,909                                                        220,725                                              142,757

Aug-12           36,266                 3,207                                                        291,442
                                                                                                                                                              200,817
TOTAL     746,594           61,561                                                             10,706,816

                                         THE DISTRICT FIXED RIDERS                         THE DISTRICT D&R RIDERS                      A&M RIDERS            145,216
EXPENSES
          0%        10%                20%         30%            40%       50%         60%                 70%         80%   90%   100%


Sep-10                $224,350                                                            $581,594                                    $      805,944

Sep-11                      $292,719                                                             $604,236                             $      896,955

Oct-10         $103,453                                                            $515,754                                           $      619,207

Oct-11         $114,615                                                            $575,208                                           $      689,823

Nov-10              $155,393                                                            $471,604                                      $      626,998

Nov-11                       $216,686                                                             $416,400                            $      633,086

Dec-10                           $215,948                                                             $326,998                        $      542,946

Dec-11                         $215,837                                                             $368,737                          $      584,574

Jan-11                      $182,065                                                             $372,323                             $      554,387

Jan-12                      $206,633                                                             $418,044                             $      624,677

Feb-11                $176,286                                                            $453,192                                    $      629,478

Feb-12             $171,723                                                            $556,720                                       $      728,443

Mar-11                    $206,671                                                            $488,444                                $      695,116

Mar-12                $187,129                                                            $491,958                                    $      679,087

Apr-11             $155,621                                                            $499,355                                       $      654,975

Apr-12            $167,013                                                            $593,995                                        $      761,008

May-11                               $222,043                                                            $296,636                     $      518,678

May-12                    $169,943                                                            $400,584                                $      570,527

Jun-11                          $198,282                                                             $314,096                         $      512,378

Jun-12                        $187,681                                                            $349,164                            $      536,845

 Jul-11                           $213,840                                                            $314,693                        $      528,533


 Jul-12                      $172,623                                                             $334,868                            $      507,491


Aug-11                                  $223,762                                                             $260,845                 $      484,606


Aug-12               $146,265                                                            $403,575                                     $      549,840


TOTAL                     $4,526,580                                                          $10,409,022                             $    14,935,602


                                                   THE DISTRICT                                          A&M
The District Fixed Routes

More Related Content

Viewers also liked

UDO Amendments related to Southside Area Neighborhood Plan
UDO Amendments related to Southside Area Neighborhood PlanUDO Amendments related to Southside Area Neighborhood Plan
UDO Amendments related to Southside Area Neighborhood Plan
City of College Station
 
TCEQ Public Meeting on Proposed Privately-Owned Landfill
TCEQ Public Meeting on Proposed Privately-Owned LandfillTCEQ Public Meeting on Proposed Privately-Owned Landfill
TCEQ Public Meeting on Proposed Privately-Owned Landfill
City of College Station
 
June 20 AZ Arts Ed Meeting - Proposed model program
June 20 AZ Arts Ed Meeting - Proposed model programJune 20 AZ Arts Ed Meeting - Proposed model program
June 20 AZ Arts Ed Meeting - Proposed model program
anelson1
 
Business w11b Promoting Product @1
Business w11b Promoting Product @1Business w11b Promoting Product @1
Business w11b Promoting Product @1
univ
 
Economic Development Plan Phase II Update
Economic Development Plan Phase II UpdateEconomic Development Plan Phase II Update
Economic Development Plan Phase II Update
City of College Station
 

Viewers also liked (6)

UDO Amendments related to Southside Area Neighborhood Plan
UDO Amendments related to Southside Area Neighborhood PlanUDO Amendments related to Southside Area Neighborhood Plan
UDO Amendments related to Southside Area Neighborhood Plan
 
Rezoning for 1405 University Dr.
Rezoning for 1405 University Dr.Rezoning for 1405 University Dr.
Rezoning for 1405 University Dr.
 
TCEQ Public Meeting on Proposed Privately-Owned Landfill
TCEQ Public Meeting on Proposed Privately-Owned LandfillTCEQ Public Meeting on Proposed Privately-Owned Landfill
TCEQ Public Meeting on Proposed Privately-Owned Landfill
 
June 20 AZ Arts Ed Meeting - Proposed model program
June 20 AZ Arts Ed Meeting - Proposed model programJune 20 AZ Arts Ed Meeting - Proposed model program
June 20 AZ Arts Ed Meeting - Proposed model program
 
Business w11b Promoting Product @1
Business w11b Promoting Product @1Business w11b Promoting Product @1
Business w11b Promoting Product @1
 
Economic Development Plan Phase II Update
Economic Development Plan Phase II UpdateEconomic Development Plan Phase II Update
Economic Development Plan Phase II Update
 

Similar to TAMU Transit and Dual Ridership Program

77386 november market report collection
77386 november market report collection77386 november market report collection
77386 november market report collection
sfinley2388
 
Weekly Report 18th July 2011
Weekly Report 18th July 2011Weekly Report 18th July 2011
Weekly Report 18th July 2011
Angel Broking
 
Spring homes sales report feb 2013
Spring homes sales report feb 2013Spring homes sales report feb 2013
Spring homes sales report feb 2013
Priyanka Johri
 
Spring TX Home Sales Report | February 2013
Spring TX Home Sales Report | February 2013Spring TX Home Sales Report | February 2013
Spring TX Home Sales Report | February 2013
Ken Brand
 
Spring homes sales report feb 2013
Spring homes sales report feb 2013Spring homes sales report feb 2013
Spring homes sales report feb 2013
Mike Tabbert
 
Sprint TX Real Estate and Homes Sales Report | December 2013
Sprint TX Real Estate and Homes Sales Report | December 2013Sprint TX Real Estate and Homes Sales Report | December 2013
Sprint TX Real Estate and Homes Sales Report | December 2013
Ken Brand
 
Technical Report 15th July 2011
Technical Report 15th July 2011Technical Report 15th July 2011
Technical Report 15th July 2011
Angel Broking
 
Magnolia Real Estate Report 2012
Magnolia Real Estate Report 2012Magnolia Real Estate Report 2012
Magnolia Real Estate Report 2012
Tanya Lavoie Bugbee
 

Similar to TAMU Transit and Dual Ridership Program (20)

K onfirmasi sdv
K onfirmasi sdvK onfirmasi sdv
K onfirmasi sdv
 
Spring 77386 Real Estate Sales REport | November 2012
Spring 77386 Real Estate Sales REport | November 2012Spring 77386 Real Estate Sales REport | November 2012
Spring 77386 Real Estate Sales REport | November 2012
 
77386 november market report collection
77386 november market report collection77386 november market report collection
77386 november market report collection
 
Home sales report 77386 april 2013
Home sales report 77386 april 2013Home sales report 77386 april 2013
Home sales report 77386 april 2013
 
Spring tx real estate market report march 2013
Spring tx real estate market report march 2013Spring tx real estate market report march 2013
Spring tx real estate market report march 2013
 
Home Sales Report for Spring Texas | October 2012 | Zip Code 77386
Home Sales Report for Spring Texas | October 2012 | Zip Code 77386Home Sales Report for Spring Texas | October 2012 | Zip Code 77386
Home Sales Report for Spring Texas | October 2012 | Zip Code 77386
 
77386springrealestatemarketreportsoctober2012 121023082045-phpapp02
77386springrealestatemarketreportsoctober2012 121023082045-phpapp0277386springrealestatemarketreportsoctober2012 121023082045-phpapp02
77386springrealestatemarketreportsoctober2012 121023082045-phpapp02
 
Weekly Report 18th July 2011
Weekly Report 18th July 2011Weekly Report 18th July 2011
Weekly Report 18th July 2011
 
Spring homes sales report feb 2013
Spring homes sales report feb 2013Spring homes sales report feb 2013
Spring homes sales report feb 2013
 
Spring TX Home Sales Report | February 2013
Spring TX Home Sales Report | February 2013Spring TX Home Sales Report | February 2013
Spring TX Home Sales Report | February 2013
 
Spring homes sales report feb 2013
Spring homes sales report feb 2013Spring homes sales report feb 2013
Spring homes sales report feb 2013
 
Spring homes sales report feb 2013
Spring homes sales report feb 2013Spring homes sales report feb 2013
Spring homes sales report feb 2013
 
Sprint TX Real Estate and Homes Sales Report | December 2013
Sprint TX Real Estate and Homes Sales Report | December 2013Sprint TX Real Estate and Homes Sales Report | December 2013
Sprint TX Real Estate and Homes Sales Report | December 2013
 
July 2009 Philadelphia County Basic Supply And Demand
July 2009 Philadelphia County Basic Supply And DemandJuly 2009 Philadelphia County Basic Supply And Demand
July 2009 Philadelphia County Basic Supply And Demand
 
Technical Report 15th July 2011
Technical Report 15th July 2011Technical Report 15th July 2011
Technical Report 15th July 2011
 
Spring 77386 market report collection 1 1 13
Spring 77386 market report collection 1 1 13Spring 77386 market report collection 1 1 13
Spring 77386 market report collection 1 1 13
 
77354 real estate market report october 2012 magnolia tx
77354 real estate market report october 2012 magnolia tx77354 real estate market report october 2012 magnolia tx
77354 real estate market report october 2012 magnolia tx
 
Magnolia Real Estate Report 2012
Magnolia Real Estate Report 2012Magnolia Real Estate Report 2012
Magnolia Real Estate Report 2012
 
Bucks County Sold Average vs Median Price
Bucks County Sold Average vs Median PriceBucks County Sold Average vs Median Price
Bucks County Sold Average vs Median Price
 
June 2010 Chester County Basic Supply and Demand
June 2010 Chester County Basic Supply and DemandJune 2010 Chester County Basic Supply and Demand
June 2010 Chester County Basic Supply and Demand
 

More from City of College Station

More from City of College Station (20)

Gus Roy Road Land Use Applicant Presentation
Gus Roy Road Land Use Applicant PresentationGus Roy Road Land Use Applicant Presentation
Gus Roy Road Land Use Applicant Presentation
 
2020 BVEDC Compliance Report
2020 BVEDC Compliance Report2020 BVEDC Compliance Report
2020 BVEDC Compliance Report
 
College Station Community Recreation Center Update
College Station Community Recreation Center UpdateCollege Station Community Recreation Center Update
College Station Community Recreation Center Update
 
Gus Roy Road Land Use
Gus Roy Road Land UseGus Roy Road Land Use
Gus Roy Road Land Use
 
Debt Parameters Ordinance
Debt Parameters OrdinanceDebt Parameters Ordinance
Debt Parameters Ordinance
 
Historical Marker No. 106
Historical Marker No. 106Historical Marker No. 106
Historical Marker No. 106
 
Historical Cemetery Project
Historical Cemetery ProjectHistorical Cemetery Project
Historical Cemetery Project
 
TxDOT Grant Resolution -- Harvey Mitchell Parkway Shared-Use Path
TxDOT Grant Resolution -- Harvey Mitchell Parkway Shared-Use PathTxDOT Grant Resolution -- Harvey Mitchell Parkway Shared-Use Path
TxDOT Grant Resolution -- Harvey Mitchell Parkway Shared-Use Path
 
Creek Meadows PUE Abandonment
Creek Meadows PUE AbandonmentCreek Meadows PUE Abandonment
Creek Meadows PUE Abandonment
 
Semi Annual Report on Impact Fees
Semi Annual Report on Impact FeesSemi Annual Report on Impact Fees
Semi Annual Report on Impact Fees
 
Name Change for Part of Royder Road
Name Change for Part of Royder Road Name Change for Part of Royder Road
Name Change for Part of Royder Road
 
Options to Preserve Neighborhood Integrity
Options to Preserve Neighborhood IntegrityOptions to Preserve Neighborhood Integrity
Options to Preserve Neighborhood Integrity
 
Northgate Study and Operations Plan
Northgate Study and Operations PlanNorthgate Study and Operations Plan
Northgate Study and Operations Plan
 
Lick Creek Hike & Bike Trail Midtown Crossing
Lick Creek Hike & Bike Trail Midtown CrossingLick Creek Hike & Bike Trail Midtown Crossing
Lick Creek Hike & Bike Trail Midtown Crossing
 
Housing of Fowl Animal Ordinance
Housing of Fowl Animal OrdinanceHousing of Fowl Animal Ordinance
Housing of Fowl Animal Ordinance
 
FY 21 Debt Issuance
FY 21 Debt IssuanceFY 21 Debt Issuance
FY 21 Debt Issuance
 
FY 21 City Council Strategic Plan
FY 21 City Council Strategic PlanFY 21 City Council Strategic Plan
FY 21 City Council Strategic Plan
 
Pet Sales Ordinance
Pet Sales OrdinancePet Sales Ordinance
Pet Sales Ordinance
 
Unlimited Potential Request for Rehabilitation Assistance
Unlimited Potential Request for Rehabilitation AssistanceUnlimited Potential Request for Rehabilitation Assistance
Unlimited Potential Request for Rehabilitation Assistance
 
Rental Registration Fee Consideration
Rental Registration Fee ConsiderationRental Registration Fee Consideration
Rental Registration Fee Consideration
 

Recently uploaded

Recently uploaded (8)

12052024_First India Newspaper Jaipur.pdf
12052024_First India Newspaper Jaipur.pdf12052024_First India Newspaper Jaipur.pdf
12052024_First India Newspaper Jaipur.pdf
 
KING VISHNU BHAGWANON KA BHAGWAN PARAMATMONKA PARATOMIC PARAMANU KASARVAMANVA...
KING VISHNU BHAGWANON KA BHAGWAN PARAMATMONKA PARATOMIC PARAMANU KASARVAMANVA...KING VISHNU BHAGWANON KA BHAGWAN PARAMATMONKA PARATOMIC PARAMANU KASARVAMANVA...
KING VISHNU BHAGWANON KA BHAGWAN PARAMATMONKA PARATOMIC PARAMANU KASARVAMANVA...
 
10052024_First India Newspaper Jaipur.pdf
10052024_First India Newspaper Jaipur.pdf10052024_First India Newspaper Jaipur.pdf
10052024_First India Newspaper Jaipur.pdf
 
Income Tax Regime Dilemma – New VS. Old pdf
Income Tax Regime Dilemma – New VS. Old pdfIncome Tax Regime Dilemma – New VS. Old pdf
Income Tax Regime Dilemma – New VS. Old pdf
 
Politician uddhav thackeray biography- Full Details
Politician uddhav thackeray biography- Full DetailsPolitician uddhav thackeray biography- Full Details
Politician uddhav thackeray biography- Full Details
 
declarationleaders_sd_re_greens_theleft_5.pdf
declarationleaders_sd_re_greens_theleft_5.pdfdeclarationleaders_sd_re_greens_theleft_5.pdf
declarationleaders_sd_re_greens_theleft_5.pdf
 
Textile Waste In India/managing-textile-waste-in-India
Textile Waste In India/managing-textile-waste-in-IndiaTextile Waste In India/managing-textile-waste-in-India
Textile Waste In India/managing-textile-waste-in-India
 
11052024_First India Newspaper Jaipur.pdf
11052024_First India Newspaper Jaipur.pdf11052024_First India Newspaper Jaipur.pdf
11052024_First India Newspaper Jaipur.pdf
 

TAMU Transit and Dual Ridership Program

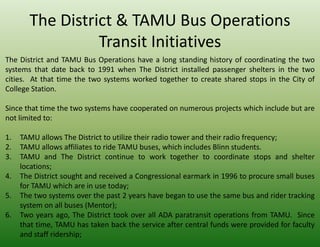
  • 1. The District & TAMU Bus Operations Transit Initiatives The District and TAMU Bus Operations have a long standing history of coordinating the two systems that date back to 1991 when The District installed passenger shelters in the two cities. At that time the two systems worked together to create shared stops in the City of College Station. Since that time the two systems have cooperated on numerous projects which include but are not limited to: 1. TAMU allows The District to utilize their radio tower and their radio frequency; 2. TAMU allows affiliates to ride TAMU buses, which includes Blinn students. 3. TAMU and The District continue to work together to coordinate stops and shelter locations; 4. The District sought and received a Congressional earmark in 1996 to procure small buses for TAMU which are in use today; 5. The two systems over the past 2 years have began to use the same bus and rider tracking system on all buses (Mentor); 6. Two years ago, The District took over all ADA paratransit operations from TAMU. Since that time, TAMU has taken back the service after central funds were provided for faculty and staff ridership;
  • 2. 7. Effective September 1, 2011 The District began allowing all TAMU students to ride BTD buses without charge upon showing their student ID; 8. Two years ago TAMU began to report all of their performance and ridership data to The District so it could be reflected in the National Transit Database each year so we could demonstrate to FTA that the two cities are a high transit use location; 9. TAMU agreed to serve on The District’s Parking board which is responsible for establishing parking rates for the new Kelly Terminal and Garage; 10. Over the past summer The District provided summer employment opportunities to TAMU drivers during the summer break. The two systems are continually studying ways in which we could coordinate bus routes in the two systems in order to eliminate any duplicate bus routes or just makes routes more efficient. For example a project that has been discussed is for The District taking responsibility for TAMU routes in far south College Station so TAMU could use their resources closer to the campus where the density shows a greater need for more service. The District would then establish a shared transfer stop where the patrons from S. College Station could transfer to a TAMU bus for the final leg of their trip if it was the campus. The District and TAMU Bus Operations will continue to work to coordinate the two systems into a seamless mobility program serving the two cities and Brazos County always keeping in mind the funding parameters that are placed on each system by their respective funding partners.
  • 3. MILEAGE 0% 10% 20% 30% 40% 50% 60% 70% 80% 90% 100% 221,437 Sep-10 36,665 16,768 168,004 Sep-11 36,611 14,348 183,807 234,766 Oct-10 36,361 15,662 152,056 204,079 Oct-11 36,003 15,314 187,285 238,602 Nov-10 34,311 15,237 154,320 203,868 Nov-11 34,864 15,012 169,047 Dec-10 32,805 14,951 86,974 218,923 Dec-11 36,316 16,382 88,217 134,730 Jan-11 34,862 16,028 96,362 140,915 Jan-12 36,665 16,948 121,385 Feb-11 34,242 15,493 149,195 147,252 Feb-12 36,466 16,725 183,385 174,998 Mar-11 39,982 19,273 143,805 198,930 Mar-12 37,280 15,169 141,402 Apr-11 35,113 16,660 160,787 236,576 Apr-12 33,617 14,749 176,431 203,060 May-11 36,644 16,329 88,132 36,709 14,798 84,334 193,851 May-12 Jun-11 38,468 17,276 56,342 212,560 Jun-12 35,173 16,412 62,243 224,797 Jul-11 34,812 15,056 57,197 Jul-12 32,157 16,101 67,346 141,105 Aug-11 40,068 17,679 80,245 135,841 Aug-12 38,657 16,870 92,931 112,086 TOTAL 864,851 385,240 2,951,232 THE DISTRICT FIXED MILES THE DISTRICT D&R MILES A&M MILES 113,828
  • 4. HOURS 0% 10% 20% 30% 40% 50% 60% 70% 80% 90% 100% Sep-10 2,272 1,119 12,265 15,656 Sep-11 2,354 924 13,904 17,182 Oct-10 2,310 1,043 11,937 15,290 Oct-11 2,348 946 13,655 Nov-10 2,179 1,019 12,474 16,949 Nov-11 2,200 982 12,813 15,672 Dec-10 2,065 1,045 6,370 2,226 966 6,659 15,995 Dec-11 2,200 1,032 7,193 9,480 Jan-11 2,266 1,039 10,384 9,851 Jan-12 Feb-11 2,160 1,033 9,994 10,425 Feb-12 2,201 1,050 13,950 13,689 Mar-11 2,530 1,213 11,446 Mar-12 2,324 952 11,936 13,187 Apr-11 2,201 1,091 12,172 17,201 Apr-12 1,954 972 12,744 15,189 May-11 2,313 1,044 5,739 May-12 2,129 947 6,403 15,212 Jun-11 2,420 1,058 3,376 15,464 Jun-12 2,024 1,016 3,851 15,670 Jul-11 2,214 936 3,239 9,096 Jul-12 2,010 1,009 3,689 9,479 Aug-11 2,554 1,142 5,993 6,854 Aug-12 2,239 1,046 5,911 6,891 TOTAL 53,693 24,624 218,097 6,389 THE DISTRICT FIXED HOURS THE DISTRICT D&R HOURS A&M HOURS
  • 5. RIDERSHIP 0% 10% 20% 30% 40% 50% 60% 70% 80% 90% 100% Sep-10 32,298 3,014 815,510 850,822 Sep-11 34,056 2,496 923,712 960,264 Oct-10 25,655 2,709 734,905 Oct-11 33,288 2,421 813,452 763,269 Nov-10 26,839 2,517 685,208 849,161 Nov-11 31,669 2,359 730,497 2,596 714,564 Dec-10 29,638 276,375 Dec-11 31,166 2,212 244,556 764,525 Jan-11 32,436 2,521 412,820 308,609 Jan-12 30,711 2,519 202,123 Feb-11 33,945 2,258 604,462 277,934 Feb-12 31,809 2,550 717,317 447,777 Mar-11 30,460 2,738 595,508 235,353 Mar-12 32,115 2,338 536,481 Apr-11 26,110 2,687 625,001 640,665 Apr-12 29,260 2,334 581,849 751,676 May-11 25,423 2,504 114,830 628,706 May-12 31,595 2,666 166,556 Jun-11 28,905 2,511 113,800 570,934 Jun-12 32,074 2,574 118,981 653,798 Jul-11 33,500 2,274 80,258 32,231 2,647 100,448 613,443 Jul-12 Aug-11 35,145 2,909 220,725 142,757 Aug-12 36,266 3,207 291,442 200,817 TOTAL 746,594 61,561 10,706,816 THE DISTRICT FIXED RIDERS THE DISTRICT D&R RIDERS A&M RIDERS 145,216
  • 6. EXPENSES 0% 10% 20% 30% 40% 50% 60% 70% 80% 90% 100% Sep-10 $224,350 $581,594 $ 805,944 Sep-11 $292,719 $604,236 $ 896,955 Oct-10 $103,453 $515,754 $ 619,207 Oct-11 $114,615 $575,208 $ 689,823 Nov-10 $155,393 $471,604 $ 626,998 Nov-11 $216,686 $416,400 $ 633,086 Dec-10 $215,948 $326,998 $ 542,946 Dec-11 $215,837 $368,737 $ 584,574 Jan-11 $182,065 $372,323 $ 554,387 Jan-12 $206,633 $418,044 $ 624,677 Feb-11 $176,286 $453,192 $ 629,478 Feb-12 $171,723 $556,720 $ 728,443 Mar-11 $206,671 $488,444 $ 695,116 Mar-12 $187,129 $491,958 $ 679,087 Apr-11 $155,621 $499,355 $ 654,975 Apr-12 $167,013 $593,995 $ 761,008 May-11 $222,043 $296,636 $ 518,678 May-12 $169,943 $400,584 $ 570,527 Jun-11 $198,282 $314,096 $ 512,378 Jun-12 $187,681 $349,164 $ 536,845 Jul-11 $213,840 $314,693 $ 528,533 Jul-12 $172,623 $334,868 $ 507,491 Aug-11 $223,762 $260,845 $ 484,606 Aug-12 $146,265 $403,575 $ 549,840 TOTAL $4,526,580 $10,409,022 $ 14,935,602 THE DISTRICT A&M