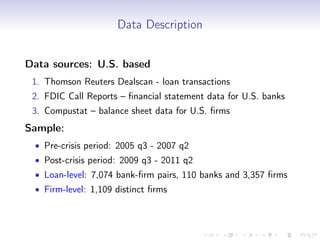
1. The author examines how shocks to bank health during the 2007-2009 financial crisis affected bank lending and economic activity in the U.S. using loan-level data.
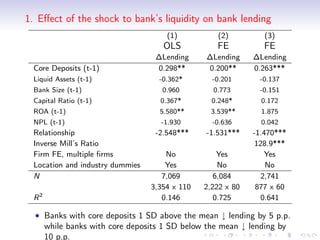
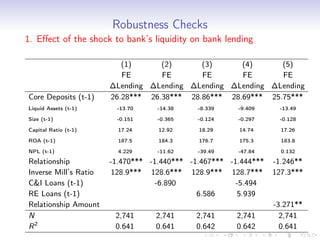
2. The results show that banks with higher levels of core deposits, a stable source of funding, reduced lending by less than banks with lower core deposit levels after the crisis, indicating that liquidity shocks to banks negatively impacted bank lending.
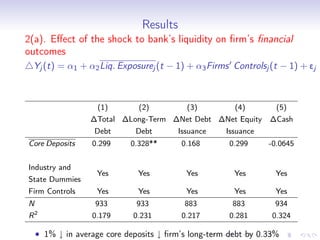
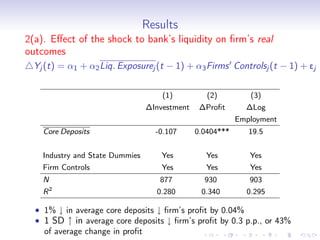
3. Further analysis finds that shocks to bank liquidity and reductions in bank lending were both associated with worse financial and economic outcomes for borrower firms, such as higher leverage, less investment, and lower profits, providing evidence that liquidity problems in the banking sector can transmit stress to the
SunTrust reported third quarter earnings of $0.88 per share, down from $1.18 per share in the third quarter of 2007. The challenging credit environment continued to impact financial performance through higher net charge-offs, nonperforming loans, and credit-related expenses. While profitability declined, SunTrust's capital position improved and the company believes it is well positioned to manage through the current challenges. Noninterest income increased driven by securities gains and valuation gains, but was offset by expected losses on auction rate securities and mark-to-market losses on trading assets.
Presentation on Bank Quality, Judicial Efficiency, and Loan Repayment Delays ...Michael-Paul James
Presentation on Bank Quality, Judicial Efficiency,
and Loan Repayment Delays in Italy. Paper by Fabio Schiantarelli, Massimiliano Stacchini, and Philip E. Strahan. Presentation by Michael-Paul James
- SunTrust reported a net loss of $379.2 million for Q4 2008 compared to a profit of $3.3 million in Q4 2007, due to higher credit costs from the deteriorating economy. For the full year 2008, SunTrust reported a profit of $746.9 million, down 53.4% from 2007.
- Revenue increased 8.8% in Q4 2008 versus Q4 2007, driven by lower market valuation losses on loans and securities carried at fair value. However, higher credit costs led to a net loss for the quarter.
- Noninterest income rose 24.6% in Q4 2008 versus Q4 2007 mainly due to lower mark-to-market losses, but
This document provides an overview and financial analysis of a corporation. It discusses the corporation's business strategy of focusing on investment management, asset servicing, and banking for institutional and affluent individual clients. It then summarizes the corporation's strong financial performance in 2006, with record net income of $665.4 million and revenue growth of 14%. Key metrics like assets under management and custody also reached record levels. The document analyzes the components of the corporation's revenues and expenses.
Sovereign Bancorp reported a net loss of $982 million or $1.48 per share for Q3 2008. This included impairment charges of $575 million on preferred stock and $602 million loss from selling its CDO portfolio. Excluding these losses, net income was $41.3 million. Key highlights included remaining well capitalized, $11.8 billion in unused borrowing capacity, stable net interest margin, and increased allowance for credit losses to 1.79% of total loans.
- SunTrust reported second quarter earnings of $1.53 per share, down from $1.89 per share in the second quarter of 2007, due to higher loan loss provisions, credit-related expenses, and valuation losses. These factors were partially offset by gains from selling Coca-Cola stock and a non-strategic subsidiary.
- The company completed transactions involving its Coca-Cola stock holdings that increased its regulatory capital ratio by an estimated 68 basis points as of June 30, 2008.
- Credit metrics continued to deteriorate in the quarter, though at a slower pace, with net charge-offs increasing 8.6% and the allowance for loan losses rising to 1.46% of total loans.
Credit Suisse Group reported record net income of CHF 2.6 billion in the first quarter of 2006, up 36% from the first quarter of 2005. All business segments saw improved income, driven by positive market conditions and strong client activity. Investment Banking saw the largest increase in income of 68% due to a 44% rise in net revenues. Private Banking and Asset Management also experienced higher income, with Private Banking achieving net new assets of CHF 14.8 billion. Winterthur continued its operational improvements with a 21% increase in income.
Fifth Third Bancorp reported a Q3 2008 net loss of $56 million, compared to a net loss of $202 million in Q2 2008 and net income of $325 million in Q3 2007. Higher credit costs drove the results, as non-performing assets and net charge-offs increased, particularly for commercial and residential real estate loans in Florida and Michigan. However, core earnings were positive, with revenue growth across most business lines and expense control. While facing disruptions in capital markets and a weakening economy, the company remains well-capitalized with a Tier 1 capital ratio of 8.53%.
1) Citi reported a significant year-over-year decline in 4th quarter 2007 earnings, with net income down 83% and EPS down 83% due to losses from sub-prime exposures and increased credit costs.
2) Revenue declined 70% year-over-year in 4Q2007 due to losses from sub-prime exposures in Fixed Income Markets and higher credit costs in U.S. Consumer.
3) Expenses increased 18% year-over-year in 2007, with 9% organic growth and 9% from acquisitions, while headcount increased 15% in 2007.
The document provides an overview of the causes of the 2007-2010 financial crisis across two sections. Section 1 discusses factors in finance, the role of the US government, and the hubris of Wall Street executives. Flawed compensation structures incentivized risk-taking. Complex financial products like CDOs and CDSs spread risk but were inaccurately rated. Government policies aimed to expand home ownership but fueled imbalances. Section 2 will analyze why Lehman Brothers specifically collapsed in October 2008.
- The Indian stock market opened cautiously after the GDP growth of 6.1% in the third quarter missed estimates and led to losses the previous day.
- Key indices were up marginally, with the Sensex gaining 0.12% and Nifty 0.18%, while mid and small cap indices rose over 1%.
- ONGC and other energy stocks gained, while banks and capital goods stocks declined slightly on concerns over the lower GDP growth.
- Asian markets were mixed in early trade while investors awaited further cues from global economic data releases through the week.
Fifth Third Bancorp reported first quarter 2008 earnings of $292 million, or $0.55 per diluted share, compared to $16 million in the previous quarter and $359 million in the first quarter of 2007. Net interest income increased 11% year-over-year to $826 million due to loan and deposit growth as well as lower funding costs, while the net interest margin declined slightly. Loan balances grew 9% year-over-year led by increases in commercial and residential mortgage loans. Credit costs increased substantially due to deterioration in residential real estate, homebuilder, and development loans.
This document provides a summary of Washington Federal's (WAFD) fiscal year 2012 results and financial position as of September 30, 2012.
Key points include:
- Significant improvement in asset quality and reduced credit costs
- Margin pressure due to asset repricing
- Two small acquisitions completed
- 24% increase in net income
- Balance sheet restructuring of wholesale borrowings and investments
- Improved capital ratios providing flexibility for future growth
- Over half of earnings returned to shareholders through dividends and share repurchases
15000
10000
5000
0
2005 2006 2007
- The financial ratios of SRM are projected to improve in 2006 and 2007 compared to 2005. However, they remain below industry averages.
- While liquidity, leverage, and asset management ratios improve, profitability ratios only marginally increase and remain poor.
- A key weakness is low profit margins, despite improvements in sales, inventory management, and debt repayment. Increased expenses constrain profits.
- Repaying debt improves financial stability in the short term, but sustained profitability is still lacking for long term financial health.
"Argo Group’s second quarter results demonstrate continued momentum in the first half of 2015," said CEO Mark E. Watson III. "The improvement in our underwriting income is a direct result of the ongoing focus on underwriting as well as a disciplined approach to profitable growth in our niche markets.”
1) The document is Argo Group's 1Q 2015 investor presentation which provides an overview of the company, its business segments, financial results, and growth strategy.
2) Argo Group is a leading specialty insurer with $1.9 billion in annual gross written premiums and an "A" rating from A.M. Best. Its business is diversified across multiple segments including excess and surplus lines, commercial specialty, Syndicate 1200, and international specialty.
3) Over the past decade, Argo Group has grown its gross written premiums and book value per share substantially through both organic growth and acquisitions. It aims to continue maximizing shareholder value through profitable growth and active capital management.
The document provides the following information in 3 sentences:
1) Share prices of major Malaysian property developers like SP Setia and Mah Sing have fallen significantly in the past week due to a report that the government may change how housing loans are calculated from gross to net pay to curb speculation.
2) While the analyst expected the news to impact share prices, they are surprised by the speed and severity of the selloff, which has also spread to construction companies with property exposure despite details of any policy changes still being unclear.
3) The analyst maintains an overweight rating on the property sector and outperform recommendations on all developers, seeing the share price falls as a buying opportunity, and believing the property market fundamentals
Fifth Third Bancorp reported 2007 earnings of $1.1 billion, or $2.03 per diluted share, compared to $1.2 billion, or $2.13 per diluted share in 2006. Fourth quarter 2007 earnings were $38 million, or $0.07 per diluted share, compared to $325 million, or $0.61 per diluted share in the third quarter of 2007. Results were impacted by non-cash charges including lowering the value of a Bank-Owned Life Insurance policy and reserves related to potential Visa litigation settlements. Excluding these items, operating earnings were lower due to deterioration in credit performance and increased loan loss reserves in response to challenging credit conditions expected to continue in the near
Venture Capital Fundraising Activity - Q1 2008 mensa25
Venture capital fundraising activity slowed in the first quarter of 2008, with 57 funds raising $6.3 billion, a 31% decrease in the number of funds raised compared to the first quarter of 2007. Follow-on funds dominated fundraising, with 52 follow-on funds raised compared to just 5 new funds. The ratio of follow-on to new funds was approximately 10-to-1 for the quarter, compared to less than 3-to-1 in the first quarter of 2007. The largest funds raised focused on balanced stage investments in life sciences and clean technologies.
Brenen Sieber,Partner with Baker Tilly Virchow Krause, LLP and Managing Director with Baker Tilly Capital, LLC, spoke at our November Chapter Meeting on the Current State of the M&A Market.
HCL Technologies was founded in 1976 in India and has grown to become a global leader in technology services and software, employing over 85,000 professionals in 31 countries. It has achieved strong growth and financial performance through innovative products and services, a focus on employee empowerment, and core values of trust, transparency, and customer focus. HCL provides a wide range of IT services including software development, research and development, and digital transformation to clients across industries globally.
House Price Expectations , Boom Bust Cycles and Implications for Monetary PolicyEesti Pank
1) Changes in household expectations about future house price increases and declines can generate boom-bust cycles in housing, credit, and economic activity in the model.
2) The standard monetary policy that reacts only to inflation and output amplifies these boom-bust cycles.
3) An alternative monetary policy that also reacts to household credit growth can dampen the boom-bust cycles and improve household welfare.
This document presents a theoretical model and empirical analysis of how the size of a firm's banking pool can signal the firm's quality to investors. The model suggests higher quality firms will borrow from fewer banks due to greater monitoring. Empirically, using a sample of European loans, the analysis finds that firms with higher Altman Z-scores, indicating better financial health, tend to borrow from smaller banking pools, supporting the signaling theory. The effect is weaker for larger, more transparent firms. Syndicated loans also mitigate the signaling through stronger coordination.
International syndicated loans and regional banksMasaki Yamaguchi
This paper investigates regional bank participation in international syndicated loans, which attract significant attention from the banking industry. This topic has a remarkable importance for regional banks because overseas activities are related to their growth strategies. We pose two questions to illustrate the internationalization of regional banks. The first question explores differences in loan transactions between the first internationalization during 1992-1997 and the second internationalization during 2009-2014. The second question seeks to identify the types of loan transactions preferred by regional banks. We answer these questions by using a comparative analysis and Probit analysis of 23,387 transaction data. Activities of regional banks in the first period overwhelm that of the second period. The first internationalization was characterized by a broad base of participant banks. Estimation results demonstrated similarities in the lending behavior of regional banks between the two periods. Smaller loan amounts, larger syndicates, and loan purposes for ordinary business facilitate regional bank participation in syndicated loans. These preferences reflect limited risk-taking capability and a weaker screening technique by regional banks. We also observe differences in currency denomination, and the Japanese yen increases its presence in the second period.
The document summarizes a study examining the stock market reaction to bank loan announcements in France from 2000-2009, including the financial crisis period. The main findings were that the market reaction was negative during the crisis but not before. Negative reactions were associated with smaller loans from larger syndicates, while positive reactions were linked to larger loans with higher spreads and multiple tranches. The reaction also depended on the borrower's financial constraints.
1) The study examines banks' adoption of the voluntary Equator Principles (EP) for managing environmental and social risks in project financing.
2) It finds that banks are more likely to adopt the EP when collaborating with other banks that have already adopted, indicating peer pressure and piggybacking effects.
3) However, banks are less likely to adopt if they can piggyback on EP banks in project financing deals without adopting themselves, suggesting the EP has not become a true industry standard.
1. The study analyzes how bank credit supply shocks affect aggregate productivity growth in the Italian manufacturing sector between 2000-2015.
2. The results show that credit supply shocks negatively impact average productivity but positively impact reallocation of resources from less to more productive firms.
3. During the crisis, credit supply shocks contributed to a 1/4 drop in average productivity growth but a 1/2 increase in productivity from reallocation, largely offsetting the negative effects.
This document presents a model that examines how aggregate uncertainty affects the productivity of firms. The model shows that when faced with uncertainty, firms must allocate attention between understanding macroeconomic conditions and increasing individual productivity. Higher aggregate uncertainty leads firms to pay more attention to macro conditions and less to productivity, reducing overall output. The author calibrates the model to data from Argentina, Chile, Ecuador and Mexico and finds it explains a significant portion of output fluctuations in those countries, suggesting aggregate uncertainty is an important driver of economic activity.
Financial frictions likely contributed to the sharp and persistent productivity slowdown observed in advanced economies since the Global Financial Crisis (GFC).
The study finds that firms with higher pre-GFC debt vulnerabilities, such as larger amounts of debt maturing in 2008, experienced larger post-GFC declines in productivity growth compared to less vulnerable firms. This negative effect was stronger in countries where credit conditions tightened more severely after the collapse of Lehman Brothers.
The results suggest financial frictions hampered investment in intangible assets at vulnerable firms, reducing productivity. In contrast, such relationships were not observed following past recessions that did not involve banking crises, indicating the GFC had distinct and longer-lasting impacts
The Effects of Bank Loan Renegotiation on Corporate Policies and PerformanceChristophe J. Godlewski
1) The document analyzes the effects of bank loan renegotiation on corporate policies and performance using a large sample of European firms over 16 years.
2) Key findings include that bank loan renegotiation has a significant, positive, and causal impact on financial policy and operational performance, with the largest average treatment effect on treated being for debt ratios which increased by 4-6%.
3) Renegotiation provides firms more flexibility and helps unlock their economic potential, with specific effects on how firm tangibility and growth opportunities influence outcomes.
The document discusses portfolio diversification and asset allocation. It explains that asset allocation is the process of combining different asset classes like stocks, bonds, and cash to meet investment goals. Diversifying across asset classes can help lower risk and increase returns. The document provides examples showing how diversified portfolios performed better than non-diversified portfolios during market downturns.
Aom pdw 2012 nascent entrepreneurship in chinaChuck Eesley
This document discusses two studies on the role of political capital and returnee entrepreneurs in China.
The first study finds that political capital positively impacts firms' resource acquisition in China, but this effect weakens over time and in more developed market regions as institutional constraints are reduced.
The second study finds that returnee entrepreneurs generally underperform local entrepreneurs in China due to lack of local knowledge, but state ownership and greater venture age help reduce this performance gap by providing access to resources and relationships.
VTB Capital "Russia Calling: London Session May-June 2011MRSK Centre
The document provides an overview of IDGC Capital's 2010 results and 2011 forecast. It highlights the company's strong growth across key financial metrics like revenue, EBITDA, and net profit between 2008-2011. Capitalization is forecast to grow at a CAGR of 64% during this period. The company has a large network across central Russia and implemented a KPI system to improve efficiency under RAB regulation. Prospects for continued growth are seen through lower depreciation and sector undervaluation relative to foreign peers.
Short-run Underpricing of Initial Public Offerings in the Sri Lankan Stock Ma...Lalith Samarakoon
This study investigates underpricing of IPOs in Sri Lanka. On average, IPOs are underpriced by 34%. Small issues are more underpriced than large issues, and privatization issues are more underpriced than conventional issues. Investor sentiment is positively related with underpricing and affects small and large issues similarly. Small privatization issues are more underpriced than large privatization issues and partially explain the asymmetry in underpricing between small and large issues. However, even after controlling for investor sentiment, privatization, hot-market conditions, underwriter-size, and industry, small issues remain more underpriced than large issues. The results strongly support the uncertainty hypothesis for larger underpricing of small issues, and privatization issues.
The document discusses liquidity risk and its management in financial institutions. It defines liquidity risk and outlines some key methods to measure it, including gap analysis, liquidity ratios, net loans to assets ratio, and loans to deposits ratio. It then discusses important principles of managing liquidity risk, such as establishing corporate governance and policies, determining risk limits, internal controls, stress testing, contingency funding planning, and meeting regulatory reporting requirements. Effective liquidity risk management is important for financial institutions to reduce costs associated with liquidity shortfalls.
The document presents a methodology for modeling structural default risk and allocating deposits to money market counterparties. It uses financial ratios like working capital/total assets, retained earnings/total assets, EBIT/total assets, and market value/total liabilities to calculate Z-scores for counterparties based on models by Altman and Merton. Counterparties are categorized as default, troubled credit, or okay based on their Z-scores, and deposit limits are determined accordingly to mitigate counterparty risk. Graphs show how actual and forecasted Z-scores compare over time for sample counterparties.
1) The study analyzes the productivity and determinants of productivity in Korea's ICT industry from 2000-2009.
2) It finds that R&D expenditure and firm age are the key determinants of productivity growth in the ICT industry. R&D and older firms had higher productivity.
3) While hardware productivity grew, the industry needs to focus more on software to maintain growth and competitiveness, as hardware productivity faces constraints from emerging competitors. Investment in software and service firms is recommended.
S.Y. Bancorp Inc. KBW 13th Annual Community Bank Investor Conference Presenta...Company Spotlight
S.Y. Bancorp is a bank holding company headquartered in Louisville, KY that trades on the NASDAQ under the symbol SYBT. It has over $2 billion in assets and provides banking services through its subsidiary, Stock Yards Bank & Trust, which operates 31 locations across Kentucky, Indiana, and Ohio. The presentation outlines SYBT's financial performance, business strategy, and growth opportunities. Key points include its conservative credit culture, significant fee income from wealth management, and potential for further expansion in its market areas.
- Deposits in the Qatari banking sector declined 4.8% month-over-month in July 2013, while loans increased 2.3%, raising the loan-to-deposit ratio to 109%.
- Public sector deposits fell sharply, down 6.5% month-over-month, led by a 8.1% drop in deposits from government institutions which make up 63% of public sector deposits.
- Private sector loan growth was led by a 5.5% increase in consumption and other loans, while real estate loans grew 2.2% and general trade loans grew 1%.
This thesis examines the impact of monetary policy on commercial bank balance sheet variables in sub-Saharan Africa. The study employs a dynamic panel data methodology to investigate the effects of monetary policy, as captured by real interest rates, on bank credit, liquid assets, and deposits using data from 31 sub-Saharan African countries from 2000 to 2014. Diagnostic tests show that the models are valid. The results indicate that monetary policy, bank capitalization levels, and their interaction have significant impacts on balance sheet variables both at the regional level and across sub-Saharan Africa as a whole.
1. Bank lending, liquidity shocks and economic
activity: Evidence from the syndicated loan market
in the U.S.
Tamara Kochubey
CERGE-EI, Prague
March 5, 2013
Brown Bag Seminar
2. Motivation
• Importance of banks as liquidity providers
• Liquidity crisis of 2007-2009
• Lending collapse following the crisis
Figure: New loan originations to U.S. borrowers from 2000 – 2011
(Dealscan).
3. Research questions
Do problems in banking sector can be transmitted to the real
economy through bank lending?
1. Does shock to bank health affect bank lending?
2. Does shock to bank health or change in bank lending
affect the real economy?
4. Related Literature
Impact of deterioration of banks’ financial health on the real
economy:
• Gan (2007), Khwaja and Mian (2008): bank lending and firm
performance in Japan and Pakistan
• Gozzi and Goetz (2010): bank lending and performance in
U.S. metropolitan areas during the recent crisis
• Wardlaw (2010): changes in a bank’s health significantly affect
investment of U.S. firms during 1988-2007
• Driscoll (2004), Ashcraft (2006), Jimenez et al (2010): bank
health has no effect on the real economy
Bank lending behavior during the recent crisis in the U.S.:
• Ivashina and Scharfstein (2010), Cornett et al (2011)
Research Gap: relationship between shocks to bank health and
firm performance in U.S. after the recent financial crisis
5. Contribution to the Literature
• Examine bank lending in the U.S. following the recent financial
crisis using a dataset of new loan originations
• Control for selection bias arising when firms with single lending
relationships are excluded from the analysis
• Study the effect of shocks to bank health and change in bank
lending on firms’ performance in U.S. following the recent
financial crisis
• Provide evidence on how valuable are banking relationships for
medium and large firms
6. Methodology
• Financial crisis of 2007-2009 as a shock to banks’ liquidity
• Collapse of ABCP market and dry-up of the interbank market
• Deposits and core deposits as stable sources of funding
(Ivashina and Scharfstein, 2010; Cornett et al, 2011)
Timeline of the crisis in the TED spread:
Crisis period: 2007 q3 - 2009 q2
7. Methodology
1. Does shock to bank health affect bank lending?
[based on Gan, 2007; Khwaja and Mian, 2008]
Lendingij (t) = β1 + β2 Liq. Exposurei (t − 1) + β3 Bank Controlsi (t − 1)+
+β4 Relationshipij (t − 1) + β5 Firm FEj + eij
Pre-crisis period (t − 1): 2005 q3 - 2007 q2
Post-crisis period (t): 2009 q3 - 2011 q2
• Lendingij : change in log of total credit provided by bank i to firm
j between the post-crisis and the pre-crisis periods
• Liquidity Exposurei : is the share of core deposits to banks’ total
assets measured in the pre-crisis period
• Bank Controlsi : bank size, liquid assets, equity to assets ratio,
non-performing loan ratio, return on assets
• Relationshipij : is the number of years when firm j had a positive
loan amount from bank i in past 10 years (1995-2004)
8. Methodology
Heckman two-stage model
First stage (selection equation):
• Probit (being a firm with multiple lending relationships
(t − 1)) =f (firm and bank controls in (t − 2))
• Bank Controls : size, liquidity, capital ratio, return on assets,
nonperforming loan ratio
• Firm Controls : size, leverage, cash, tangibility,
market-to-book, return on assets, sales
Second stage:
Lendingij (t) = β1 + β2 Liq. Exposurei (t − 1) + β3 Bank Controlsi (t − 1)+
+β4 Relationshipij (t − 1) + β5 Firm FEj + IMR + eij
9. Methodology
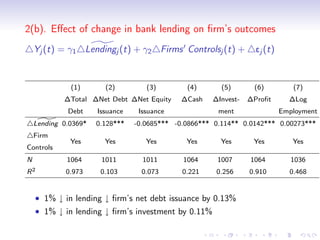
2a. Does shock to bank health affect the real economy?
[based on Gan, 2007; Khwaja and Mian, 2008]
Yj (t) = α1 + α2 Liq. Exposurej (t − 1) + α3 Firms Controlsj (t − 1) + ej
• Yj (t): change in firms’ financial and performance measures
between two periods
• Yj : leverage, net debt and equity issuance, cash holdings,
investment rate, profit and employment
• Liquidity Exposurej : is, for each firm j, the weighted average level of
exposure of the banks that are lending to the firm in the pre-crisis
period; bank liquidity exposure is measured by a share of core
deposits to bank’s total assets
• Firms Controlsj : industry and state dummies, firm size, collateral,
interest coverage, market-to-book ratio, return on assets, cash
holdings, cash flow, leverage, sales, net worth
10. Methodology
2b. Does change in bank lending affect the real economy?
Yj (t) = γ1 Lendingj (t) + γ2 Firms Controlsj (t) + ej (t),
ˆ ˆ
Lendingj (t) = i (β1 + β2 Liquidity Exposurei (t − 1)+
ˆ ˆ
+β3 Bank Controlsi (t − 1) + β4 Relationshipij (t − 1)).
• Yj : change in firms’ leverage, net debt issuance, net equity
issuance, cash holdings, investment rate, profit and employment
• Lendingj : is the predicted change in lending of all banks financing
firm j
• Firms Controlsj : firm size, collateral, market-to-book ratio, return
on assets, cash flow, sales, net worth
11. Data Description
Data sources: U.S. based
1. Thomson Reuters Dealscan - loan transactions
2. FDIC Call Reports – financial statement data for U.S. banks
3. Compustat – balance sheet data for U.S. firms
Sample:
• Pre-crisis period: 2005 q3 - 2007 q2
• Post-crisis period: 2009 q3 - 2011 q2
• Loan-level: 7,074 bank-firm pairs, 110 banks and 3,357 firms
• Firm-level: 1,109 distinct firms
15. 1. Effect of the shock to bank’s liquidity on bank lending
(1) (2) (3)
OLS FE FE
∆Lending ∆Lending ∆Lending
Core Deposits (t-1) 0.298** 0.200** 0.263***
Liquid Assets (t-1) -0.362* -0.201 -0.137
Bank Size (t-1) 0.960 0.773 -0.151
Capital Ratio (t-1) 0.367* 0.248* 0.172
ROA (t-1) 5.580** 3.539** 1.875
NPL (t-1) -1.930 -0.636 0.042
Relationship -2.548*** -1.531*** -1.470***
Inverse Mill’s Ratio 128.9***
Firm FE, multiple firms No Yes Yes
Location and industry dummies Yes No No
N 7,069 6,084 2,741
3,354 x 110 2,222 x 80 877 x 60
R2 0.146 0.725 0.641
• Banks with core deposits 1 SD above the mean ↓ lending by 5 p.p.
while banks with core deposits 1 SD below the mean ↓ lending by
10 p.p.
16. Robustness Checks
1. Effect of the shock to bank’s liquidity on bank lending
(1) (2) (3) (4) (5)
FE FE FE FE FE
∆Lending ∆Lending ∆Lending ∆Lending ∆Lending
Core Deposits (t-1) 26.28*** 26.38*** 28.86*** 28.69*** 25.75***
Liquid Assets (t-1) -13.70 -14.38 -8.339 -9.409 -13.49
Size (t-1) -0.151 -0.365 -0.124 -0.297 -0.128
Capital Ratio (t-1) 17.24 12.92 18.29 14.74 17.26
ROA (t-1) 187.5 184.3 176.7 175.3 183.8
NPL (t-1) 4.229 -11.62 -39.49 -47.84 0.132
Relationship -1.470*** -1.440*** -1.467*** -1.444*** -1.246**
Inverse Mill’s Ratio 128.9*** 128.6*** 128.9*** 128.7*** 127.3***
C&I Loans (t-1) -6.890 -5.494
RE Loans (t-1) 6.586 5.939
Relationship Amount -3.271**
N 2,741 2,741 2,741 2,741 2,741
R2 0.641 0.641 0.642 0.642 0.641
17. Results
2(a). Effect of the shock to bank’s liquidity on firm’s financial
outcomes
Yj (t) = α1 + α2 Liq. Exposurej (t − 1) + α3 Firms Controlsj (t − 1) + ej
(1) (2) (3) (4) (5)
∆Total ∆Long-Term ∆Net Debt ∆Net Equity ∆Cash
Debt Debt Issuance Issuance
Core Deposits 0.299 0.328** 0.168 0.299 -0.0645
Industry and
Yes Yes Yes Yes Yes
State Dummies
Firm Controls Yes Yes Yes Yes Yes
N 933 933 883 883 934
R2 0.179 0.231 0.217 0.281 0.324
• 1% ↓ in average core deposits ↓ firm’s long-term debt by 0.33%
18. Results
2(a). Effect of the shock to bank’s liquidity on firm’s real
outcomes
Yj (t) = α1 + α2 Liq. Exposurej (t − 1) + α3 Firms Controlsj (t − 1) + ej
(1) (2) (3)
∆Investment ∆Profit ∆Log
Employment
Core Deposits -0.107 0.0404*** 19.5
Industry and State Dummies Yes Yes Yes
Firm Controls Yes Yes Yes
N 877 930 903
R2 0.280 0.340 0.295
• 1% ↓ in average core deposits ↓ firm’s profit by 0.04%
• 1 SD ↑ in average core deposits ↓ firm’s profit by 0.3 p.p., or 43%
of average change in profit
19. 2(b). Effect of change in bank lending on firm’s outcomes
Yj (t) = γ1 Lendingj (t) + γ2 Firms Controlsj (t) + ej (t)
(1) (2) (3) (4) (5) (6) (7)
∆Total ∆Net Debt ∆Net Equity ∆Cash ∆Invest- ∆Profit ∆Log
Debt Issuance Issuance ment Employment
Lending 0.0369* 0.128*** -0.0685*** -0.0866*** 0.114** 0.0142*** 0.00273***
Firm
Yes Yes Yes Yes Yes Yes Yes
Controls
N 1064 1011 1011 1064 1007 1064 1036
R2 0.973 0.103 0.073 0.221 0.256 0.910 0.468
• 1% ↓ in lending ↓ firm’s net debt issuance by 0.13%
• 1% ↓ in lending ↓ firm’s investment by 0.11%
20. Conclusion
• Adverse shocks to bank liquidity trigger decline in bank lending
• Banks financed mainly with core deposits have lower decline in
lending
• Bank health is positively related to firm’s long-term debt and
firm’s profit
• Decline in bank lending reduces firm’s total debt, net debt
issuance, investment, profit and employment and increases
firm’s cash holdings and net equity issuance