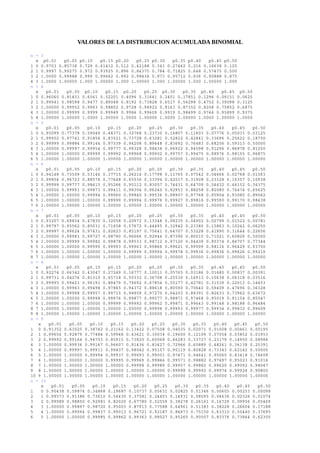
This document contains tables of binomial distribution cumulative probabilities (p-values) for different values of n (number of Bernoulli trials) and x (number of successes). It provides the p-values for several confidence levels between 1% and 50% to determine the probability of observing x or fewer successes out of n trials. The larger tables show that as n increases, the p-values get closer to 0 or 1, indicating the binomial distribution converges to a normal distribution for larger values of n.
This document contains a table listing chi-square distribution values for different degrees of freedom and probability levels. The table includes:
- Degrees of freedom (ν) ranging from 1 to 100+ in the left column.
- Probability levels (p) from 0.001 to 0.5 across the top row.
- The corresponding chi-square distribution critical values within the table.
This document contains a table listing chi-square distribution values for different degrees of freedom and probability levels. The table includes:
- Degrees of freedom (ν) ranging from 1 to 100+ in the left column.
- Various probability levels (p) from 0.001 to 0.5 across the top row.
- The chi-square distribution values at each intersection of ν and p.
Capítulo 35 (5th edition) con soluciones la naturaleza de la luz y las leyes ..... ..
solucionario serway 5 edicion en ingles todos los capitulos completo
http://www.mediafire.com/?gbug20dgh2lbv2h
-------------------------------------------------------------------------------------------------------------
Capítulo 35 (5th edition) con soluciones serway volumen 2 edicion 5,
Capítulo 35 (5th edition) con soluciones la naturaleza de la luz y las leyes de la optica geometrica,Capítulo 35 la naturaleza de la luz solucionario,Capítulo 35 la naturaleza de la luz ejemplos,Capítulo 35 la naturaleza de la luz ejercicios,Capítulo 35 las leyes de la optica geometrica,Capítulo 35 solucionario serway
This document contains a table listing chi-square distribution values for different degrees of freedom and probability levels. The table includes:
- Degrees of freedom (ν) ranging from 1 to 100+ in the left column.
- Various probability levels (p) from 0.001 to 0.5 across the top row.
- The chi-square distribution values at each intersection of ν and p.
Este documento resume la resolución de varias inecuaciones de segundo grado a través del método de estudiar el signo de los polinomios. Se analizan 11 inecuaciones separadas encontrando los intervalos de solución a través de determinar los ceros y el signo de cada polinomio en diferentes puntos.
This document contains a table listing chi-square distribution values for different degrees of freedom and probability levels. The table includes:
- Degrees of freedom (ν) ranging from 1 to 100+ in the left column.
- Probability levels (p) from 0.001 to 0.5 across the top row.
- The corresponding chi-square distribution critical values within the table.
This document contains a table listing chi-square distribution values for different degrees of freedom and probability levels. The table includes:
- Degrees of freedom (ν) ranging from 1 to 100+ in the left column.
- Various probability levels (p) from 0.001 to 0.5 across the top row.
- The chi-square distribution values at each intersection of ν and p.
Capítulo 35 (5th edition) con soluciones la naturaleza de la luz y las leyes ..... ..
solucionario serway 5 edicion en ingles todos los capitulos completo
http://www.mediafire.com/?gbug20dgh2lbv2h
-------------------------------------------------------------------------------------------------------------
Capítulo 35 (5th edition) con soluciones serway volumen 2 edicion 5,
Capítulo 35 (5th edition) con soluciones la naturaleza de la luz y las leyes de la optica geometrica,Capítulo 35 la naturaleza de la luz solucionario,Capítulo 35 la naturaleza de la luz ejemplos,Capítulo 35 la naturaleza de la luz ejercicios,Capítulo 35 las leyes de la optica geometrica,Capítulo 35 solucionario serway
This document contains a table listing chi-square distribution values for different degrees of freedom and probability levels. The table includes:
- Degrees of freedom (ν) ranging from 1 to 100+ in the left column.
- Various probability levels (p) from 0.001 to 0.5 across the top row.
- The chi-square distribution values at each intersection of ν and p.
Este documento resume la resolución de varias inecuaciones de segundo grado a través del método de estudiar el signo de los polinomios. Se analizan 11 inecuaciones separadas encontrando los intervalos de solución a través de determinar los ceros y el signo de cada polinomio en diferentes puntos.
Este documento presenta la distribución t de Student, que surge al estimar la media de una población normalmente distribuida con una muestra pequeña. La distribución t depende del número de grados de libertad y es independiente de la media y varianza poblacional, lo que la hace útil para estimar estas medidas con muestras pequeñas. Se define matemáticamente y se especifica que depende de la función gamma.
This document contains a table that provides the values of the t-distribution for different probabilities and degrees of freedom. The table gives the areas 1-α and values c = t1-α,r, where P[T ≤ c] = 1- α, and where T has a t-Student distribution with r degrees of freedom. The table includes values for probabilities of 0.75, 0.80, 0.85, 0.90, 0.95, 0.975, 0.99, and 0.995 and degrees of freedom ranging from 1 to infinity.
El documento describe el método de Broyden-Fletcher-Goldfarb-Shanno (BFGS) para encontrar el mínimo de una función mediante aproximaciones sucesivas de la inversa de la matriz hessiana. El método genera una secuencia de puntos que convergen a una solución óptima minimizando iterativamente la función objetivo. Se presenta un ejemplo numérico para ilustrar los cálculos iterativos requeridos por el método BFGS.
El documento describe el método del gradiente (ascenso y descenso máximos) para la optimización de funciones. El método genera vectores de dirección basados en el gradiente de la función objetivo y encuentra el punto óptimo iterativamente moviéndose en la dirección del gradiente. Se provee un ejemplo numérico para ilustrar los pasos del método para minimizar una función de dos variables.
The document contains two tables (A and B) related to probability and statistics. Table A provides the standard normal distribution probabilities for different z-values. Table B lists the critical values of the Student's t-distribution for various probabilities and degrees of freedom. The t-table provides the t-value required to obtain a given probability for the corresponding degrees of freedom.
Este documento presenta conceptos básicos sobre distribuciones de probabilidad para variables aleatorias discretas. Introduce las nociones de variable aleatoria, función de probabilidad y distribución de probabilidad. Explica las diferencias entre variables aleatorias discretas y continuas. Además, describe las distribuciones binomial, hipergeométrica y de Poisson como modelos probabilísticos comunes para variables discretas, ilustrando sus propiedades con ejemplos.
Como se utiliza la tabla t de student Irving THdez
This document provides a table of quantile values for different degrees of freedom. The table is used to define the Student's t-distribution, which is utilized in the analysis to distinguish between distinct quantile values for various levels of freedom. Specifically, the table is analyzed for a Student with 3 degrees of freedom, where the quantile is found to be approximately 0.8834 for a 90% confidence level. The quantile values allow distinguishing different confidence levels for statistical analyses with students t-distributions.
Guía para el calculo de la distribución normalIsaac Gomez
Este documento proporciona instrucciones para calcular probabilidades utilizando la distribución normal estándar. Explica cómo usar la fórmula para encontrar z y luego buscar el valor de z en la tabla para obtener la probabilidad correspondiente. También muestra un ejemplo de cómo calcular P(z=0.25) y ejercicios para calcular otras probabilidades como P(Z ≤ 1.47) y P(Z > 1.47).
1) La probabilidad de Poisson describe eventos aleatorios independientes que ocurren continuamente en el tiempo o espacio. 2) Un proceso de Poisson implica eventos aleatorios que ocurren en intervalos continuos de tiempo o regiones. 3) La distribución de Poisson se aplica cuando se realizan muchos experimentos binomiales con una probabilidad de éxito baja y un número grande de pruebas.
This document appears to contain a table of binomial probabilities. It lists values of p (probability of success) from 0.01 to 0.99 across the top and values of n (number of trials) from 1 to 14 down the left side. Within the body of the table are values that represent the probability of getting x successes in n trials given the probability p of success on each trial. The table provides precise probabilities for a wide range of binomial probability distributions.
Este documento presenta una serie de ejercicios de matemáticas financieras relacionados con el interés simple y compuesto. Los ejercicios calculan valores como el tiempo, monto, capital e interés para diferentes escenarios financieros como inversiones y préstamos. Se proporcionan datos como el capital inicial, la tasa de interés y el período para cada ejercicio.
1) The table shows the Chi-square distribution with values of x for different degrees of freedom (g) and probabilities (p) of x being greater than the table value.
2) For a given g and p, x is the Chi-square value such that the probability of being greater than x is equal to p.
3) The table provides Chi-square values for probabilities of 0.001 to 0.999 and degrees of freedom from 0 to 100.
This document discusses monitoring distributed high performance computing systems. It describes using the Nudnik infrastructure monitoring tool to collect metrics from systems, parse the metrics, and take actions. Nudnik can collect baseline metrics with small latencies, load test metrics under CPU, memory, disk and network stress, and introduce chaos by setting failure percentages or response latencies randomly. It reports metrics to databases and services like InfluxDB, Elasticsearch and Prometheus.
This document provides a present value table showing the present value of $1 to be received in the future, for different interest rates and time periods. The table allows users to look up the factor to discount a future cash flow back to its present value. It also includes cumulative present value formulas to calculate the present value of a series of future cash flows.
This document contains tables and formulae related to present value calculations. The tables show the present value of receiving $1 in the future under different interest rates and time periods. The formulae provided valuation models for perpetual preference shares, ordinary shares with constant dividends, and ordinary shares with growing dividends. An additional formula calculates the present value of perpetual bonds.
The document contains survey data from a road construction project including coordinates, elevations, cut depths, embankment heights, and volumes of material removed and placed at regular intervals along the road. The data is presented in a table with distance along the road in the first column and corresponding coordinate, elevation, cut, embankment and volume metrics in subsequent columns.
This document contains tables of probability values corresponding to the area under the normal distribution curve for given z-values. There are three tables that provide the probability of a statistic being: 1) between 0 and z, 2) less than z, and 3) greater than z. The tables allow looking up the cumulative probability for any z-value between 0 and 3 with increments of 0.01.
This document contains sample data and calculations for determining statistical properties of distributions. It includes:
1) A sample data set with calculations to determine the mean, standard deviation, and normal distribution parameters.
2) A second sample data set presented as a histogram with calculations to fit both a normal and lognormal distribution.
3) Examples of using common statistical equations like the CDF and PDF for uniform and normal distributions to analyze sample data sets.
The document outlines the costs and projected financials for opening a cantina named D.C.R.C. The key details include:
- Setup costs of 600,000 tk with equipment costs of 200,000 tk
- Projected monthly net income of 90,000 tk per month over 5 years
- Payback period of 11 months and 27 days
- Discounted payback period of 1 year and 3 days
- Internal rate of return of 11.23244%
- Net present value of 39,49,762 tk
El documento discute los enfoques teórico y estadístico para definir la normalidad. Define la normalidad estadísticamente como observaciones que ocurren con frecuencia de acuerdo a un modelo matemático teórico, como la curva de Gauss. Sin embargo, señala limitaciones de este enfoque como que algunas variables biológicas no siguen distribuciones normales y que definir como anormal observaciones infrecuentes pero sanas no es apropiado.
Este documento proporciona instrucciones para realizar análisis estadísticos descriptivos básicos en Excel, incluidos histogramas, tablas de frecuencias y estadísticos. Explica cómo cargar el módulo de análisis de datos en Excel y usar herramientas como estadística descriptiva, histogramas y tablas dinámicas para tabular y resumir datos. También incluye ejemplos con datos reales sobre cómo construir estas tablas y gráficos para variables cualitativas y cuantitativas discret
1. O documento analisa a transição da fecundidade na Inglaterra e Gales, examinando a continuidade e mudança nos padrões de fertilidade conjugal ao longo do tempo.
2. Os resultados sugerem que houve controle deliberado da fecundidade e mudanças graduais nos níveis de fecundidade geral.
3. A fertilidade conjugal foi dominante sobre o casamento e esteve associada a variáveis socioeconômicas, indicando continuidade no processo de mudança dos padrões de fecundidade.
Este documento presenta una introducción al análisis estadístico espacial. Explica conceptos básicos como la dependencia espacial, la autocorrelación espacial y el variograma. También describe la arquitectura de los sistemas de información geográfica y diferentes representaciones geométricas de datos espaciales. Finalmente, propone un ejemplo para ilustrar los conceptos.
El documento presenta un análisis bayesiano de las tasas de fecundidad del Brasil según los datos del censo de 2010. Introduce el tema de la modelación estadística de la fecundidad y los cambios observados recientemente. Luego describe la modelación bayesiana aplicada y los resultados obtenidos, concluyendo con las conclusiones del estudio.
El autor expresa su preocupación por la actitud de los estudiantes que solicitan cambios en sus calificaciones finales a pesar de no haber demostrado el esfuerzo o desempeño necesarios durante el semestre. El autor señala que 12 estudiantes, equivalentes al 10% de su clase, le pidieron cambiar sus notas después de haber sido comunicadas. El autor argumenta que esta actitud pone en riesgo los estándares académicos y puede tener consecuencias graves cuando estos estudiantes se gradúan e ingresan al mundo laboral.
Este documento describe las diferentes clasificaciones de variables estadísticas, incluyendo su naturaleza, escala de medición y operatividad. Define variables cualitativas y cuantitativas, y explica las escalas nominal, ordinal, de intervalo y de razón. Además, incluye un taller práctico para clasificar variables según estas categorías.
The document appears to contain statistical data organized into a table with over 100 rows and columns. It includes values ranging from around 1.5 to over 250. The data is grouped into categories including degrees of freedom, sample sizes ranging from 1 to over 10,000, and values in increments of 1 from 1 to 30 or more.
This document contains a table with percentiles for the chi-squared distribution across various degrees of freedom (g.l.) and significance levels. It shows the critical value needed to reject the null hypothesis for different sample sizes and confidence levels in chi-squared tests of independence and goodness of fit.
The document contains two columns of numbers. The first column appears to list percentile values from 0 to 100 in increments of 0.1. The second column lists corresponding z-score values for each given percentile. The table provides a way to convert between percentiles and z-scores for common statistical calculations and analyses.
El documento proporciona instrucciones sobre cómo sobrevivir a un terremoto o derrumbe de edificios. Explica que es más seguro acostarse al lado de muebles grandes y pesados en lugar de debajo de ellos, ya que esto crea un "triángulo de vida" que protege del derrumbe. También recomienda salir de vehículos y edificios de madera si es posible, y evitar escaleras y puertas durante un sismo. El objetivo es que esta información se comparta para ayudar a salvar vidas.
Este documento presenta 28 problemas de probabilidad y estadística que involucran diferentes distribuciones de probabilidad continuas como la normal, gamma, Weibull, Poisson y beta. Los problemas cubren temas como intervalos de confianza, funciones de densidad, probabilidades, medias y desviaciones estándar.
La variable aleatoria X representa el número de caras obtenidas al lanzar 3 monedas. Se define la función de probabilidad f(x) que asigna la probabilidad de cada valor posible de X. La función de distribución acumulada F(x) da la probabilidad de que X sea menor o igual a x. Para variables continuas, la probabilidad de un valor puntual es 0, pero se puede calcular la probabilidad de un intervalo como el área bajo la curva de la función de densidad entre los límites del intervalo. El valor esperado y la varianza proporcionan
El documento presenta una serie de fotos y citas sobre lugares y monumentos históricos de la India, incluyendo el Palacio Rojo y la Puerta de la India en Nueva Delhi, el Taj Mahal y el Fuerte Rojo en Agra, y palacios reales en Jaipur. A lo largo de las imágenes, ofrece proverbios y dichos hindúes sobre temas como el conocimiento, la sabiduría, la vida y la muerte. El objetivo parece ser compartir la belleza arquitectónica de la India a través de estas fotografías y
Este documento presenta una introducción a los fundamentos de la estadística. Explica que la estadística se ocupa de recolectar, analizar y hacer inferencias sobre datos con variabilidad. Define la estadística descriptiva como aquella que describe datos, mientras la estadística inferencial generaliza resultados de muestras a poblaciones. Finalmente, introduce conceptos básicos como población, muestra, parámetro, estadístico y variable.
R es un lenguaje de programación y entorno para análisis de datos. Permite crear y manipular vectores, realizar cálculos estadísticos y generar gráficos. El documento explica cómo descargar e instalar R, crear y manipular vectores mediante funciones como c(), sum(), mean(), entre otras. También cubre funciones para realizar operaciones matemáticas, estadísticas y trigonométricas, y cómo crear funciones propias para realizar cálculos como restar la media a cada componente de un vector.
Este documento presenta fórmulas útiles para calcular probabilidades. Incluye fórmulas para el número de permutaciones y combinaciones, probabilidad simple y condicional, probabilidad de la unión y la intersección de eventos, probabilidad del evento contrario, independencia de eventos y la regla de Bayes.
Chapter wise All Notes of First year Basic Civil Engineering.pptxDenish Jangid
Chapter wise All Notes of First year Basic Civil Engineering
Syllabus
Chapter-1
Introduction to objective, scope and outcome the subject
Chapter 2
Introduction: Scope and Specialization of Civil Engineering, Role of civil Engineer in Society, Impact of infrastructural development on economy of country.
Chapter 3
Surveying: Object Principles & Types of Surveying; Site Plans, Plans & Maps; Scales & Unit of different Measurements.
Linear Measurements: Instruments used. Linear Measurement by Tape, Ranging out Survey Lines and overcoming Obstructions; Measurements on sloping ground; Tape corrections, conventional symbols. Angular Measurements: Instruments used; Introduction to Compass Surveying, Bearings and Longitude & Latitude of a Line, Introduction to total station.
Levelling: Instrument used Object of levelling, Methods of levelling in brief, and Contour maps.
Chapter 4
Buildings: Selection of site for Buildings, Layout of Building Plan, Types of buildings, Plinth area, carpet area, floor space index, Introduction to building byelaws, concept of sun light & ventilation. Components of Buildings & their functions, Basic concept of R.C.C., Introduction to types of foundation
Chapter 5
Transportation: Introduction to Transportation Engineering; Traffic and Road Safety: Types and Characteristics of Various Modes of Transportation; Various Road Traffic Signs, Causes of Accidents and Road Safety Measures.
Chapter 6
Environmental Engineering: Environmental Pollution, Environmental Acts and Regulations, Functional Concepts of Ecology, Basics of Species, Biodiversity, Ecosystem, Hydrological Cycle; Chemical Cycles: Carbon, Nitrogen & Phosphorus; Energy Flow in Ecosystems.
Water Pollution: Water Quality standards, Introduction to Treatment & Disposal of Waste Water. Reuse and Saving of Water, Rain Water Harvesting. Solid Waste Management: Classification of Solid Waste, Collection, Transportation and Disposal of Solid. Recycling of Solid Waste: Energy Recovery, Sanitary Landfill, On-Site Sanitation. Air & Noise Pollution: Primary and Secondary air pollutants, Harmful effects of Air Pollution, Control of Air Pollution. . Noise Pollution Harmful Effects of noise pollution, control of noise pollution, Global warming & Climate Change, Ozone depletion, Greenhouse effect
Text Books:
1. Palancharmy, Basic Civil Engineering, McGraw Hill publishers.
2. Satheesh Gopi, Basic Civil Engineering, Pearson Publishers.
3. Ketki Rangwala Dalal, Essentials of Civil Engineering, Charotar Publishing House.
4. BCP, Surveying volume 1
This slide is special for master students (MIBS & MIFB) in UUM. Also useful for readers who are interested in the topic of contemporary Islamic banking.
Reimagining Your Library Space: How to Increase the Vibes in Your Library No ...Diana Rendina
Librarians are leading the way in creating future-ready citizens – now we need to update our spaces to match. In this session, attendees will get inspiration for transforming their library spaces. You’ll learn how to survey students and patrons, create a focus group, and use design thinking to brainstorm ideas for your space. We’ll discuss budget friendly ways to change your space as well as how to find funding. No matter where you’re at, you’ll find ideas for reimagining your space in this session.
How to Setup Warehouse & Location in Odoo 17 InventoryCeline George
In this slide, we'll explore how to set up warehouses and locations in Odoo 17 Inventory. This will help us manage our stock effectively, track inventory levels, and streamline warehouse operations.
LAND USE LAND COVER AND NDVI OF MIRZAPUR DISTRICT, UPRAHUL
This Dissertation explores the particular circumstances of Mirzapur, a region located in the
core of India. Mirzapur, with its varied terrains and abundant biodiversity, offers an optimal
environment for investigating the changes in vegetation cover dynamics. Our study utilizes
advanced technologies such as GIS (Geographic Information Systems) and Remote sensing to
analyze the transformations that have taken place over the course of a decade.
The complex relationship between human activities and the environment has been the focus
of extensive research and worry. As the global community grapples with swift urbanization,
population expansion, and economic progress, the effects on natural ecosystems are becoming
more evident. A crucial element of this impact is the alteration of vegetation cover, which plays a
significant role in maintaining the ecological equilibrium of our planet.Land serves as the foundation for all human activities and provides the necessary materials for
these activities. As the most crucial natural resource, its utilization by humans results in different
'Land uses,' which are determined by both human activities and the physical characteristics of the
land.
The utilization of land is impacted by human needs and environmental factors. In countries
like India, rapid population growth and the emphasis on extensive resource exploitation can lead
to significant land degradation, adversely affecting the region's land cover.
Therefore, human intervention has significantly influenced land use patterns over many
centuries, evolving its structure over time and space. In the present era, these changes have
accelerated due to factors such as agriculture and urbanization. Information regarding land use and
cover is essential for various planning and management tasks related to the Earth's surface,
providing crucial environmental data for scientific, resource management, policy purposes, and
diverse human activities.
Accurate understanding of land use and cover is imperative for the development planning
of any area. Consequently, a wide range of professionals, including earth system scientists, land
and water managers, and urban planners, are interested in obtaining data on land use and cover
changes, conversion trends, and other related patterns. The spatial dimensions of land use and
cover support policymakers and scientists in making well-informed decisions, as alterations in
these patterns indicate shifts in economic and social conditions. Monitoring such changes with the
help of Advanced technologies like Remote Sensing and Geographic Information Systems is
crucial for coordinated efforts across different administrative levels. Advanced technologies like
Remote Sensing and Geographic Information Systems
9
Changes in vegetation cover refer to variations in the distribution, composition, and overall
structure of plant communities across different temporal and spatial scales. These changes can
occur natural.
How to Fix the Import Error in the Odoo 17Celine George
An import error occurs when a program fails to import a module or library, disrupting its execution. In languages like Python, this issue arises when the specified module cannot be found or accessed, hindering the program's functionality. Resolving import errors is crucial for maintaining smooth software operation and uninterrupted development processes.
How to Make a Field Mandatory in Odoo 17Celine George
In Odoo, making a field required can be done through both Python code and XML views. When you set the required attribute to True in Python code, it makes the field required across all views where it's used. Conversely, when you set the required attribute in XML views, it makes the field required only in the context of that particular view.
How to Manage Your Lost Opportunities in Odoo 17 CRMCeline George
Odoo 17 CRM allows us to track why we lose sales opportunities with "Lost Reasons." This helps analyze our sales process and identify areas for improvement. Here's how to configure lost reasons in Odoo 17 CRM
Beyond Degrees - Empowering the Workforce in the Context of Skills-First.pptxEduSkills OECD
Iván Bornacelly, Policy Analyst at the OECD Centre for Skills, OECD, presents at the webinar 'Tackling job market gaps with a skills-first approach' on 12 June 2024
বাংলাদেশের অর্থনৈতিক সমীক্ষা ২০২৪ [Bangladesh Economic Review 2024 Bangla.pdf] কম্পিউটার , ট্যাব ও স্মার্ট ফোন ভার্সন সহ সম্পূর্ণ বাংলা ই-বুক বা pdf বই " সুচিপত্র ...বুকমার্ক মেনু 🔖 ও হাইপার লিংক মেনু 📝👆 যুক্ত ..
আমাদের সবার জন্য খুব খুব গুরুত্বপূর্ণ একটি বই ..বিসিএস, ব্যাংক, ইউনিভার্সিটি ভর্তি ও যে কোন প্রতিযোগিতা মূলক পরীক্ষার জন্য এর খুব ইম্পরট্যান্ট একটি বিষয় ...তাছাড়া বাংলাদেশের সাম্প্রতিক যে কোন ডাটা বা তথ্য এই বইতে পাবেন ...
তাই একজন নাগরিক হিসাবে এই তথ্য গুলো আপনার জানা প্রয়োজন ...।
বিসিএস ও ব্যাংক এর লিখিত পরীক্ষা ...+এছাড়া মাধ্যমিক ও উচ্চমাধ্যমিকের স্টুডেন্টদের জন্য অনেক কাজে আসবে ...