Swedbank's Interim Report Q3 2014
•
0 likes•610 views

Swedbank's Interim Report for the third quarter 2014.

Recommended
Recommended
More Related Content
What's hot
What's hot (20)
Viewers also liked
Viewers also liked (17)
Similar to Swedbank's Interim Report Q3 2014
Similar to Swedbank's Interim Report Q3 2014 (20)
More from Swedbank
More from Swedbank (20)
Recently uploaded
Recently uploaded (20)
Swedbank's Interim Report Q3 2014
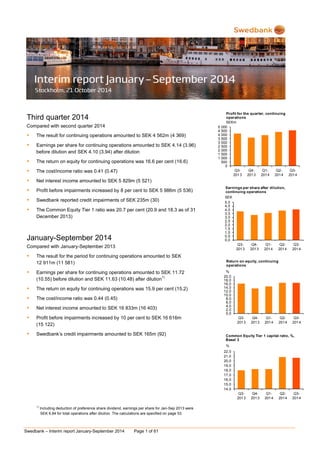
- 1. Swedbank – Interim report January-September 2014 Page 1 of 61 Third quarter 2014 Compared with second quarter 2014 The result for continuing operations amounted to SEK 4 562m (4 369) Earnings per share for continuing operations amounted to SEK 4.14 (3.96) before dilution and SEK 4.10 (3.94) after dilution The return on equity for continuing operations was 16.6 per cent (16.6) The cost/income ratio was 0.41 (0.47) Net interest income amounted to SEK 5 829m (5 521) Profit before impairments increased by 8 per cent to SEK 5 986m (5 536) Swedbank reported credit impairments of SEK 235m (30) The Common Equity Tier 1 ratio was 20.7 per cent (20.9 and 18.3 as of 31 December 2013) January-September 2014 Compared with January-September 2013 The result for the period for continuing operations amounted to SEK 12 911m (11 581) Earnings per share for continuing operations amounted to SEK 11.72 (10.55) before dilution and SEK 11.63 (10.48) after dilution1) The return on equity for continuing operations was 15.9 per cent (15.2) The cost/income ratio was 0.44 (0.45) Net interest income amounted to SEK 16 833m (16 403) Profit before impairments increased by 10 per cent to SEK 16 616m (15 122) Swedbank’s credit impairments amounted to SEK 165m (92) 1) Including deduction of preference share dividend, earnings per share for Jan-Sep 2013 were SEK 6.84 for total operations after dilution. The calculations are specified on page 53. 0 500 1 000 1 500 2 000 2 500 3 000 3 500 4 000 4 500 5 000 Q3- 2013 Q4- 2013 Q1- 2014 Q2- 2014 Q3- 2014 SEKm Profit for the quarter, continuing operations 0,0 0,5 1,0 1,5 2,0 2,5 3,0 3,5 4,0 4,5 5,0 Q3- 2013 Q4- 2013 Q1- 2014 Q2- 2014 Q3- 2014 SEK Earnings per share after dilution, continuing operations 0,0 2,0 4,0 6,0 8,0 10,0 12,0 14,0 16,0 18,0 20,0 Q3- 2013 Q4- 2013 Q1- 2014 Q2- 2014 Q3- 2014 % Return on equity, continuing operations 14,0 15,0 16,0 17,0 18,0 19,0 20,0 21,0 22,0 Q3- 2013 Q4- 2013 Q1- 2014 Q2- 2014 Q3- 2014 % Common Equity Tier 1 capital ratio, %, Basel 3
- 2. Swedbank – Interim report January-September 2014 Page 2 of 61 CEO Comment Market The global recovery is out of step. The US economy continues to grow, while weaker growth in parts of Europe is creating uncertainty about the eurozone’s recovery. Sweden’s economy is relatively strong, but low inflation is raising pressure on the Riksbank to further reduce interest rates. Although we have not yet seen any financial effects on our Baltic operations from the turmoil in Russia and Ukraine, the fragile global economy could affect growth in our four home markets. Strong result The real estate market in Sweden continues to grow. In our Swedish operations this is reflected in lending growth, especially in major urban areas. Our lending business has strengthened among large corporates as well. This raised net interest income during the quarter, whilst coming under pressure from falling interest rates. Net commission income was stable. In our Baltic operations the service model and multi-channel strategy have paved the way for new business. In the Swedish operations seasonally higher card commissions contributed to the result at the same time that we are seeing margin pressure on new sales in the savings area. Expenses decreased, mainly as a result of lower one-off expenses, but also due to lower staff costs within central functions. As a whole, our result for the third quarter was strong. Customers are our most important driving force The strong result gives us good opportunities, but we have to continue to work with internal efficiencies. The banking sector is undergoing major change, not least due to rapid technological development. Furthermore, new regulations are opening up parts of the financial market to new players and strengthening consumer power by making it easier to compare and choose between competing offers. More customers are realising the value of managing their finances through digital channels and appreciate services that make their lives simpler. Babs Micro and Swish for businesses are examples of services that simplify payment flows for small businesses. Swish, which has attracted 3 600 business customers of Swedbank and the savings banks since its launch in June, provides a comprehensive overview of their customers and can help them to grow their businesses. To provide our 8 million private customers and 600 000 corporate customers with broad-based access to competitively priced services, we have to create room for more and better designed customer solutions. This, coupled with the low inflation rate and low interest rate environment, means we have to cut our costs. Our intention is to lower total expenses for 2016 towards SEK 16bn. Savings will be achieved through cost synergies from the integration of Sparbanken Öresund and lower expenses due to digitisation and changing distribution forms, as well as through staff reductions. During the next two years 600-800 employees will leave the bank mainly through attrition. Outside recruitments will only be made in exceptional circumstances, which will put significant demands on internal mobility and flexibility. We will therefore focus on competence building and further development for our employees. This will improve the opportunities for career development in the bank. These competence-building measures and our employees’ experience from various parts of the bank will help us to develop smart and effective solutions – and make us even better at meeting customer expectations. We want to give our customers more in the form of freedom of choice and greater transparency, through the potential offered by technology, to make it easier for them to compare our products and services with those of others. Our customers should feel confident that they receive competitive offers from Swedbank – from both a Swedish and international perspective. Housing issue remains important The high debt levels of Swedish households remain an important topic of debate among politicians and authorities as well as banks. Further measures were taken during the third quarter to ease the growing debt problem by requiring mortgage borrowers to amortise and raising the risk weight floor on mortgages. However, addressing the underlying problem of a housing shortage will require further action. Michael Wolf President and CEO
- 3. Swedbank – Interim report January-September 2014 Page 3 of 61 Table of contents Page Financial summary 4 Overview 5 Market 5 Important to note 5 Third quarter 2014 compared with second quarter 2014 5 Result 5 January-September 2014 compared with January-September 2013 6 Result 6 Credit and asset quality 7 Funding and liquidity 8 Ratings 8 Capital and capital adequacy 8 Operational risks 10 Other events 10 Events after 30 September 2014 10 Business segments Swedish Banking 11 Large Corporates & Institutions 13 Baltic Banking 15 Group Functions & Other 17 Eliminations 19 Product areas 20 Financial information Group Income statement, condensed 25 Statement of comprehensive income, condensed 26 Key ratios 27 Balance sheet, condensed 28 Statement of changes in equity, condensed 29 Cash flow statement, condensed 30 Notes 30 Parent company 55 Signatures of the Board of Directors and the President 60 Review report 60 Contact information 61 More detailed information can be found in Swedbank’s fact book, www.swedbank.com/ir, under Financial information and publications.
- 4. Swedbank – Interim report January-September 2014 Page 4 of 61 Financial summary Income statement Q3 Q2 Q3 Jan-Sep Jan-Sep SEKm 2014 2014 % 2013 % 2014 2013 % Net interest income 5 829 5 521 6 5 641 3 16 833 16 403 3 Net commission income 2 816 2 813 0 2 520 12 8 322 7 433 12 Net gains and losses on financial items at fair value 799 773 3 170 1 917 1 023 87 Other income 706 1 348 -48 894 -21 2 853 2 427 18 Total income 10 150 10 455 -3 9 225 10 29 925 27 286 10 Staff costs 2 469 2 901 -15 2 328 6 7 807 7 077 10 Other expenses 1 695 2 018 -16 1 667 2 5 502 5 087 8 Total expenses 4 164 4 919 -15 3 995 4 13 309 12 164 9 Profit before impairments 5 986 5 536 8 5 230 14 16 616 15 122 10 Impairment of intangible assets 0 1 0 1 170 -99 Impairment of tangible assets 19 69 -72 95 -80 223 382 -42 Credit impairments 235 30 -56 165 92 79 Operating profit 5 732 5 436 5 5 191 10 16 227 14 478 12 Tax expense 1 164 1 063 10 998 17 3 301 2 887 14 Profit for the period from continuing operations 4 568 4 373 4 4 193 9 12 926 11 591 12 Profit for the period from discontinued operations, after tax -2 -230 -99 -15 -87 -259 -2 292 -89 Profit for the period 4 566 4 143 10 4 178 9 12 667 9 299 36 Profit for the period attributable to the shareholders of Swedbank AB 4 560 4 139 10 4 172 9 12 652 9 289 36 Q3 Q2 Q3 Jan-Sep Jan-Sep Key ratios and data per share 2014 2014 2013 2014 2013 Return on equity, continuing operations, % 16.6 16.6 16.2 15.9 15.2 Return on equity, total operations, % 16.6 15.8 16.1 15.6 12.2 Earnings per share before dilution, continuing operations, SEK 1) 4.14 3.96 3.82 11.72 10.55 Earnings per share after dilution, continuing operations, SEK 1) 4.10 3.94 3.79 11.63 10.48 Cost/income ratio 0.41 0.47 0.43 0.44 0.45 Loan/deposit ratio, % 193 189 202 193 202 Common Equity Tier 1 capital ratio, %, Basel 3 2) 20.7 20.9 18.0 20.7 18.0 Tier 1 capital ratio, %, Basel 3 2) 21.9 22.1 19.3 21.9 19.3 Total capital ratio, %, Basel 3 2) 24.9 25.3 20.4 24.9 20.4 Credit impairment ratio, % 0.07 0.01 -0.02 0.02 0.01 Share of impaired loans, gross, % 0.47 0.44 0.69 0.47 0.69 Total provision ratio for impaired loans, % 55 56 53 55 53 Balance sheet data 30 Sep 31 Dec 30 Sep SEKbn 2014 2013 % 2013 % Loans to the public 1 341 1 265 6 1 248 7 Deposits and borrowings from the public 686 621 11 624 10 Shareholders' equity 111 110 2 106 5 Total assets 2 078 1 824 14 1 836 13 Risk exposure amount, Basel 3 2) 410 441 -7 446 -8 1) Including deduction of the preference share dividend, earnings per share for January-September 2013 were SEK 6.84 for total operations after dilution. The calculations are specified on page 53. 2) The capital ratios for 2013 are based on Swedbank’s knowledge of the new regulations at that point in time. The key ratios are based on profit and shareholders’ equity attributable to shareholders of Swedbank. Key ratios and text comments regarding lending and deposits relate to volumes excluding Swedish National Debt Office and repos.
- 5. Swedbank – Interim report January-September 2014 Page 5 of 61 Overview Market The global economy sent mixed signals with several new geopolitical risks. US growth was stronger than expected during the second quarter at the same time that the labour market improved. At the same time uncertainty about the strength of the recovery persists, and with it the timing of a US rate hike. In China a number of measures were taken to prevent a bigger economic slowdown. Weaker growth in Germany, France and Italy created increased uncertainty about the recovery in the eurozone despite the ECB cutting its benchmark rates and introducing further monetary stimuli during the autumn. The Swedish economy grew by 2.6 per cent during the second quarter year-on-year. The picture was mixed, however. The higher growth was driven by increased private consumption and a significant rise in residential construction, while the export industry was limited by weak international demand. Sweden’s economic growth is being jeopardised by a shaky global economy and uncertainty about the new government’s economic policies and weak parliamentary support. The Swedish krona weakened against the dollar in the wake of the Federal Reserve’s tapering monetary stimulus and stronger US growth. At the same time the krona appreciated against the euro, which raised pressure on the Riksbank to take further action to reduce the risk of a continuing decline in inflation. Sweden’s low inflation, which in September was negative for the second consecutive month, is raising the pressure on the Riksbank to cut the repo rate in the fourth quarter from the current 0.25 per cent. In addition to falling commodity prices and growing international competition, digitisation is adding to Sweden’s low inflation. Low global inflation, increased geopolitical risks and expectations of continued low interest rates contributed to a decline in long-term bond yields during the third quarter, not least in Europe. Future growth is also uncertain in the Baltic region due to the conflict between Russia and Ukraine and geopolitical risks. There is no quick solution to the conflict, and the outlook for the Russian economy is weak in both the short and long term. Growth in the Baltic countries was still relatively strong during the second quarter at 3.3 per cent in Lithuania, 2.4 per cent in Estonia and 2.3 per cent in Latvia. With weak demand from key export markets, domestic demand continued to drive growth. Exports to Russia decreased at the same time that the effects of the Russian sanctions in August were limited to a few manufacturing industries. Thus far the slowdown in exports to Russia has been offset by increased demand from other markets. Investments fell slightly, but are likely to be more affected during the second half-year. Household consumption growth was sustained by increased disposable incomes, although consumer confidence weakened at the end of the third quarter, indicating the possibility of greater cautiousness. The Stockholm stock exchange (OMXSPI) gained 6 per cent during the first nine months. The Tallinn stock exchange (OMXTGI) fell by 6 per cent and the Riga stock exchange (OMXRGI) by 8 per cent, while the Vilnius stock exchange (OMXVGI) gained 9 per cent. Important to note Increased digitisation is producing greater competition, and with it price pressure. At the same time banking products and services are becoming more similar, making it essential that the bank maintains competitive prices. Because of this, we have to work continuously to cut costs. The intention for 2016 is to lower the cost level towards SEK 16bn. The savings consist of cost synergies related to the acquisition of Sparbanken Öresund, lower expenses due to digitisation and changing distribution forms, as well as reduced staff mainly in central functions. The staff reduction is expected to be achieved primarily through normal attrition. Beginning with the third quarter the Sparbanken Öresund acquisition can no longer be followed separately in Swedbank’s financial reports. Third quarter 2014 Compared with second quarter 2014 Result The third quarterly result rose by 10 per cent to SEK 4 560m (4 139). Income and expenses decreased. Excluding one-off income of SEK 461m associated with the acquisition of Sparbanken Öresund during the second quarter, income increased. Credit impairments rose during the third quarter due to larger provisions for a few commitments. Profit for continuing operations amounted to SEK 4 562m (4 369). Discontinued operations generated a loss of SEK -2m (-230). During the second quarter a negative exchange rate difference of SEK 223m was reclassified to the income statement from other comprehensive income related to the winding down of the Russian operations. Profit before impairments increased by 8 per cent to SEK 5 986m (5 536). Group Functions & Other, primarily Group Treasury, contributed to the increase. Other business areas reported slightly lower profit. Profit before impairments by business segment excl FX effects Q3 Q2 Q3 SEKm 2014 2014 2013 Swedish Banking 2 986 3 037 3 114 Large Corporates & Institutions 992 1 153 1 016 Baltic Banking 898 986 888 Group Functions & Other 1 110 385 278 Total excl FX effects 5 986 5 561 5 296 FX effects 0 -25 -66 Total 5 986 5 536 5 230 Credit impairments amounted to SEK 235m (30). LC&I provided the increase, while Baltic Banking’s net recoveries rose slightly. Credit impairments related to increased provisions for a few problem loans. Credit impairments within Swedish Banking remained low. Tangible asset writedowns continued to decrease to SEK 19m (69) and primarily relate to writedowns in Ektornet. Property repossessions by Ektornet decreased to SEK 916m (1 382).
- 6. Swedbank – Interim report January-September 2014 Page 6 of 61 The return on equity for continuing operations was 16.6 per cent (16.6). The cost/income ratio was 0.41 (0.47). The cost/income ratio during the second quarter was negatively affected by the acquisition of Sparbanken Öresund. Income decreased by 3 per cent to SEK 10 150m (10 455). The second quarter contained two major sources of one-off income: SEK 461m in connection with the acquisition of Sparbanken Öresund and SEK 230m related to the associated company Entercard. Net interest income increased, while net commission income and net gains and losses on financial items at fair value were stable. Net interest income increased by 6 per cent to SEK 5 829m (5 521). Net interest income was stable in every business segment except Group Treasury within Group Functions & Other, where it increased. Group Treasury’s net interest income benefited from falling interest rates, whereas it negatively affected net interest income within Swedish Banking and Baltic Banking. Higher lending volumes within Swedish Banking and LC&I contributed positively. The new capital adequacy requirements in the form of higher risk weights on mortgages increased the margins to cover the bank’s higher expenses for the Swedish mortgage portfolio. Sparbanken Öresund, which was not consolidated until 21 May, contributed positively in a comparison between quarters, as did the additional interest day in the third quarter. Net commission income was stable at SEK 2 816m (2 813). LC&I contributed positively, while the net was slightly lower in Swedish Banking and Baltic Banking. Card commissions were seasonally higher and commissions from corporate finance were lower. Net gains and losses on financial items at fair value were stable at SEK 799m (773). Group Treasury benefited from the positive effects of falling interest rates. Net gains and losses on financial items at fair value within LC&I decreased due to seasonally lower activity and low volatility in the financial markets. Other income decreased by 48 per cent to SEK 706m (1 348). A bargain purchase gain of SEK 461m associated with the Sparbanken Öresund acquisition was recognised during the second quarter, as was one-off income of SEK 230m related to Entercard. Expenses decreased by 15 per cent to SEK 4 164m (4 919). Expenses also decreased excluding one-off expenses of SEK 615m attributable to the acquisition of Sparbanken Öresund during the second quarter. Expenses decreased mainly within Group Functions & Other but also within Baltic Banking and Swedish Banking. Expenses within LC&I rose slightly. Staff costs decreased due to, among other things, fewer employees in Group Functions & Other. Expenses for IT, premises and marketing decreased on a seasonal basis. SEK 57m was expensed during the second quarter for the move of the head office to Sundbyberg. The number of full-time employees decreased by 78 during the quarter, mainly within Group Functions & Other. The tax expense amounted to SEK 1 164m (1 063), corresponding to an effective tax rate of 20.3 per cent (19.6). The second quarter was positively affected by the acquisition of Sparbanken Öresund. The bargain purchase gain is not taxable. January-September 2014 Compared with January-September 2013 Result The result for the period rose by 36 per cent to SEK 12 652m (9 289). Income, expenses and credit impairments increased, while other impairments fell. Fluctuations in exchange rates, primarily the depreciation of the Swedish krona against the euro and the Lithuanian litas, raised profit by SEK 139m. The result for continuing operations was SEK 12 911m (11 591) and for discontinued operations was SEK -259m (-2 292). During the first nine months of 2013 SEK -1 875m was reclassified to the income statement from other comprehensive income related to the sale of the Ukrainian operations, compared with a corresponding reclassification of SEK -223m during the first nine months of this year for the winding down of the Russian operations. Profit before impairments increased by 10 per cent to SEK 16 616m (15 112). Profit increased mainly in Group Treasury within Group Functions & Other, but Baltic Banking and LC&I also improved their results. Profit within Swedish Banking was stable. Credit impairments of SEK 165m (92) were posted during the nine-month period. LC&I reported higher credit impairments, while Swedish Banking’s credit impairments were lower. Baltic Banking recognised recoveries, but at a lower level than in 2013. Tangible asset writedowns amounted to SEK 223m (382), a decrease attributable to Ektornet. Intangible asset writedowns decreased to SEK 1m (170). Profit before impairments by business segment excl FX effects Jan-Sep Jan-Sep Δ SEKm 2014 2013 SEKm Swedish Banking 9 002 9 017 -15 Large Corporates & Institutions 3 398 3 185 213 Baltic Banking 2 731 2 452 279 Group Functions & Other 1 485 631 854 Total excl FX effects 16 616 15 285 1 331 FX effects 0 -163 163 Total 16 616 15 122 1 494 The return on equity for continuing operations improved to 15.9 per cent (15.2). The cost/income ratio was 0.44 (0.45). Income rose by 10 per cent to SEK 29 925m (27 286). All business segments contributed to the higher income. The acquisition of Sparbanken Öresund increased income, where SEK 461m was one-off income during the second quarter. Stronger commission income and net gains and losses on financial items contributed the most. Net interest income also increased, while other income excluding one-off effects decreased. Changes in exchange rates increased income by SEK 239m. Net interest income rose by 3 per cent to SEK 16 833m (16 403). In Baltic Banking, repricing, increased deposit
- 7. Swedbank – Interim report January-September 2014 Page 7 of 61 volumes and higher average market interest rates contributed positively. Group Treasury’s net interest income improved slightly. Within LC&I higher lending volumes and origination fees contributed positively. Swedish Banking’s net interest income was stable, but decreased slightly excluding the acquisition of Sparbanken Öresund. Margin pressure on deposits was offset by the positive effects of higher lending volumes and higher mortgage margins. Fluctuations in exchange rates increased net interest income by SEK 120m. Net commission income rose by 12 per cent to SEK 8 322m (7 433). Higher commission income from asset management due to a favourable stock market climate contributed the most to the increase. Loan-related income and income from corporate finance within LC&I increased as well. Card commissions also improved. Net gains and losses on financial items at fair value increased by 87 per cent to SEK 1 917m (1 023). Group Treasury in Group Functions & Other rebounded from a negative to a positive net result. The main reason was the positive effects of falling interest rates. In 2014 net gains and losses in Group Treasury contained positive one-off effects of SEK 158m, while in 2013 the offer to repurchase state-guaranteed bonds affected net gains and losses negatively. Net gains and losses on financial items at fair value within LC&I were stable. Other income increased by 18 per cent to SEK 2 853m (2 427). The acquisition of Sparbanken Öresund in the second quarter 2014 resulted in a bargain purchase gain of SEK 461m. One-off income of SEK 230m was recognised in the share of the profit or loss of the associated company Entercard. Sales activity within Ektornet was lower during the nine-month period than in the previous year since the portfolio is now significantly smaller. This negatively affected other income. Expenses increased by 9 per cent to SEK 13 309m (12 164), mainly as a result of the Sparbanken Öresund acquisition, where one-off expenses of SEK 615m attributable to the acquisition were recognised during the second quarter 2014. Expenses increased within LC&I and Swedish Banking. Baltic Banking’s expenses decreased slightly in local currency. The Group’s staff costs rose as a result of a higher number of customer advisors and IT-related staff as well as salary adjustments. IT development expenses rose as well. Reduced cash handling and the outsourcing of ATMs reduced expenses for transport and security. In 2014 SEK 136m was expensed for the move of the head office. Changes in exchange rates raised expenses by SEK 75m. The number of full-time employees increased year-on- year by 340, mainly as a result of the acquisition of Sparbanken Öresund. Baltic Banking reduced its full- time employees by 194. Ektornet (Group Functions & Other) also reduced its staff. IT-related staff within Group Functions & Other and the number of full-time employees within Swedish Banking and LC&I increased. The tax expense amounted to SEK 3 301m (2 887), corresponding to an effective tax rate of 20.3 per cent (19.9). Since the first quarter 2014 the tax expense has been higher due to the new policy on profit distributions from the Baltic operations. About 60 per cent of profits generated by the Baltic subsidiaries from 2014 onwards will be distributed to the parent company, Swedbank AB. Profit in Estonia is not taxed until its distribution. This means that deferred tax is already recognised on the estimated distribution from Estonia, even though it will not be paid out until the first quarter 2015. At the same time the tax expense was positively affected by the acquisition of Sparbanken Öresund. Profit posted from the bargain purchase is not taxable. Credit and asset quality Political and economic tensions have continued around the world, with sanctions against Russia and slower growth in Europe. The bank’s credit portfolio is distinguished by customers with low risk, however, making it resilient in the event of an economic downturn. Credit impairments remained low during the nine-month period, but increased slightly during the quarter due to individual provisions for anticipated credit impairments. While the political tensions in Russia and Ukraine have not affected its credit quality, the bank continues to discuss preventive measures with customers who have business connections in the region and could be affected if the conflict continues. The bank’s direct credit exposure to Russia continues to decrease and as of 30 September amounted to SEK 0.8bn. The bank has no direct credit exposures to Ukraine. Swedbank’s lending increased by SEK 73bn or 6 per cent during the nine-month period to SEK 1 287bn, of which SEK 6bn is due to currency effects. Of the increase, SEK 21bn related to the third quarter. Mortgage lending in Sweden rose by SEK 26bn during the year. Corporate lending within Swedish Banking and LC&I increased by a total of SEK 39bn. The highest activity was in property management, shipping and offshore. The acquisition of Sparbanken Öresund in the second quarter increased lending by SEK 16.5bn, of which SEK 5.0bn was private lending and SEK 11.5bn was corporate lending. Baltic Banking’s lending portfolio grew slightly in Estonia and Lithuania, measured in local currency, but decreased slightly in Latvia. The Swedish Bankers’ Association’s current recommendation on the amortisation of new mortgages has been extended as of 1 July to include mortgages with a loan-to-value ratio over 70 per cent. During the last 12 months 72 per cent of new mortgages granted in Sweden with a loan-to-value ratio over 70 per cent are being amortised. Annual contractual amortisations in the Swedish mortgage portfolio amount to about SEK 8.6bn. The average loan-to-value ratio for Swedbank’s mortgages in Sweden was 60.4 per cent (62.2 as of 31 December), based on property level as of 30 September. For more information on Swedbank’s mortgage portfolios, see page 56 of the fact book. The share of Swedish mortgages past due by more than 60 days remained low at 0.08 per cent of the portfolio (0.09). The share of impaired mortgages in Baltic Banking fell, even though Latvia and Lithuania are still affected by problem loans from the crisis years, however. The share of mortgages past due by more than 60 days was 0.6 per cent in Estonia (0.7), 6.3 per cent in Latvia (7.4) and 3.5 per cent in Lithuania (4.4). Impaired loans have decreased during the year by SEK 0.8bn to SEK 6.7bn and correspond to 0.47 per cent (0.55) of total lending. Baltic Banking’s impaired loans decreased by SEK 0.8bn to SEK 4.2bn, mainly due to the winding down of problem loans from 2008- 2009 and improved quality in the loan portfolio. The acquisition of Sparbanken Öresund in the second quarter increased impaired loans within Swedish
- 8. Swedbank – Interim report January-September 2014 Page 8 of 61 Banking by SEK 0.3bn. The provision ratio for impaired loans was 38 per cent. The total provision ratio i.e. including portfolio provisions, was 55 per cent (54). Impaired loans, by business segment Q3 Q2 Q3 SEKm 2014 2014 2013 Swedish Banking 1 523 1 522 1 774 Large Corporates & Institutions 955 279 1 116 Baltic Banking 4 248 4 511 6 322 Estonia 1 346 1 297 1 652 Latvia 1 590 1 837 3 019 Lithuania 1 312 1 377 1 651 Total 6 726 6 312 9 212 Credit impairments amounted to SEK 165m (92) during the first nine months of the year and arose during the third quarter. Credit impairments relate to new provisions for anticipated credit impairments within LC&I and Swedish Banking. The provisions relate to a few commitments. The credit impairment ratio remains low from a historical perspective. Baltic Banking reported continued recoveries, though at a lower level. Credit impairments, net by business segment Q3 Q2 Q3 SEKm 2014 2014 2013 Swedish Banking 43 25 107 Large Corporates & Institutions 270 21 7 Baltic Banking -59 -16 -147 Estonia -3 -25 -38 Latvia -42 13 -70 Lithuania -14 -4 -39 Group Functions & Other -19 0 -23 Total 235 30 -56 Repossessed assets amounted to SEK 1 110m on 30 September, nearly half the amount at the beginning of the year. Ektornet accounted for SEK 916m of the repossessed assets. Ektornet’s property values were written down by SEK 220m (375) during the nine-month period, mainly related to Ukraine and the US, of which SEK 16m was in the third quarter. The sale of the last US asset in Ektornet’s property portfolio was finalised in the third quarter. The remaining repossessed properties in Ukraine amounted to SEK 106m on 30 September. On the same date the number of properties, including apartments and suchlike, was 893 (1 366), of which 425 were in Latvia (783). For more information on repossessed assets, see page 35 of the fact book. Funding and liquidity During the first nine months of 2014 Swedbank issued a total of SEK 89bn in long-term debt instruments, of which SEK 68bn related to covered bonds and SEK 21bn to senior unsecured debt. During the third quarter a total of SEK 21bn in long-term debt instruments was issued, including SEK 20bn in covered bonds and SEK 1bn in senior unsecured debt. For the full-year 2014 Swedbank plans to issue a total of about SEK 120bn to meet maturing long-term funding with a nominal value of SEK 103bn measured from the beginning of the year. Liquidity over and above the refinancing need is used in day-to-day management to repurchase covered bonds. The average maturity of all capital market funding arranged through the bank’s short- and long-term programmes was 27 months on 30 September 2014 (29 as of 31 December 2013). The average maturity of long-term funding issued during the nine-month period was 60 months. Demand for Swedbank’s short-term debt instruments remained high and the outstanding volume of short-term funding increased by SEK 109bn during the nine-month period to SEK 209bn. The main liquidity measure used by the Board of Directors and executive management is the so-called survival horizon, which shows that the bank would survive more than 12 months with the capital markets completely shut down. This applies to total liquidity as well as liquidity in USD and EUR. Swedbank’s liquidity reserve, which is reported in accordance with the Swedish Bankers’ Association’s definition for liquidity reporting, amounted to SEK 263bn as of 30 September 2014 (281 as of 30 June). In addition to the liquidity reserve, liquid securities in other parts of the Group amounted to SEK 63bn (52 as of 30 June). The liquidity reserve and Liquidity Coverage Ratio (LCR) will fluctuate over time depending on, among other things, the maturity structure of the bank’s issued securities. The Group’s LCR was 132 per cent on 30 September (123 as of 30 June). Distributed by USD and EUR, LCR was 287 per cent (195 as of 30 June) and 227 per cent (293 as of 30 June). In early 2013 the Basel Committee published a new definition of LCR. According to Swedbank’s interpretation, LCR would have been 135 per cent as of 30 September (132 as of 31 March). According to Swedbank’s interpretation of the Basel Committee’s latest proposed revisions to the definition from January 2014, the Group’s Net Stable Funding Ratio (NSFR) was 102 per cent as of 30 September (102 as of 30 June). For more information on the above, see page 68 of the fact book. Ratings No ratings events during the quarter. Capital and capital adequacy The Common Equity Tier 1 ratio was 20.7 per cent on 30 September (20.9 per cent on 30 June and 18.3 per cent on 31 December 2013). Common Equity Tier 1 capital decreased by SEK 0.2bn during the third quarter to SEK 84.7bn. This was mainly due to the remeasurement of the estimated pension liability according to IAS 19, which reduced Common Equity Tier 1 capital by about SEK 0.9bn due to the declining discount rate. The bank’s profit after deducting the anticipated dividend positively affected Common Equity Tier 1 capital.
- 9. Swedbank – Interim report January-September 2014 Page 9 of 61 Change in Common Equity Tier 1 capital Basel 3, third quarter 2014, Swedbank consolidated situation 80.8 84.7 -0.9 -0.2 4.5 -3.6 84.9 50 55 60 65 70 75 80 85 90 95 100 SEKbn Increase Decrease The risk exposure amount (REA) increased by just under SEK 3bn during the third quarter to SEK 409.6bn on 30 September (406.7 as of 30 June). The REA for credit risks rose by SEK 2.9bn. Increased exposures, mainly to corporate customers in Swedish Banking and LC&I, raised the REA by SEK 12bn. Positive rating migrations reduced it by SEK 0.6bn, updated valuations of collateral by SEK 5.5bn and additional exposures with SME discounts by SEK 0.7bn (under other credit risk). A few new overdue corporate exposures reduced the REA by SEK 0.4bn. Fluctuations in exchange rates, mainly attributable to the Baltic credit portfolio, reduced the REA for credit risks by SEK 0.2bn due to the appreciation of the Swedish krona against the euro. Other reductions in the REA for credit risks include reductions related to Ektornet of SEK 0.6bn. The REA for credit valuation adjustment (CVA risk) increased as a result of increased exposures. The REA for market risks decreased, mainly due to a reduced holdings of bonds with long maturities. The REA for operational risks was unchanged during the quarter. Change in REA Basel 3, third quarter 2014, Swedbank consolidated situation 12.0 -0.6 -5.5 -0.2 -2.8 0.9 -1.0 440.6 406.7 409.6 360 370 380 390 400 410 420 430 440 450 SEKbn Increase Decrease The new Basel 3 capital adequacy rules were introduced within the EU on 1 January 2014, while the sections that required introduction in Swedish legislation did not take effect until August. In early September the Swedish Financial Supervisory Authority (SFSA) decided which capital requirements would apply to Swedish banks beyond the minimum level of 7 per cent Common Equity Tier 1 capital in accordance with the EU rules. The SFSA’s requirements were in line with those presented before the summer and can be summarised as follows: As of 1 January 2015 the four major Swedish banks are assigned a systemic risk buffer of 3 per cent in Common Equity Tier 1 capital within the framework of Pillar 1 and a further 2 per cent within the framework of Pillar 2. The risk weight floor for Swedish mortgages was raised from the date of SFSA’s decision in September from 15 to 25 per cent within the framework of Pillar 2. SFSA does not intend to make a formal decision on the capital requirement for individual institutions in Pillar 2. As long as a formal decision has not been made, the capital requirement under Pillar 2 does not affect the level at which automatic restrictions on dividend and coupon payments take effect. The countercyclical buffer will be 1 per cent from 13 September 2015. A clarification of SFSA’s view of standardised models and capital requirements for Pillar 2 is still needed before the Board of Directors can determine an internal capital target. Due to the increase in the risk weight floor for the Swedish mortgage portfolio from 15 to 25 per cent and the addition of a countercyclical buffer as of September 2015, Swedbank has to maintain additional Common Equity Tier 1 capital of SEK 20.4bn for Swedish mortgages within the framework of Pillar 2 corresponding to 5.0 percentage points of the Common Equity Tier 1 ratio according to Pillar 1. In its internal controls Swedbank allocates capital to its mortgage business equivalent to a 25 per cent risk weight floor as from the fourth quarter 2014.
- 10. Swedbank – Interim report January-September 2014 Page 10 of 61 Swedbank’s leverage ratio was 4.4 per cent on 30 September (4.3 on 30 June 2014 and 4.6 per cent on 31 December 2013). In early October the EU Commission clarified the definition, which is reflected in Swedbank’s reported figures as of 30 September. According to the EU’s rules, the measure will be evaluated by the authorities prior to the possible introduction of a minimum requirement in 2018. Operational risks No major incidents occurred during the third quarter 2014. The bank’s direct losses attributable to operational risks remained low. For more information on market risks, see Note 23 and see page 89 of the fact book. Other events Swedbank’s Annual General Meeting will be held in Stockholm on Thursday, 26 March 2015. The Nomination Committee comprises the following members: Lennart Anderberg, appointed by owner- group Föreningen Sparbanksintressenter, Chair of the Nomination Committee; Ramsay Brufer, appointed by Alecta; Jens Henriksson, appointed by owner-group Folksam; Johan Sidenmark, appointed by AMF Försäkring och Fonder; and Anders Sundström, Chair of the Board of Directors of Swedbank AB. Shareholders who wish to submit a proposal to the Nomination Committee must do so no later than 19 December 2014 either by e-mail to valberedningen@swedbank.se or by mail to: Valberedningen c/o Swedbank AB Valberedningens sekreterare, Group Legal SE-105 34 Stockholm, Sweden Events after 30 September 2014 In October the Swedish Bankers’ Association extended its recommendation on mortgage amortisation to include all new loans with a loan-to-value ratio over 50 per cent. Relevant authorities have been consulted on the proper rate of amortisation. The bank intends to follow the recommendation.
- 11. Swedbank – Interim report January-September 2014 Page 11 of 61 . Swedish Banking Further increase in loan volumes Higher mortgage margins as a result of increased capital requirements Lower deposit margins due to declining interest rates Income statement Q3 Q2 Q3 Jan-Sep Jan-Sep SEKm 2014 2014 % 2013 % 2014 2013 % Net interest income 3 372 3 362 0 3 473 -3 10 048 10 172 -1 Net commission income 1 746 1 790 -2 1 577 11 5 185 4 715 10 Net gains and losses on financial items at fair value 47 54 -13 28 68 151 95 59 Share of profit or loss of associates 220 410 -46 239 -8 886 640 38 Other income 182 613 -70 174 5 948 563 68 Total income 5 567 6 229 -11 5 491 1 17 218 16 185 6 Staff costs 971 1 360 -29 877 11 3 250 2 609 25 Variable staff costs 55 52 6 48 15 158 163 -3 Other expenses 1 506 1 746 -14 1 423 6 4 694 4 307 9 Depreciation/amortisation 49 34 44 29 69 114 89 28 Total expenses 2 581 3 192 -19 2 377 9 8 216 7 168 15 Profit before impairments 2 986 3 037 -2 3 114 -4 9 002 9 017 0 Credit impairments 43 25 72 107 -60 99 198 -50 Operating profit 2 943 3 012 -2 3 007 -2 8 903 8 819 1 Tax expense 645 563 15 647 0 1 848 1 901 -3 Profit for the period 2 298 2 449 -6 2 360 -3 7 055 6 918 2 Profit for the period attributable to the shareholders of Swedbank AB 2 292 2 445 -6 2 354 -3 7 041 6 909 2 Non-controlling interests 6 4 50 6 0 14 9 56 Return on allocated equity, % 25.9 29.7 28.6 28.0 28.1 Loan/deposit ratio, % 250 246 244 250 244 Credit impairment ratio, % 0.02 0.01 0.05 0.01 0.03 Cost/income ratio 0.46 0.51 0.43 0.48 0.44 Loans, SEKbn 1 005 987 2 925 9 1 005 925 9 Deposits, SEKbn 402 401 0 378 6 402 378 6 Full-time employees 5 448 5 446 0 4 961 10 5 448 4 961 10 Development January - September The result for the nine month period amounted to SEK 7 041m, an increase of 2 per cent. Income and expenses both increased, mainly as a result of the acquisition of Sparbanken Öresund. Income was also positively affected by one-off effects related to the associated company Entercard during the second quarter. Credit impairments were lower. Net interest income fell slightly compared with the first nine months of 2013 as a result of lower deposit margins, which were adversely affected by declining market interest rates, but largely offset by higher lending volumes. The increased capital adequacy requirements in the form of higher risk weights on mortgages increased the margins to cover the bank’s increased expenses for the Swedish mortgage portfolio. Compared with the second quarter net interest income was stable. Increased lending margins and improved mortgage margins during the quarter offset lower deposit margins owing to falling market interest rates. The acquisition of Sparbanken Öresund contributed positively in comparison with the second quarter, since the consolidation did not occur until 21 May. Household deposit volumes increased by SEK 11bn since the beginning of the year, with volumes from the acquisition of Sparbanken Öresund in the second quarter accounting for SEK 8bn. Swedbank’s share of household deposits was 21 per cent at the end of the period (21 as of 31 December 2013). Corporate deposits within Swedish Banking increased by SEK 6bn since the beginning of the year, or by 5 per cent. Sparbanken Öresund accounted for SEK 4bn. Swedbank’s market share, including corporate deposits within LC&I, was 20 per cent as of 31 August (18 per cent as of 31 December 2013). Household mortgage lending volume increased by SEK 26bn since the beginning of the year, of which SEK 9bn during the third quarter. Swedbank’s share of new sales continued to improve during the quarter, and its share of net growth was 24 per cent during the period January-August 2014. Swedbank’s share of the total market was 25 per cent (25 as of 31 December 2013). The Swedish Bankers’ Association’s current recommendation requiring new mortgage borrowers to amortise has been extended to include mortgages with a loan-to-value ratio over 70 per cent. During the last 12 months 72 per cent of newly granted mortgages in Sweden with a loan-to-value ratio over 70 per cent were being amortised. Corporate lending volume increased by SEK 33bn since the beginning of the year, with the acquisition of Sparbanken Öresund accounting for SEK 11bn. Swedbank’s market share, including corporate
- 12. Swedbank – Interim report January-September 2014 Page 12 of 61 lending within LC&I, was 18 per cent (17 per cent as of 31 December 2013). Net commission income rose by 10 per cent compared with the same period in 2013. The increase was mainly due to higher fund management commissions resulting from increased volumes in the wake of stock market gains and increased net inflows. Swedbank’s market share in terms of assets under management was 23 per cent (24 as of 31 December 2013). Increased lending and guarantee commissions as well as revenue from real estate brokerage and equity trading also contributed to the increase. Card usage continues to rise. As of 31 August the total number of retail purchases by card increased by 9 per cent, and the aggregate value by 7 per cent year-on-year. During the third quarter net commission income decreased by 2 per cent, mainly due to lower activity during the summer months, which led to lower income from lending and guarantee commissions as well as securities trading. This has been partly offset by seasonally higher card commissions. The share of associates’ profit decreased compared with the second quarter, when one-off income of SEK 230m was recognised by the credit card company Entercard. Other income was positively affected during the first nine months by the acquisition of Sparbanken Öresund. During the second quarter 2014 a bargain purchase gain of SEK 461m was recognised. Expenses for the nine-month period increased, mainly due to the acquisition of Sparbanken Öresund, in connection with which a one-off expense of SEK 615m was recognised, mainly relating to a restructuring reserve covering, among other things, system solutions and the divestment of branches. Staff costs were higher due to the hiring of more advisors and higher salary costs. Cash handling expenses fell. Expenses for the third quarter decreased slightly, mainly due to seasonal variations, including lower marketing and IT development costs. Surplus values that arose through the acquisition of Sparbanken Öresund led to higher depreciations. The cost-income ratio decreased during the nine-month period to 0.48 (0.44) due to the Sparbanken Öresund acquisition. Credit quality remained good. Credit impairments decreased year-on-year. They increased slightly during the third quarter, but the level remains low. The share of impaired loans was 0.15 per cent (0.16). The REA was SEK 181.2bn, an increase of SEK 2.5bn during the quarter. The biggest increase was in the REA for credit risks, mainly as a result of increased corporate lending. A number of services with new or improved functions were launched in the bank's digital channels at the end of the second quarter. A business version of Swish that allows small companies, organisations and associations to manage payment flows between consumers and companies has attracted 3 600 companies since its launch in early June. Babs Micro - a new mobile card acceptance terminal – for small businesses was launched. Since its launch in May, over 600 companies have signed up for the service. Further improvements have been made to the Mobile Bank to offer the same functionality as the Internet Bank. Use of Swedbank’s digital channels continues to grow. The Internet Bank had 3.7 million users as of 30 September, an increase of 94 000 during the year. The Mobile Bank had 1.9 million (+309 000) and the iPad Bank had 489 000 (+109 000). Digitisation strongly contributed to a year-on-year decrease of 15 per cent in the number of teller transactions in branches. As of 30 September there were 1.7 million Swish users across Swedish banks, an increase of 900 000 in 2014. Swedbank and the savings banks’ share was 42 per cent. Sweden is Swedbank’s largest market, with around 4 million private customers and more than 250 000 corporate customers. This makes it Sweden’s largest bank by number of customers. Through our digital channels (Telephone Bank, Internet Bank and Mobile Bank) and branches, and with the support of savings banks and franchisees, we are always available. Swedbank is part of the local community. Our branch managers have a strong mandate to act in their local communities. The bank’s presence and engagement are expressed in various ways. A project called “Young Jobs”, which has created several thousand trainee positions for young people, has played an important part in recent years. Swedbank has 318 branches in Sweden. The various product areas are described on page 20.
- 13. Swedbank – Interim report January-September 2014 Page 13 of 61 Large Corporates & Institutions The strategy to deepen customer relationships generated increased business Lending increased through the addition of new large corporate customers Seasonally lower activity Income statement Q3 Q2 Q3 Jan-Sep Jan-Sep SEKm 2014 2014 % 2013 % 2014 2013 % Net interest income 876 846 4 864 1 2 589 2 498 4 Net commission income 561 496 13 468 20 1 687 1 410 20 Net gains and losses on financial items at fair value 354 575 -38 387 -9 1 494 1 469 2 Share of profit or loss of associates 0 0 0 0 0 Other income 36 28 29 39 -8 101 119 -15 Total income 1 827 1 945 -6 1 758 4 5 871 5 496 7 Staff costs 338 323 5 271 25 983 852 15 Variable staff costs 71 75 -5 99 -28 221 291 -24 Other expenses 411 392 5 377 9 1 218 1 148 6 Depreciation/amortisation 15 14 7 16 -6 51 41 24 Total expenses 835 804 4 763 9 2 473 2 332 6 Profit before impairments 992 1 141 -13 995 0 3 398 3 164 7 Impairment of intangible assets 0 0 0 0 56 Credit impairments 270 21 7 261 175 49 Operating profit 722 1 120 -36 988 -27 3 137 2 933 7 Tax expense 150 225 -33 209 -28 667 682 -2 Profit for the period 572 895 -36 779 -27 2 470 2 251 10 Profit for the period attributable to the shareholders of Swedbank AB 572 895 -36 779 -27 2 470 2 251 10 Return on allocated equity, % 13.8 23.1 18.3 21.2 16.6 Loan/deposit ratio, % 154 161 208 154 208 Credit impairment ratio, % 0.46 0.04 0.01 0.16 0.10 Cost/income ratio 0.46 0.41 0.43 0.42 0.42 Loans, SEKbn 161 157 3 148 9 161 148 9 Deposits, SEKbn 104 98 6 71 46 104 71 46 Full-time employees 1 142 1 120 2 1 068 7 1 142 1 068 7 Development January - September The result for the period amounted to SEK 2 470m, an increase of 10 per cent year-on-year. The result was positively affected by increased lending-related income as well as income from IPOs and bond issues. The long-term strategy to strengthen expertise in specific industrial sectors and deepen customer relationships in these areas has produced results in the form of increased business and new customers during the year. Net interest income increased by 4 per cent compared with the first nine months of 2013. Higher average lending volumes and origination fees also contributed to the improvement. Margins in the lending portfolio were stable. Lending volume was 9 per cent higher year-on-year, an increase of SEK 13bn. During the third quarter net interest income increased by 4 per cent, mainly due to higher lending and one additional interest day compared with the second quarter. The lending increase during the third quarter was a result of a higher take-up rate on existing commitments as well as new business mainly in the shipping and industrial sectors. Changes in exchange rates also contributed to the volume increase. The refinancing of maturing loans continued during the third quarter, and activity in the lending market was high. Swedbank participated in a number of major loan syndicates in the service and manufacturing sectors. The lending margin on the loan portfolio was stable during the quarter, while pressure on new loan margins continued. Deposit volumes have risen continuously in the last 12 months. In the third quarter deposits rose by SEK 6bn. Transaction flows from large corporates and financial institutions have increased since 2013 as a result of the strategy to deepen the bank’s customer relationships. Net commission income rose by 20 per cent year-on-year to SEK 1 687m. The current low interest rate environment and high stock prices have led to higher activity among the bank’s corporate customers, which has increased income from corporate finance and lending. Swedbank participated in five of ten IPOs in Sweden during the period January-September, making it one of the two market leaders. During the third quarter net commission income rose by 13 per cent. Higher credit limits led to increased lending commissions, and higher activity increased card payment commissions. Activity and earnings from IPOs and bond issues were seasonally lower. During the third quarter Swedbank was a leading advisor in the real estate company Akelius’s offering of preference shares. The bank’s market share for Swedish issues was 18 per cent (19) in 2014. The corresponding figure in Norway was 15.5 per cent (15). This made Swedbank the third largest player in both Sweden and Norway.
- 14. Swedbank – Interim report January-September 2014 Page 14 of 61 Net gains and losses on financial items at fair value increased by 2 per cent year-on-year. During the third quarter customer activity in the markets was seasonally lower and net gains and losses on financial items decreased by 38 per cent. FX trading trended higher during the third quarter, while fixed income and equity trading was adversely affected by continued low volatility in the market. Income from bond trading decreased due to a slower pace of corporate bond issues. In addition, earnings from bond trading were negatively affected by the low interest rate environment. Total expenses increased by 6 per cent compared with the same period in 2013. Staff costs rose as a result of salary revisions and because of a conscious effort to expand advisory services for bond issues and corporate finance. New product development, investments in the cash management area and IT investments in the wake of increased regulatory requirements raised expenses for IT and IT-related staff. Expenses increased by 4 per cent compared with the previous quarter, mainly related to staff, IT operations and consultants. Credit impairments amounted to SEK 270m during the third quarter. The loss was attributable to increased provisions for a single, previously known problem loan in the retail sector. The share of impaired loans was 0.36 per cent (0.38). Credit quality in the loan portfolio has remained good. The REA increased by SEK 2bn during the quarter to SEK 119bn. The REA for credit risks rose by SEK 2.3bn, mainly due to increased corporate lending. The REA for market risks decreased by SEK 0.8bn, and the credit valuation adjustment (CVA risk) increased the amount by SEK 0.5bn. Large Corporates & Institutions is responsible for Swedbank’s offering to customers with revenues above SEK 2 billion and those whose needs are considered complex due to multinational operations or a need for sophisticated financing solutions. The business segment is also responsible for developing corporate and capital market products for other parts of the bank and the Swedish savings banks. LC&I works closely with customers, who receive advice on decisions that create sustainable profits and growth. The business segment has around 1 100 employees at branches in Sweden, Norway, Estonia, Latvia, Lithuania, Finland, Luxembourg, China and the US.
- 15. Swedbank – Interim report January-September 2014 Page 15 of 61 Baltic Banking Lower interest rates adversely affected net interest income for the quarter Good business activity is easing income pressure from euro introduction No financial impact from conflict between Russia and Ukraine Income statement Q3 Q2 Q3 Jan-Sep Jan-Sep SEKm 2014 2014 % 2013 % 2014 2013 % Net interest income 865 894 -3 807 7 2 633 2 312 14 Net commission income 500 522 -4 446 12 1 451 1 279 13 Net gains and losses on financial items at fair value 60 62 -3 98 -39 175 232 -25 Other income 88 118 -25 102 -14 315 290 9 Total income 1 513 1 596 -5 1 453 4 4 574 4 113 11 Staff costs 186 193 -4 184 1 566 578 -2 Variable staff costs 19 19 0 19 0 58 46 26 Other expenses 374 374 0 373 0 1 112 1 069 4 Depreciation/amortisation 36 35 3 33 9 107 99 8 Total expenses 615 621 -1 609 1 1 843 1 792 3 Profit before impairments 898 975 -8 844 6 2 731 2 321 18 Impairment of intangible assets 0 1 0 1 0 Impairment of tangible assets 3 3 0 1 1 7 -86 Credit impairments -59 -16 -147 -60 -176 -260 -32 Operating profit 954 987 -3 990 -4 2 905 2 574 13 Tax expense 142 158 -10 84 69 437 211 Profit for the period 812 829 -2 906 -10 2 468 2 363 4 Profit for the period attributable to the shareholders of Swedbank AB 812 829 -2 906 -10 2 468 2 363 4 Return on allocated equity, % 15.7 15.6 16.5 15.5 14.1 Loan/deposit ratio, % 97 99 106 97 106 Credit impairment ratio, % -0.19 -0.06 -0.50 -0.20 -0.30 Cost/income ratio 0.41 0.39 0.42 0.40 0.44 Loans, SEKbn 121 122 -1 117 3 121 117 3 Deposits, SEKbn 125 122 2 110 14 125 110 14 Full-time employees 3 846 3 822 1 4 040 -5 3 846 4 040 -5 Development January - September Profit for the nine-month period amounted to SEK 2 468m (2 363), an increase of 4 per cent. Income rose year-on-year, mainly due to increased business activity and repricing, while expenses in local currency decreased. Recoveries were lower. Tax expenses increased. Changes in exchange rates improved profit for the period by SEK 116m. Net interest income increased by 8 per cent in local currency compared with the nine-month period in 2013 and was positively affected by repricing, increased deposit volumes and higher average Euribor rates. Changes in exchange rates increased net interest income by SEK 125m. Net interest income in local currency dropped 4 per cent in the third quarter, mainly due to significantly lower market interest rates. Lending volumes were stable in local currency compared with 31 December 2013. Consumer lending increased and corporate lending was stable, while leasing and private mortgages decreased. The lending portfolio increased in Lithuania, was stable in Estonia and decreased in Latvia. During the third quarter the loan portfolio grew slightly despite geopolitical concerns. Swedbank’s market share for lending was 29 per cent as of 30 June (28 as of 31 December 2013). Deposit volumes increased by 2 per cent in local currency during the nine-month period. Volumes increased in Estonia and Lithuania, while in Latvia they have been stable since the transition to the euro at the beginning of the year. Swedbank’s market share in deposits was 29 per cent as of 30 June (28 per cent as of 31 December 2013). The loan-to-deposit ratio was 97 per cent (100 per cent as of 31 December 2013). Net commission income rose by 8 per cent in local currency compared with the nine-month period 2013. The improvement was mainly due to increased customer activity, as reflected by increased card related income and higher asset management volumes following the stock market’s positive performance. The number of active customers has increased by 63 000 since 30 September 2013 to 2.6 million. Net commission income was negatively affected during the nine-month period by about SEK 59m by the euro transition in Latvia, which resulted in fewer international payments. During the second quarter one-off income of SEK 35m was posted for the reversal of a previous provision for a fine levied on the Lithuanian operations. Net gains and losses on financial items at fair value decreased by 28 per cent in local currency compared with the same period in 2013. The decrease was mainly due to lower income of SEK 56m from the Latvian FX trading business – a result of the euro transition. During the first nine months other income rose by 4 per cent in local currency compared with the same period in 2013. Due to a VAT refund of SEK 16m on transfer
- 16. Swedbank – Interim report January-September 2014 Page 16 of 61 pricing of invoices in Latvia during the second quarter. Insurance-related income decreased. Total expenses decreased by 2 per cent in local currency year-on-year. Expenses for staff and premises decreased, while IT and regulatory expenses increased. The number of full time employees was 5 per cent lower than on 30 September 2013 and the number of branches has been reduced by 13 to 170 in the last 12 months, of which 40 are now cash-smart branches (6 on 30 September 2013) with a focus on advisory services. On 23 July Lithuania formally received approval for euro adoption on 1 January 2015. Expenses related to euro conversion in Lithuania and Latvia are estimated at SEK 84m in 2014, of which SEK 46m has been recognised thus far this year. The cost-income ratio improved during the nine-month period to 0.40 (0.44). Net recoveries amounted to SEK 176m, compared with SEK 260m in the first nine months of 2013. All three countries reported recoveries. Swedbank is taking preventive measures to help its customers that could be affected by the current geopolitical situation. No major spillover effects have been observed on business activity or customers’ finances. Impaired loans continued to decrease in all three countries during the nine-month period to SEK 4.2bn (5.0 as of 31 December 2013). Credit quality has improved to such a level that impaired loans are now decreasing at a more moderate pace than in the last two years. The REA decreased by SEK 1bn during the quarter to SEK 82.3bn. The REA for credit risks accounted for the decrease. Positive rating migrations, mainly of large corporates, and updated market valuations reduced the REA for private mortgages, mainly in Latvia. A few new overdue corporate loans in Estonia also contributed to the decrease. Higher lending led to an increase in the REA, where the largest change related to corporate lending in Lithuania. In 2014 Swedbank adopted a new policy on profit distributions from the Baltic operations, whereby around 60 per cent of earnings generated in the Baltic subsidiaries as of 2014 will be distributed to the parent company, Swedbank AB. Profit in Estonia is not taxed until distribution, which means that deferred tax is now recognised on the estimated distribution from Estonia, even though it will not be paid until the first quarter 2015. For the first nine months of 2014 deferred tax of SEK 158m has been recognised for future distributions. During the third quarter Swedbank came fourth in an annual Baltic survey of “Most Loved Brands”, which includes global companies. The three companies ahead of Swedbank were Google, Facebook and Gmail. In the category of favourite brand in the Baltic financial sector, Swedbank was the highest-ranked company. Swedbank is the largest bank by number of customers in Estonia, Latvia and Lithuania, with around 4 million private customers and more than 250 000 corporate customers. According to surveys, Swedbank is also the most respected company in the financial sector. Through its digital channels (Telephone Bank, Internet Bank and Mobile Bank) and branches, the bank is always available. Swedbank is part of the local community. Its local social engagement is expressed in many ways, with initiatives to promote education, entrepreneurship and social welfare. Swedbank has 50 branches in Estonia, 51 in Latvia and 69 in Lithuania. The various product areas are described on page 20.
- 17. Swedbank – Interim report January-September 2014 Page 17 of 61 Group Functions & Other Income statement Q3 Q2 Q3 Jan-Sep Jan-Sep SEKm 2014 2014 % 2013 % 2014 2013 % Net interest income 716 419 71 498 44 1 559 1 419 10 Net commission income -10 -14 -29 3 -55 -34 62 Net gains and losses on financial items at fair value 338 82 -343 97 -773 Share of profit or loss of associates 1 0 1 0 1 3 -67 Other income 248 249 0 434 -43 819 1 055 -22 Total income 1 293 736 76 593 2 421 1 670 45 Staff costs 772 819 -6 783 -1 2 401 2 368 1 Variable staff costs 57 60 -5 47 21 170 170 0 Other expenses -733 -615 19 -615 19 -1 901 -1 777 -7 Depreciation/amortisation 87 89 -2 101 -14 266 289 -8 Total expenses 183 353 -48 316 -42 936 1 050 -11 Profit before impairments 1 110 383 277 1 485 620 Impairment of intangible assets 0 0 0 0 114 Impairment of tangible assets 16 66 -76 94 -83 222 375 -41 Credit impairments -19 0 -23 -17 -19 -21 -10 Operating profit 1 113 317 206 1 282 152 Tax expense 227 117 94 58 349 93 Profit for the period from continuing operations 886 200 148 933 59 Profit for the period from discontinued operations, after tax -2 -230 -99 -15 -87 -259 -2 292 -89 Profit for the period 884 -30 133 674 -2 233 Profit for the period attributable to the shareholders of Swedbank AB 884 -30 133 673 -2 234 Non-controlling interests 0 0 0 1 1 0 Full-time employees 4 168 4 294 -3 4 195 -1 4 168 4 195 -1 Development January - September Income for Group Functions & Other consists of net interest income and net gains and losses on financial items, which mainly come from Group Treasury. Other income primarily consists of revenue from the savings banks as well as sales revenue and operating income from Ektornet. Income amounted to SEK 2 421m (1 670). Net gains and losses on financial items at fair value within Group Treasury improved mainly due to the effects of falling interest rates and lower credit spreads. Sales activity within Ektornet has slowed since the portfolio has already been largely sold off, which has reduced other income. Expenses for Group Functions & Other decreased by 11 per cent to SEK 936m (1 050) compared with the same period in 2013. Excluding the net of services purchased and sold internally, expenses increased by 1 per cent to SEK 5 021m (4 953). The increase was mainly due to one-off expenses of SEK 136m in connection with the move of the head office and higher IT development expenses and staff costs. This was partly offset by lower expenses in Ektornet, where property management expenses are dropping as the portfolio is divested. Ektornet’s property values were written down by SEK 220m (375) during the year, of which SEK 16m related to the third quarter. The writedowns are attributable to Ukraine and the US. Group Products Swedbank’s product operations, Group Products (GP), are centralised at the Group level to create a more responsive and customer-driven product range and an efficient product organisation. Consisting of around 1 700 employees in Sweden, Estonia, Latvia and Lithuania, GP is responsible for a large part of Swedbank’s product areas. It is also tasked with supporting the business areas by reducing the complexity of the product range and simplifying sales in the various distribution channels. The product areas GP is responsible for – lending and deposits, payments, cards, asset management and insurance – are described in more detail starting on page 20. GP also comprises the subsidiary Swedbank Franchise AB, which in turn includes the real estate (Fastighetsbyrån and Svensk Fastighetsförmedling) and business brokerages (Företagsförmedling) and a legal service provider (Juristbyrån). In GP’s revenue and expense model, revenue from Swedbank’s customers is posted by each business segment and GP receives compensation from them to cover its expenses. GP’s external revenue largely comes from the savings banks. Expenses, excluding the net of services purchased and sold internally, amounted to SEK 2 445m (2 367) for the nine-month period. The cost increase was mainly due to increased expenses for IT, marketing and depreciation. Group Treasury Group Treasury is responsible for the bank’s funding, liquidity and capital planning. The Group’s equity is allocated to each business segment on the basis of capital adequacy rules and how much capital is needed based on the bank's Internal Capital Adequacy Assessment Process (ICAAP). Group Treasury prices all internal deposit and loan flows in the Group through internal interest rates, where the most important parameters are maturity, interest fixing period, currency and need for liquidity reserves.
- 18. Swedbank – Interim report January-September 2014 Page 18 of 61 Group Treasury’s result over time should be nearly nil, with the exception of earnings that may arise in debt and liquidity management within given risk mandates. Risk hedging by Group Treasury is generally achieved with financial instruments. The volatility in results over time is largely due to accounting-based fluctuations in these hedges. Net interest income for the nine-month period 2014 increased to SEK 1 646m, compared with SEK 1 517m in the same period in 2013. Falling market interest rates, especially in the second and third quarters, have benefited net interest income in 2014. During the third quarter net interest income improved to SEK 742m (457), which can be attributed to falling interest rates. Net gains and losses on financial items at fair value for the nine-month period amounted to SEK 161m, compared with SEK -783m in the same period in the previous year. The main reasons for the improved result were falling interest rates, lower credit spreads and lower repurchase volumes. During the third quarter a positive one-off currency effect of SEK 78m was posted, while the second quarter was positively affected by a change in the value of a strategic shareholding of SEK 80m. Net gains and losses for the third quarter amounted to SEK 327m, compared with SEK 81m in the second quarter. The third quarter also benefited from the positive effects from falling interest rates. Profit for the nine-month period for Group Treasury amounted to SEK 1 377m (493). Russia The Russian operations are reported since 2013 as discontinued operations. The result for discontinued operations for the period January-September was SEK -267m (-2 299). In the first half of 2013 the Ukrainian operations were included in discontinued operations and affected the result by SEK -2 236m, of which SEK -1 875m was reclassified to the income statement from other comprehensive income when the business was sold. A corresponding reclassification of SEK -223m was made during the second quarter 2014 for the winding down of the Russian operations. Swedbank’s net lending in Russia (including leasing) amounted to SEK 0.8bn as of 30 September. The lending portfolio in Russia, mainly consisting of good quality corporate loans, is decreasing as customers amortise their loans. Group Functions & Other consists of centralised business support units: Group Products, Group Staffs, and the remains of previous operations in Russia. Group staffs, which comprise Accounting & Finance (including Group Treasury and Communications), Risk, IT, Compliance, Public Affairs, HR and Legal, operate across business areas and serve as strategic and administrative support.
- 19. Swedbank – Interim report January-September 2014 Page 19 of 61 Eliminations Income statement Q3 Q2 Q3 Jan-Sep Jan-Sep SEKm 2014 2014 % 2013 % 2014 2013 % Net interest income 0 0 -1 4 2 100 Net commission income 19 19 0 26 -27 54 63 -14 Net gains and losses on financial items at fair value 0 0 0 0 0 Other income -69 -70 1 -95 27 -217 -243 11 Total income -50 -51 2 -70 -29 -159 -178 11 Staff costs 0 0 0 0 0 Variable staff costs 0 0 0 0 0 Other expenses -50 -51 2 -70 -29 -159 -178 11 Depreciation/amortisation 0 0 0 0 0 Total expenses -50 -51 2 -70 -29 -159 -178 11 Group eliminations mainly consist of eliminations of internal transactions between Group Functions and the other business segments.
- 20. Swedbank – Interim report January-September 2014 Page 20 of 61 Product areas Swedbank is a market leader in many product areas, including asset management, cards, payments and mortgage lending. Responsibility for the product units rests with Group Products (Group Functions & Other), but the results are reported in several legal units and in the three business segments. Lending/deposits Swedbank’s lending operations are concentrated in Sweden, Estonia, Latvia, Lithuania and Norway. Lending products account for 62 per cent of the assets on Swedbank’s balance sheet. Swedbank’s total lending to private customers and corporations amounted to SEK 1 287bn as of 30 September (1 215 as of 31 December 2013). Household lending represented the largest part, with mortgages to private customers in Sweden accounting for about 56 per cent. Swedbank is also a major player in corporate lending in Sweden, with lending of SEK 365bn. Its market share was 18 per cent as of 31 August (17 per cent as of 31 December 2013). Swedbank has a dominant position in property-related lending, which accounts for SEK 157bn, as well as in the forestry and agricultural sector, which accounts for SEK 68bn. In the Baltic countries Swedbank is the largest lender, with market shares of 19-34 per cent. Estonia, where Swedbank has a market share of slightly over 34 per cent, accounts for nearly half of the Baltic loan portfolio. Of Swedbank’s total lending, the Baltic countries account for 9 per cent. Lending in the Baltic countries amounted to SEK 121bn, about half of which is to households and half to companies. Major sectors for corporate lending in the Baltic countries include commercial real estate and manufacturing. Strong growth in the Swedish mortgage market has continued in 2014, with an annual growth rate of 5.8 per cent as of 31 August. Swedbank’s aggregate market share was 25 per cent as of 31 August. Its share of market growth was 24 per cent for the first eight months of the year. Lending is geographically spread throughout the country. Higher capital requirements for mortgages, coupled with a growing demand for transparency from customers and authorities, are creating new opportunities for Swedish mortgage lenders. For customers this means that Swedbank will be clearer about the factors that determine how we price mortgages, making it easier for them to see how they can affect their mortgage costs. Through the Swedish Bankers’ Association, Sweden’s banks promote a sound lending culture. At mid-year 2014 the association tightened its amortisation recommendation for mortgages, requiring borrowers to amortise down to a 70 per cent loan-to-value ratio (previously 75 per cent) within 10-15 years. As a result, Swedbank is seeing an increasing share of amortising customers with a loan-to-value ratio over 70 per cent. Swedbank is also a major player in deposits in its home markets. Total deposit volumes as of 30 September amounted to SEK 667bn (599), of which SEK 358bn (341) was to private customers and SEK 309bn (258) to corporate customers. Nearly 75 per cent of Swedbank’s total deposit volumes are in Sweden. For more information on Swedbank’s lending and deposits, see each business segment. Payment operations Swedbank is a leader in payment and cash management products in its four home markets. Growth in the payment area is a function of economic growth and customers’ increasing use of payment means other than cash. For example, Swish, a mobile payment service shared with other Swedish banks, is growing steadily and is now used by 1.7 million private customers. Since its launch in June, a new version of Swish for small businesses and organisations has attracted 3 600 business customers of Swedbank and the savings banks. The payment area is strongly affected by changes in the operating environment. Rapid technological developments are creating a challenge in the form of increased competition, especially from e-commerce companies. Swedbank is well equipped in this regard in terms of infrastructure, economies of scale and its long track record of strong consumer protection, an important factor as e-commerce grows. Over time regulatory changes will increase competition in selected parts of the payment area, which will have to be addressed mainly with cost efficiencies. A growing share of customers is managing their payments digitally. Today over 3 million of the bank’s customers in Sweden and 2.2 million in the Baltic countries have access to payment services through the Internet Bank and the Mobile Bank. The number of transactions through these channels grew by 13 per cent during the first nine months of 2014 year-on-year. Users of Mobile BankID, which facilitates online and mobile payments, are steadily increasing in number and now exceed 1 200 000, compared with 760 000 on 30 September 2013. During the third quarter Swedbank launched a trade finance solution that simplifies complex international transactions for companies by allowing them to use a single system even when multiple banks are involved. Payments Jan-Sep Jan-Sep Net commission income, SEKm 2014 2013 % Net commission income 707 737 -4 of which Nordic countries 293 367 -20 of which Baltic countries 414 370 12 Net commission income from payments decreased by 4 per cent year-on-year. The main reason was the outsourcing of ATMs in the second quarter 2013 to Bankomat AB, which is jointly owned by the five largest Swedish banks. This is reducing net commission income; however, excluding the cost increases related to the outsourcing, net commission income for payments is increasing. Domestic payments saw volume growth of 4 per cent, while income related to domestic payments in Sweden and the Baltic countries rose by 4 per cent and 12 per cent, respectively.
- 21. Swedbank – Interim report January-September 2014 Page 21 of 61 Commission income from international payments decreased by 4 per cent in Sweden and 16 per cent in the Baltic countries. The large decrease in the Baltic countries relates to the euro adoption in Latvia. Commission expenses for international payments decreased due to lower processing expenses. Commission income from other payments (e.g. e-payments) increased by 12 per cent in the Baltic countries but decreased by 3 per cent in the Nordic countries. Payments Jan-Sep Jan-Sep Key figures 2014 2013 % International payments (million) 7.8 7.4 5 of which Sweden 3.5 3.3 6 of which Baltic countries 4.3 4.1 5 Domestic payments (million) 1) 648.2 624.8 4 of which Sweden 479.7 461.5 4 of which Baltic countries 168.5 163.3 3 E-services payments (million) 2) 246.4 133.7 84 of which Sweden 218.4 117.2 86 of which Baltic countries 28.0 16.6 69 Factoring portfolio, SEKm 4 198 4 227 -1 of which Sweden 2 274 2 201 3 of which Baltic countries 1 924 2 026 -5 1) Domestic payments include salary and mass payments, giro payments, direct debit payments, internet payments. 2) E-payments include e-invoices, bank link payments, mobile phone top-up transactions, number of signed transactions and ID transactions through E-ID/BankID. Card business Swedbank issues cards to the public and acquires card payments from merchants via card terminals and online payments in all its home markets as well as in Norway, Denmark and Finland. Swedbank is Europe’s fifth largest card payment acquirer based on the number of transactions. Market shares in the bank’s home markets range from 50 to 70 per cent. Swedbank is also the 11th largest card issuer in Europe based on number of transactions. Customers are increasingly making retail purchases by card. In Sweden 80 per cent of retail purchases are by card, the highest percentage in the EU. In Estonia the corresponding figure is 50 per cent and in Lithuania and Latvia it is lower but steadily growing. The Swedish and Estonian markets are expected to continue to grow by about 9 per cent. In Latvia and Lithuania growth is estimated at 20 to 30 per cent annually. During the first nine months of the year the value of payments with Swedbank cards in Sweden grew by 8 per cent compared with the same period in 2013. During the same period ATM transactions decreased by 6 per cent in both number and volume. The trend in Estonia is similar. In Lithuania, where Swedbank created a programme to encourage greater card use, card payments are increasing significantly (28 per cent), while cash withdrawals are declining. While card payments are seeing increased growth, competition in the market is increasing as well. This is leading to price pressure, which in turn requires simpler internal processes and smarter, more cost-effective solutions. In card issuance the biggest growth opportunities in the bank’s home markets are in the area of corporate cards, where Swedbank has traditionally been weaker. The bank’s large number of small business customers provides good potential to grow this business. As digitisation increases, so does e-commerce, an important growth area for Swedbank. E-payments with Swedbank’s debit cards increased by 14 per cent during the first nine months of the year, compared with an increase of 8 per cent for brick-and-mortar purchases. Mobile phones are also being used increasingly for e-commerce and card payments. In April Swedbank launched Babs Micro, a mobile card acceptance terminal that allows small businesses and associations to accept card payments by mobile phone. Since its launch in May, over 600 companies have signed up for the service. Large international companies also recognise the value of mobile online payments. Apple is launching a new service this year in the US – Apple Pay – based on payments by MasterCard, Visa or American Express on the new Apple iPhones. This service is expected to reach Europe in 2016, when Swedbank cardholders with the latest iPhone versions should be able to link their Swedbank card to Apple Pay. Card related income Jan-Sep Jan-Sep SEKm 2014 2013 % Total income, SEKm 2 578 2 238 15 of which Nordic countries 1 332 1 288 3 of which Baltic countries 609 531 15 of which Entercard1) 638 419 52 1) Swedbank's share of the profit or loss of the associated company Entercard. Total card income increased by 15 per cent year-on-year. Card issuance income in Sweden rose by SEK 80m, in line with an increase in transactions of 10 per cent. Card issuance income rose in the Baltic countries, by SEK 75m, owing to increased card usage. Income from the card payment acquisition business in the Nordic region decreased slightly due to price pressure and higher expenses for interbank fees as a result of increased credit card volumes and increased expenses to Visa and MasterCard. Jan-Sep Jan-Sep Key ratios, cards 2014 2013 % Acquired transactions, million 1 445 1 310 10 of which Nordic countries 1 224 1 108 10 of which Baltic countries 220 202 9 Acquired volumes, SEKbn 353 323 9 of which Nordic countries 321 295 9 of which Baltic countries 32 28 15 Issued cards, millon 7.7 7.8 -1 of which Nordic countries 3.9 3.9 0 of which Baltic countries 3.8 3.9 -3 Number of card purchases, million 979 887 10 of which Nordic countries 723 664 9 of which Baltic countries 256 223 15
- 22. Swedbank – Interim report January-September 2014 Page 22 of 61 Asset management business Asset management operations are conducted through the Swedbank Robur group in Swedbank’s four home markets and in Norway. Robur is the leader in Sweden, with a market share of 22.9 per cent in terms of assets under management. Fund assets under management amounted to SEK 677bn (581) on 30 September, of which the Swedish operations accounted for SEK 649bn. Discretionary assets under management amounted to SEK 319bn (266). Of the total net inflow to the Swedish fund market, the majority was to fixed income funds (SEK 66bn) and mixed funds (SEK 39bn) during the nine-month period. Equity funds reported a positive inflow of SEK 4bn during the same period. The inflow to equity funds with passive management and lower management fees was SEK 8bn. The third quarter’s flows showed similar trends, with inflows to fixed income funds and mixed funds and slight outflows from equity funds. The total net inflow to Swedbank Robur’s funds in Sweden was SEK 16bn, including SEK 3bn during the third quarter. This includes inflows to fixed income funds (SEK 3bn) and mixed funds (SEK 2bn), while equity funds posted a further outflow of SEK 3bn. Swedbank’s market share of net inflows has improved to 13.4 per cent (10.4) during the first nine months, which is still lower than the share of assets under management. The inflow to discretionary asset management was SEK 28bn during the nine-month period. Asset management Jan-Sep Jan-Sep Key ratios, SEKbn 2014 2013 % Total income, SEKm 3 348 3 003 11 Assets under management 677 581 17 of which Sweden 649 560 16 of which Baltic countries 23 19 25 of which Norway 5 2 Discretionary asset management 319 266 20 of which Sweden 317 264 20 of which Baltic countries 2 2 0 Income from asset management products during the nine-month period increased by 11 per cent year-on-year. The improvement is mainly due to the market’s positive development, which increased average assets under management by 17 per cent. At the same time income has come under pressure from the shift to lower-margin products. Compared with the second quarter income increased by SEK 8m, mainly due to a positive stock market. Insurance business Swedbank has life insurance operations in all its home markets. In the Swedish market it is the seventh largest company, with a market share of about 7 per cent in terms of premium income. In Estonia and Lithuania Swedbank is the largest life insurance company, with market shares of 36 and 21 per cent respectively. Its market share in Latvia is 18 per cent. Non-life insurance is offered in the Baltic countries as well, with solutions primarily for private customers. Here the market share is 14 per cent in Estonia and 3 per cent in Latvia. In Lithuania, where the non-life business was launched in 2011, the market share is 1 per cent. Non-life insurance is offered in Sweden via a third-party solution through the insurance company Tre Kronor. Insurance products are sold through the distribution channels of Swedbank and the savings banks. Premium payments Jan-Sep Jan-Sep SEKm 2014 2013 % Sweden 11 563 10 730 8 of which collective occupational pensions 3 317 2 986 11 of which endowment insurance 5 556 5 290 5 of which occupational pensions 1 649 1 479 11 of which risk insurance 558 504 11 of which other 484 470 3 Baltic countries 888 750 18 of which life insurance 547 463 18 of which non-life insurance 342 287 19 During the nine-month period premium income in the life insurance business increased by 8 per cent compared with the same period in 2013. Demand for pension and insurance products will remain high for the foreseeable future, because of which there is potential to increase sales among existing customers, since only 20 per cent of the corporate customers of Swedbank and the savings banks have an occupational pension solution from Swedbank Försäkring. Premium payments from occupational pensions, including collective occupational pensions, increased by 11 per cent year-on-year. This is partly because the portfolio has grown and partly due to transfers from other insurers, which have risen by 49 per cent to SEK 1 134m, of which SEK 441m is capital transferred from collective occupational pensions. Swedbank is positive to the debate on expanded rights to transfer pension capital. Expanded transfer rights, combined with a simplified process, will increase the potential for further growth among existing customers. Swedbank’s share of the total transfer market is nearly 7 per cent, making us the eighth largest company in this market. Although parts of the insurance market (mainly customised occupational pension solutions) have high margins, a large part of new savings will be in low-margin products. To offer competitive services in the long term, Swedbank has made efficiencies and automation of internal processes a priority. Swedbank does not consider the fees currently charged in parts of the occupational pension market to be sustainable in the current low interest rate environment. The collectively negotiated ITP plan’s 1.5 million private sector employees are one of the fastest growing areas of the occupational pension market. Since July 2013, when Swedbank became a provider of choice, around
- 23. Swedbank – Interim report January-September 2014 Page 23 of 61 12 000 new agreements have been signed and SEK 468m has been transferred from other insurers. Baltic countries The number of savings products sold by Swedbank in the Baltic countries rose by 30 per cent year-on-year. The corresponding increase for risk products is 45 per cent. More new saving products sold mean higher premium income, which rose by 12 per cent in local currency compared with the same period in 2013. To meet the increased demand, Swedbank is the only life insurance company in the Baltic countries to offer its customers internet-based solutions for electronic identification, which make it possible to apply for and revise insurance policies and file claims. Premium income for non-life insurance in the Baltic operations grew by 13 per cent in local currency year-on- year. Increases were reported for every product, but especially home insurance, where advertising campaigns and more active sales by bank branches have led to higher volumes. Assets under management Assets under management 30 Sep 31 Dec SEKbn 2014 2013 % Sweden 130.8 118.2 11 of which collective occupational pensions 54.9 47.6 15 of which endowment insurance 52.7 49.6 6 of which occupational pensions 14.2 12.4 14 of which other 8.9 8.6 4 Baltic countries 3.8 3.1 20 of which life insurance 3.8 3.1 20 Assets under management in the Swedish insurance operations rose by 11 per cent to SEK 130.8bn during the nine-month period, of which SEK 114.0bn relates to unit linked and deposit insurance. The increase was due to higher stock prices and a positive net inflow. Assets under management in the Baltic life insurance company rose by 7 per cent in local currency, mainly due to increased unit linked insurance. Income Insurance related income Jan-Sep Jan-Sep SEKm 2014 2013 % Sweden 1 095 1 101 -1 of which life insurance 1 056 1 049 1 of which non-life insurance 39 52 -25 Baltic countries 287 284 1 of which life insurance 130 146 -11 of which non-life insurance 157 138 14 Total insurance related income 1 383 1 385 0 Swedbank’s total insurance related income amounted to SEK 1 383m (1 385). Income from the Swedish life business rose by 1 per cent, with higher assets under management resulting in increased income from savings products. At the same time the result for risk products and the return on equity decreased. The result for risk products was lower because 2013 contained a reversal of risk reserves due to revised assumptions about future claims. The return on equity has declined due to lower interest rates. The decrease in Swedish non-life insurance is the result of positive one-off effects in 2013. Income for the Baltic life business amounted to SEK 130m, a decrease of 15 per cent in local currency year-on- year. The decrease is mainly because low interest rates have led to higher provisions to cover guaranteed returns in traditional asset management. The result from the company’s core business, savings and risk, continues to rise. Income for the Baltic non-life business increased mainly due to an improved risk result, mainly because of a mild and relatively snow-free winter. The claims ratio for the period was 55 per cent, compared with 57 per cent in the same period of 2013.
- 24. Swedbank – Interim report January-September 2014 Page 24 of 61 Financial information - contents Group Page Income statement, condensed 25 Statement of comprehensive income, condensed 26 Key ratios 27 Balance sheet, condensed 28 Statement of changes in equity, condensed 29 Cash flow statement, condensed 30 Notes Note 1 Accounting policies 30 Note 2 Critical accounting estimates 31 Note 3 Changes in the Group structure 32 Note 4 Operating segments (business areas) 33 Note 5 Net interest income 35 Note 6 Net commission income 36 Note 7 Net gains and losses on financial items at fair value 37 Note 8 Other expenses 38 Note 9 Credit impairments 38 Note 10 Loans 39 Note 11 Impaired loans etc. 40 Note 12 Assets taken over for protection of claims and cancelled leases 40 Note 13 Credit exposures 40 Note 14 Intangible assets 41 Note 15 Amounts owed to credit institutions 42 Note 16 Deposits and borrowings from the public 42 Note 17 Debt securities in issue 42 Note 18 Derivatives 43 Note 19 Financial instruments carried at fair value 43 Note 20 Pledged collateral 46 Note 21 Offsetting financial assets and liabilities 46 Note 22 Capital adequacy consolidated situation 47 Note 23 Risks and uncertainties 50 Note 24 Business combinations 51 Note 25 Discontinued operations 52 Note 26 Related-party transactions 52 Note 27 Swedbank’s share 53 Note 28 Effects of changes in accounting policies 54 Parent company Income statement, condensed 55 Statement of comprehensive income, condensed 55 Balance sheet, condensed 56 Statement of changes in equity, condensed 57 Cash flow statement, condensed 57 Capital adequacy 58 More detailed information can be found in Swedbank’s fact book, www.swedbank.com/ir, under Financial information and publications.
- 25. Swedbank – Interim report January-September 2014 Page 25 of 61 Income statement, condensed Group Q3 Q2 Q3 Jan-Sep Jan-Sep SEKm 2014 2014 % 2013 % 2014 2013 % Interest income 10 343 10 461 -1 10 867 -5 31 343 33 049 -5 Interest expenses -4 514 -4 940 -9 -5 226 -14 -14 510 -16 646 -13 Net interest income (note 5) 5 829 5 521 6 5 641 3 16 833 16 403 3 Commission income 4 150 4 060 2 3 683 13 12 084 10 735 13 Commission expenses -1 334 -1 247 7 -1 163 15 -3 762 -3 302 14 Net commission income (note 6) 2 816 2 813 0 2 520 12 8 322 7 433 12 Net gains and losses on financial items at fair value (note 7) 799 773 3 170 1 917 1 023 87 Insurance premiums 422 471 -10 376 12 1 386 1 293 7 Insurance provisions -299 -337 -11 -247 21 -979 -827 18 Net insurance 123 134 -8 129 -5 407 466 -13 Share of profit or loss of associates 221 410 -46 240 -8 887 643 38 Other income 362 804 -55 525 -31 1 559 1 318 18 Total income 10 150 10 455 -3 9 225 10 29 925 27 286 10 Staff costs 2 469 2 901 -15 2 328 6 7 807 7 077 10 Other expenses (note 8) 1 508 1 846 -18 1 488 1 4 964 4 569 9 Depreciation/amortisation 187 172 9 179 4 538 518 4 Total expenses 4 164 4 919 -15 3 995 4 13 309 12 164 9 Profit before impairments 5 986 5 536 8 5 230 14 16 616 15 122 10 Impairment of intangible assets (note 14) 0 1 0 1 170 -99 Impairment of tangible assets 19 69 -72 95 -80 223 382 -42 Credit impairments (note 9) 235 30 -56 165 92 79 Operating profit 5 732 5 436 5 5 191 10 16 227 14 478 12 Tax expense 1 164 1 063 10 998 17 3 301 2 887 14 Profit for the period from continuing operations 4 568 4 373 4 4 193 9 12 926 11 591 12 Profit for the period from discontinued operations, after tax -2 -230 -99 -15 -87 -259 -2 292 -89 Profit for the period 4 566 4 143 10 4 178 9 12 667 9 299 36 Profit for the period attributable to the shareholders of Swedbank AB 4 560 4 139 10 4 172 9 12 652 9 289 36 of which profit for the period from continuing operations 4 562 4 369 4 4 187 9 12 911 11 581 11 of which profit for the period from discontinued operations -2 -230 -99 -15 -87 -259 -2 292 -89 Non-controlling interests 6 4 50 6 0 15 10 50 of which profit for the period from continuing operations 6 4 50 6 0 15 10 50 of which profit for the period from discontinued operations 0 0 0 0 0