The document discusses the specialty chemicals industry. It notes that the global specialty chemicals market was approximately $740 billion in 2011, with fine chemicals being the most lucrative segment. The Indian specialty chemicals market has grown rapidly in recent years and is currently estimated at $21.5 billion. Key export products from India include APIs and colorants. Going forward, innovation and sustainability initiatives are expected to be major factors for competitiveness in the industry. The market is driven by expansion in end-user industries, and focus on innovation for more efficient and safer specialty chemicals.

![Yasham Specialty Ingredients Pvt. Ltd.
Specialty Chemicals
5
INTRODUCTION
Specialty Chemicals:
Specialty chemicals (also called specialties or effect chemicals) are particular chemical products which
provide wide variety of effects on which many other industry sectors rely.
Some of the categories of specialty chemicals are:
Adhesives, Agrichemicals, Cleaning materials, Cosmetic additives, Construction chemicals, Elastomers,
Flavors, Food additives, Fragrances, Industrial gases, Lubricants, Polymers, Surfactants, and Textile
auxiliaries
Other industrial sectors such as automobile, aerospace, food, cosmetics, agriculture, manufacturing,
textile industries are highly dependent on such products. [1]
They are materials used on the basis of their performance or function. Consequently in addition to
"effect" chemicals they are sometimes referred to as "performance" chemicals or "formulation"
chemicals. They can be unique molecules or mixtures of molecules known as formulations. The physical
and chemical characteristics of the single molecules or the formulated mixtures of molecules and the
composition of the mixtures influence the performance end product. In commercial applications the
companies providing these products more often than not provide targeted customer service to
innovative individual technical solutions for their customers. [2]
Market Size:
Figure 1: Global Specialty Market, $B](https://image.slidesharecdn.com/786d0093-6cbb-4f2a-9d52-cf471d1be3dd-150512054956-lva1-app6892/85/SWATI-VAISH_Specialty-Chemical-Report_7-04-15-5-320.jpg)
![Yasham Specialty Ingredients Pvt. Ltd.
Specialty Chemicals
6
GLOBAL SCENARIO
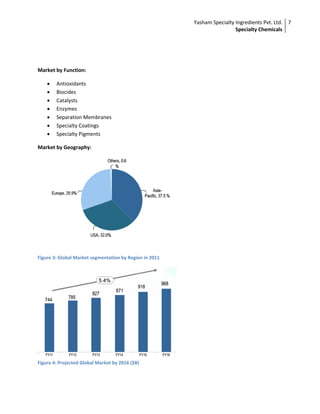
The global specialty chemicals market is ~ $740 billion in FY11 representing a compounded annual
growth rate of ~3.7% during 2006-11Global market declined sharply in 2009 due to global economic
crisis; however it also quickly bounced back strongly in 2010 to reach the sales value close to 2008
figure.
As reported at the 2004 annual meeting of the Specialized Organic Chemical Sector Association (SOCSA),
a sector association within the U.K.’s Chemical Industries Association, “Whilst the EU specialty chemicals
sector can be modestly optimistic about growth in the coming 12 months, this optimism is tempered by
the ever-increasing competition from China, whose export growth rate in specialty chemicals is a
startling 21%.”
India is also making a major commitment to specialty chemicals. In a speech at the Conference on
Specialty Chemicals: Competitiveness in the New Millennium, July 2003, New Delhi, Shyam S. Bhartia,
chairman of the chemicals committee of the Federation of Indian Chambers of Commerce and Industry,
stated that “[India] must use this opportunity and take the exports growth in the specialty chemicals
industry to more than 50% per annum from the current level of around 20%. Only then can we double
our share in the global chemical industry to nearly 4%. . . . We have the ability to be a large player in the
global specialty chemicals industry and a dominant player in select segments.”
Market by Application/Target Market:
Figure 2: Global Segmentation by products in 2010](https://image.slidesharecdn.com/786d0093-6cbb-4f2a-9d52-cf471d1be3dd-150512054956-lva1-app6892/85/SWATI-VAISH_Specialty-Chemical-Report_7-04-15-6-320.jpg)
![Yasham Specialty Ingredients Pvt. Ltd.
Specialty Chemicals
8
The global specialty chemicals market had total revenue of $767.5 billion in 2011, representing a
compound annual growth rate (CAGR) of 2.7% between 2007 and 2011. Fine chemicals sales proved the
most lucrative for the global specialty chemicals market in 2011, with total revenues of $221.5 billion.
The performance of the market is forecast to accelerate, with an anticipated CAGR of 5% for the five-
year period 2011 - 2016, which is expected to drive the market to a value of $980 billion by the end of
2016. [4]](https://image.slidesharecdn.com/786d0093-6cbb-4f2a-9d52-cf471d1be3dd-150512054956-lva1-app6892/85/SWATI-VAISH_Specialty-Chemical-Report_7-04-15-8-320.jpg)
![Yasham Specialty Ingredients Pvt. Ltd.
Specialty Chemicals
9
INDIAN MARKET [6]
Figure 5: Past Growth of Specialty Chemicals in India ($B)
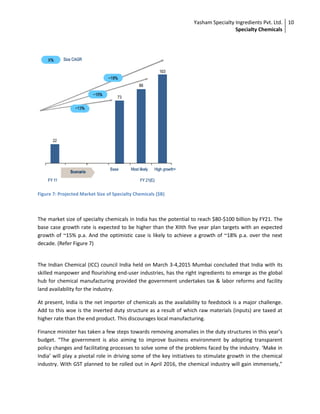
Indian chemical industry is rapidly growing industry and is estimated at ~$108 billion (as per CMIE 2010).
Of this the specialty chemicals account for ~20%, i.e. ~$21.5 billion ($17.7 billion of specialty chemicals
and $3.8 billion of agrochemicals, APIs not included here).
Figure 6: Targeted Growth for Specialty Chemicals in India ($B)
Specialty chemicals have observed a high growth rate in the past too. It has grown at ~12% p.a. since
2006 when the market size was ~ $12 billion (Refer Figure 5). The past growth has been mostly due to
growth in end use industries in the past, which has resulted in increased consumption for specialty
chemicals. Going ahead, the growth potential of the specialty chemicals consumption in India is strong
(Refer Figure 6) and it is expected to reach ~$ 45billion by FY17 ($38 billion for specialty chemicals and
$6.5 billion for agrochemicals).](https://image.slidesharecdn.com/786d0093-6cbb-4f2a-9d52-cf471d1be3dd-150512054956-lva1-app6892/85/SWATI-VAISH_Specialty-Chemical-Report_7-04-15-9-320.jpg)
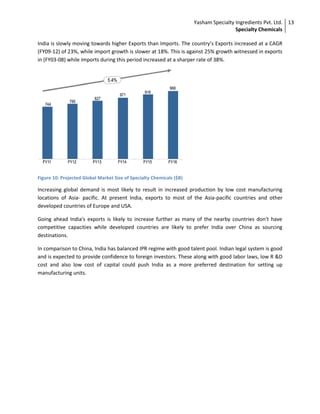
![Yasham Specialty Ingredients Pvt. Ltd.
Specialty Chemicals
12
IMPORT-EXPORT SCENARIO [6]
India exports significant proportion of its production of specialty chemicals and API. The key markets for
export of specialty chemicals are (Refer Figure 8)
Figure 8: Key Export Destination
Colorants (dyes and pigments) form the bulk of the export of specialty chemicals. Agrochemicals export
is also on the rise and major destinations for agrochemical exports are US, UK, France, Netherlands,
Spain, Belgium and Asia-pacific countries. API exports from India are into both regulated and semi
regulated markets spanning across the world.
Figure 9: India Export-Import ($B)](https://image.slidesharecdn.com/786d0093-6cbb-4f2a-9d52-cf471d1be3dd-150512054956-lva1-app6892/85/SWATI-VAISH_Specialty-Chemical-Report_7-04-15-12-320.jpg)
![Yasham Specialty Ingredients Pvt. Ltd.
Specialty Chemicals
14
ACTIVE PHARMACEUTICAL INGREDIENTS (API’s)[6]
Active Pharmaceutical Ingredients (APIs) are integral components of both the quality and the cost of
pharmaceutical goods. Pharmaceutical are one of the key necessities for public and this requires that
API players must account for high quality, sustainability and low prices. Driven by lower costs and high
quality (requires skill set and R&D also) the manufacturing of APIs have gradually moved to
manufacturing competitive countries of Asia-pacific like China and India. Mostly for generic drugs the
cost competitiveness becomes the key and as going ahead by 2014 almost $3Bn worth of drugs are
going off patent this increases the potential for API manufactures in India drastically
Indian players are also increasingly involved in providing API for regulated markets. Players such as
Piramal Healthcare, Divi's Labs, Dishman Pharma, Shasun and Aurobindo etc. supply API for patented
products to large and midsized pharmaceutical players in regulated markets.
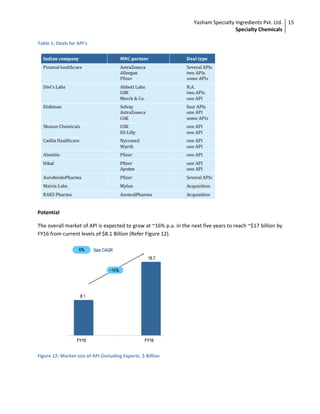
The total turnover of pharmaceutical segment in FY10 was ~$21.8 billion. Details of the overall market
size are given below (Refer Figure11).
Figure 11: Total Pharma Market in FY10: ~$21.8 Bn
The market break up is such that the of the total pharmaceutical segment API exports account for ~24%
of the total turnover resulting in a market size of ~$5.3 Billion. Rest $16.5 Billion is captured by
formulations.
The API exports and the consumption of API for domestic formulations together account for a market
size of almost $8.1 billion in FY10 with the API domestic consumption accounting only for ~35% of the
total production ($2.8 Bn).There has been growth in the export of the API as the market is estimated to
grow from ~60% of total production in 2008-09 (Source: Indian Pharmaceutical Industry, 2009 & ICRA)
to ~65% in 2009-10. This trend is also evident from the rising number of deals by Indian players for
supplying API in recent years. List of some of the deals is given below (Refer Table 1):-](https://image.slidesharecdn.com/786d0093-6cbb-4f2a-9d52-cf471d1be3dd-150512054956-lva1-app6892/85/SWATI-VAISH_Specialty-Chemical-Report_7-04-15-14-320.jpg)
![Yasham Specialty Ingredients Pvt. Ltd.
Specialty Chemicals
17
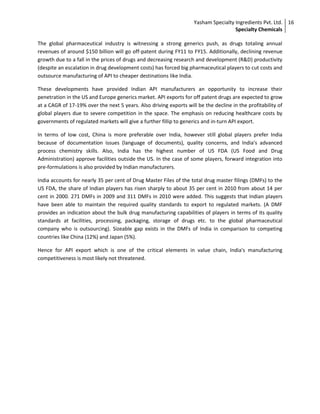
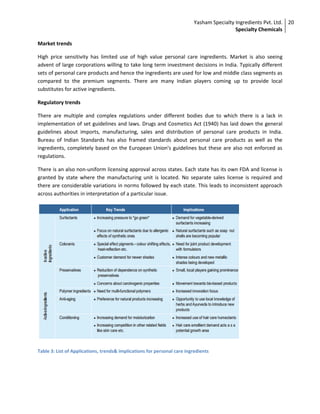
PERSONAL CARE CHEMICALS [6]
The market for personal care ingredients is broadly classified into commodity, fine chemical, and
specialty chemical ingredients. Specialty ingredients are further classified as active and inactive
ingredients based on their functionality in consumer products (Refer Figure 13)
Table 2: Segmentation – Personal care ingredients Industry
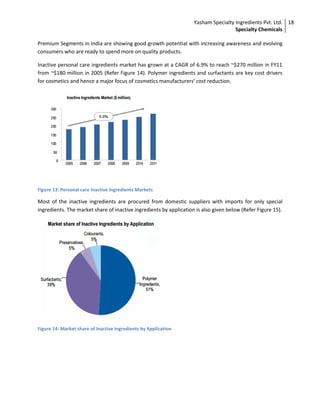
a. Inactive ingredients
Personal Care inactive ingredients refer to those ingredients that provide physical and process able
properties to a formulation as opposed to active properties. These include ingredients such as
surfactants, preservatives, colorants and polymer ingredients.
b. Active ingredients
Personal Care active ingredients refer to those ingredients that add active property to a product that
result in benefits to the end user as opposed to the formulation. These include ingredients such as Anti-
ageing ingredients, exfoliators, conditioning agents and UV agents.
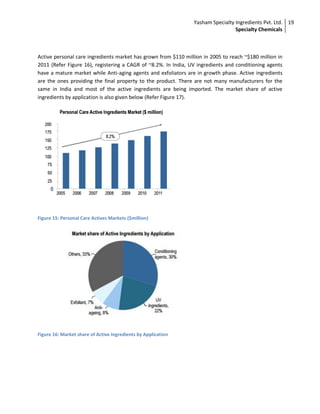
Personal care ingredients market is valued at ~$450 million in FY11 with Active ingredients accounting
for ~40% of the total market. In 2011, the total Indian personal care inactive ingredient market was
valued at ~$270 million while active ingredients market was valued at ~$180 million.
The market for personal care ingredients in India is becoming increasingly sophisticated. The constant
entry of foreign manufacturers has raised the standards expected of suppliers in this market. Market is
characterized by strong presence of MNCs like Cognis, Dow Corning, BASF, ISP, DSM, Merck etc.
Domestic players like Vivimed Laboratories, SAMI Labs and India Glycols are gaining prominence.](https://image.slidesharecdn.com/786d0093-6cbb-4f2a-9d52-cf471d1be3dd-150512054956-lva1-app6892/85/SWATI-VAISH_Specialty-Chemical-Report_7-04-15-17-320.jpg)
![Yasham Specialty Ingredients Pvt. Ltd.
Specialty Chemicals
22
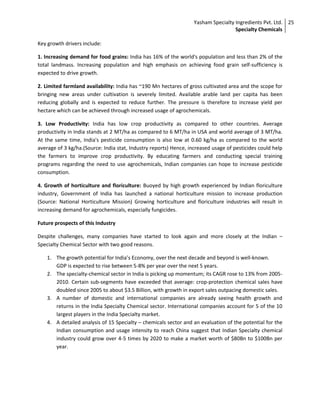
AGROCHEMICALS [6]
In India a high spent on food and being the largest employer status makes agriculture a significant part
of economy. Agriculture even though accounts for only ~17% of GDP it employs 55-60% of the
workforce. However Indian agriculture is faced with challenges like limited farmland availability and low
crop yields. India's crop yields in major crops like Rice, lentils, corn and soyabean is more than 50%
below China's. And one of the major reasons for this has been the low average crop protection
consumption in India. (Refer Figure 19)
Figure 17: Average crop protection consumption (Kg/Ha)
The primary reason for low usage could be attributed to:-
Low purchasing power of farmers
Lack of awareness among farmers regarding benefits of crop protection
chemicals
Reach and accessibility of products
Fragmented land holdings and low levels of irrigation
Dependence on monsoon
Agrochemicals are used to improve crop performance, yield or control pests, etc. Agrochemicals are
substances manufactured through chemical or biochemical processes containing the active ingredient in
a definite concentration along with other materials which improve its performance and increase safety.
For application, these are diluted with water in recommended doses and applied on seeds, soil,
irrigation water and crops to prevent the damages from pests. There are broadly 5 categories of crop
protection products: Insecticides, fungicides, herbicides, bio pesticides and others (includes
nematocides, rodenticides etc.).](https://image.slidesharecdn.com/786d0093-6cbb-4f2a-9d52-cf471d1be3dd-150512054956-lva1-app6892/85/SWATI-VAISH_Specialty-Chemical-Report_7-04-15-22-320.jpg)