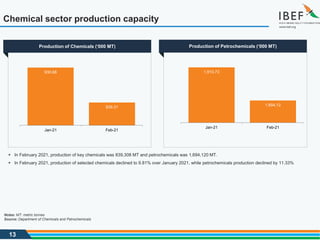
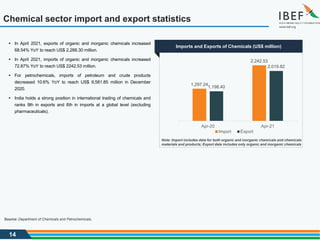
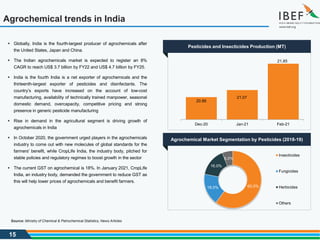
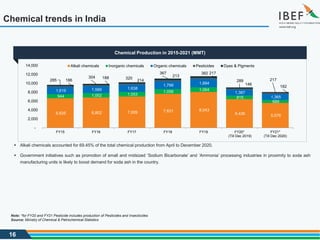
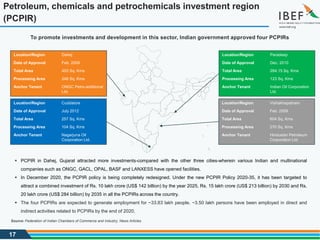
For updated information, please visit www.ibef.org
May 2021
CHEMICALS
2
Table of Contents
Executive Summary 3
Advantage India 4
Market Overview 6
Recent Trends and Strategies 12
Growth Drivers 19
Opportunities 26
Key Industry Contacts 31
Appendix 33
3
Executive summary
4. LARGEST GLOBAL
DYE SUPPLIER
 India is the second-largest
manufacturer and exporter
of dyes and accounts for
~16% of the world
production
1. GLOBAL POSITION
• Globally, India is the third-
largest consumer of polymers,
fourth-largest producer of
agrochemicals and sixth-largest
producer of chemicals.
• The Indian chemicals industry
makes up 3.4% of the global
chemicals industry.
• In 2019, the Indian chemicals
market stood at US$ 178 billion
and is forecast to reach US$
304 billion by 2025.
3. STRONG GROWTH IN SPECIALTY
CHEMICALS
 The specialty chemicals sector witnessed a significant growth of
~14% since 2015 and is expected to reach US$ 70 billion by end-
2020, followed by a CAGR of ~12-13% over the next five years.
 The key segments of specialty chemicals—including personal care
and paints & coatings—are likely to witness CAGR of ~13% and
~10%, respectively.
 Also, ICRA’s ratings indicate improved exports and a positive outlook
for agrochemicals and surfactants.
2. HIGHLY DIVERSIFIED
 The Indian chemicals industry is highly
diversified, covering >80,000 products and
employing >2 million people.
 A network of 200 national laboratories and
1,300 R&D centres provides a strong base to
the Indian chemical industry to drive
innovations.
 The chemical industry is expected to contribute
US$ 300 billion to India’s GDP by 2025.
Notes: GDP: Gross Domestic Product, FDI: Foreign Direct Investment, CAGR: Compounded Annual Growth Rate
Source: Department of Chemicals and Petrochemicals
1
2 3
4
4
Advantage India
5
Advantage India
Source: Budget 2020-21, News Articles, DPIIT, *Ultratech investors presentation May 2018
 Rise in demand from end-user
industries such as food processing,
personal care and home care is
driving development of different
segments in India’s specialty
chemicals market.
 The domestic chemicals sector's
small and medium enterprises are
expected to showcase 18-23%
revenue growth in FY22, owing to an
improvement in domestic demand
and higher realisation due to high
prices of chemicals.
1. Growing demand
► India’s specialty chemicals
companies are expanding their
capacities to cater to rising
demand from domestic and
overseas.
► With global companies seeking to
de-risk their supply chains, which
are dependent on China, the
chemical sector in India has the
opportunity for a significant growth.
4. Opportunities
► The government plans to introduce
production-linked incentive (PLI)
scheme to promote domestic
manufacturing of agrochemicals.
► Under the Union Budget 2021-22,
the government allocated Rs.
233.14 crore (US$ 32.2 million) to
the Department of Chemicals and
Petrochemicals.
3. Policy support
► PCPIRs are expected to attract
investments worth Rs. 7.63 lakh
crore (US$ 104.36 billion).
► Indian chemical companies spend
~1% of their revenue on R&D.
► An investment of Rs. 8 lakh crore
(US$ 107.38 billion) is estimated in
the Indian chemicals and
petrochemicals sector by 2025.
2. Increasing
investments and spending
ADVANTAGE
INDIA
1 4
3
2
6
Market Overview
MARKET OVERVIEW
7
Chemical industry market size (US$ billion)
178.0
194.6
212.8
232.6
254.3
278.1
304.0
FY19 FY20 FY21 FY22 FY23 FY24 FY25
CAGR 9.3%
Chemicals market in India
Source: Department of Chemicals and Petrochemicals,
 Chemicals industry in India covers >80,000 commercial products.
 India’s chemicals industry is de-licensed, except for a few
hazardous chemicals.
 The industry is expected to reach US$ 304 billion by 2025 at a
CAGR of 9.3%, driven by rising demand in the end-user segments
for specialty chemicals and petrochemicals segment.
 Specialty chemicals constitute for 22% of the total chemicals and
petrochemicals market in India. Demand for specialty chemicals is
expected to register 12% CAGR in 2019-22.
 Specialty chemical companies are seeking at import substitutions
while exploring export opportunities to accelerate their business.
 The petrochemical demand is expected to record a 7.5% CAGR
between 2019 and 2023, with the demand for polymers growing at
8%.
 The agrochemicals market in India is expected to register 8%
CAGR to reach US$ 3.7 billion by FY22 and US$ 4.7 billion by
FY25.
 The country ranks 14th in exports and 8th in imports of chemicals
worldwide.
Chemical Industry Revenue Shares in FY21
70.0%
30.0%
Non-SME
SME
8
Chemical's market is split into five key segments
Bulk chemicals
Petrochemicals
& polymers
Fertilisers
Specialty
chemicals
Agrochemicals
 These are groups of
chemicals, which are
manufactured on a large
scale and further divided
into organic, inorganic
and alkali chemicals
 These chemicals are
derivative of several
chemical compounds
such as hydrocarbons,
which are derived from
crude oil or natural gas
 These provide nutrients
for plant growth; are
divided into
organic/inorganic and
natural/synthetic. Further,
these can be broadly
classified into phosphate,
potassium and
nitrogenous
 These are derivatives of
basic chemicals that are
manufactured for specific
end-use solutions. The
characteristics of these
chemicals include high-
value, high R&D and low
volume
 These chemicals are
used to protect crops
against insects and pests
and include fungicides,
herbicides, and
insecticides, among
others. These chemicals
can be applied in water
irrigation, seeds, soils and
crops
Chemical's Market
9
Evolution of the Indian chemical sector
1939-1945 1950s-1960s 1980s-1990s 1990s-2000s 2000s to date
 Foreign drug supplies were
decreased, and several
Indian pharmaceutical
companies were
established.
 Companies included
Unichem, Chemo
Pharmaceuticals, Zandu
Pharmaceutical Works,
Chemical Industrial and
Pharmaceutical
Laboratories (CIPLA) and
East India Pharmaceutical
Works.
 Indian government
established five
public-sector
companies.
 Established Hindustan
Antibiotics Ltd. (HAL)
in 1954 and Indian
Drugs and
Pharmaceuticals Ltd.
(IDPL) in 1961.
 Expansion of the
petrochemical
industry.
 Development of
integrated naphtha
and gas crackers,
along with related
downstream plants for
polymers, synthetic
fibers, aromatics and
other chemicals.
 Indian players and
MNCs collaborated for
key investments.
 Lower tariff barriers
exposed the domestic
industry to competitors
(from imports).
 The chemical industry is
expected to contribute US$
300 billion to India’s GDP by
2025.
 Indian chemical companies
spend ~1% of their revenue
on R&D.
 Chemicals contributes 4% to
the total FDI equity inflow
and ~8% to the country’s
exports.
 Investments in
petrochemicals are driven by
growth in end-user
segments.
Source: KPMG report, News Articles
10
Key players in the chemical sector…(1/2)
Indian Companies
Source: Company website
Note: This list is indicative
1
PIDILITE INDUSTRIES LIMITED
Adhesives, sealants, waterproofing solutions, construction chemicals, industrial resins,
and polymers.
2
TATA CHEMICALS LIMITED
Gypsum , soda ash, soda bicarbonate, cement, salt, marine chemicals and crushed
refined soda.
3
UNITED PHOSPHORUS LIMITED
Crop protection, herbicide, fungicide, insecticide, water conservation, seed treatments,
adjuvants, biosolutions and fumigants.
4
GUJARAT FLUOROCHEMICALS LIMITED
Caustic soda, special chlorine derivatives, sodium chlorate, caustic potash,
chloromethane, phosphoric acid, hydrogen peroxide and water treatment solutions.
5
RELIANCE INDUSTRIES LIMITED
Polymers, elastomers, polyesters, aromatics, fibre-intermediates and advanced
materials.
11
Key players in the chemical sector…(2/2)
International Companies
Source: Company website
Note: This list is indicative
1
BASF INDIA LIMITED
Fungicide, herbicide, insecticide, industrial gases, alcohols and aldehydes, glycol ethers,
glycol ether acetates and esters.
2 E.I. DU PONT INDIA PRIVATE LIMITED
Adhesives, digital printing inks and packaging materials & solutions.
3
MITSUBISHI CHEMICAL INDIA PRIVATE LIMITED
Industrial chemicals, basic petrochemicals, solvents and methyl methacrylate monomer
& derivatives acrylonitrile & related products.
4
SABIC INDIA PRIVATE LIMITED
Aromatics, chlor-alkali, ethanolamines, ethoxylated surfactants, glycols, linear alpha
olefins, natural detergent alcohol and olefins.
5
EXXONMOBIL COMPANY INDIA PRIVATE LIMITED
Butyl, ethylene propylene diene (EPDM) rubber, polyethylene products, polymer
modifiers, polyolefin plastomers & elastomers and polypropylene.
12
Recent Trends and Strategies
13
Chemical sector production capacity
Notes: MT: metric tonnes
Source: Department of Chemicals and Petrochemicals
1,910.73
1,694.12
Jan-21 Feb-21
930.68
839.31
Jan-21 Feb-21
Production of Chemicals (‘000 MT) Production of Petrochemicals (‘000 MT)
 In February 2021, production of key chemicals was 839,308 MT and petrochemicals was 1,694,120 MT.
 In February 2021, production of selected chemicals declined to 9.81% over January 2021, while petrochemicals production declined by 11.33%
14
Imports and Exports of Chemicals (US$ million)
Source: Department of Chemicals and Petrochemicals,
1,297.24
2,242.53
1,198.40
2,019.82
Apr-20 Apr-21
Import Export
Note: Import includes data for both organic and inorganic chemicals and chemicals
materials and products; Export data includes only organic and inorganic chemicals
Chemical sector import and export statistics
 In April 2021, exports of organic and inorganic chemicals increased
68.54% YoY to reach US$ 2,288.30 million.
 In April 2021, imports of organic and inorganic chemicals increased
72.87% YoY to reach US$ 2242.53 million.
 For petrochemicals, imports of petroleum and crude products
decreased 10.6% YoY to reach US$ 9,581.85 million in December
2020.
 India holds a strong position in international trading of chemicals and
ranks 9th in exports and 6th in imports at a global level (excluding
pharmaceuticals).
15
Source: Ministry of Chemical & Petrochemical Statistics, News Articles
Agrochemical Market Segmentation by Pesticides (2018-19)
 Globally, India is the fourth-largest producer of agrochemicals after
the United States, Japan and China.
 The Indian agrochemicals market is expected to register an 8%
CAGR to reach US$ 3.7 billion by FY22 and US$ 4.7 billion by FY25.
 India is the fourth India is a net exporter of agrochemicals and the
thirteenth-largest exporter of pesticides and disinfectants. The
country’s exports have increased on the account of low-cost
manufacturing, availability of technically trained manpower, seasonal
domestic demand, overcapacity, competitive pricing and strong
presence in generic pesticide manufacturing
 Rise in demand in the agricultural segment is driving growth of
agrochemicals in India
 In October 2020, the government urged players in the agrochemicals
industry to come out with new molecules of global standards for the
farmers' benefit, while CropLife India, the industry body, pitched for
stable policies and regulatory regimes to boost growth in the sector
 The current GST on agrochemical is 18%. In January 2021, CropLife
India, an industry body, demanded the government to reduce GST as
this will help lower prices of agrochemicals and benefit farmers.
Agrochemical trends in India
Pesticides and Insecticides Production (MT)
20.86
21.07
21.85
Dec-20 Jan-21 Feb-21
60.0%
18.0%
16.0%
6.0%
Insecticides
Fungicides
Herbicides
Others
16
Note: *for FY20 and FY21 Pesticide includes production of Pesticides and Insecticides
Source: Ministry of Chemical & Petrochemical Statistics
Chemical trends in India
 Alkali chemicals accounted for 69.45% of the total chemical production from April to December 2020.
 Government initiatives such as promotion of small and midsized ‘Sodium Bicarbonate’ and ‘Ammonia’ processing industries in proximity to soda ash
manufacturing units is likely to boost demand for soda ash in the country.
Chemical Production in 2015-2021 (MMT)
6,625 6,802 7,009 7,631 8,043
6,436 5,576
944 1,002 1,053
1,058 1,064
815
689
1,619 1,589 1,638
1,799
1,884
1,387
1,365
186
188
214
213
217
146
182
285
304 320
367 382
289 217
-
2,000
4,000
6,000
8,000
10,000
12,000
14,000
FY15 FY16 FY17 FY18 FY19 FY20*
(Till Dec 2019)
FY21*
(Till Dec 2020)
Alkali chemicals Inorganic chemicals Organic chemicals Pesticides Dyes & Pigments
17
Petroleum, chemicals and petrochemicals investment region
(PCPIR)
Source: Federation of Indian Chambers of Commerce and Industry, News Articles
To promote investments and development in this sector, Indian government approved four PCPIRs
Location/Region Dahej
Date of Approval Feb. 2009
Total Area 453 Sq. Kms
Processing Area 248 Sq. Kms
Anchor Tenant ONGC Petro-additional
Ltd.
Location/Region Paradeep
Date of Approval Dec. 2010
Total Area 284.15 Sq. Kms
Processing Area 123 Sq. Kms
Anchor Tenant Indian Oil Corporation
Ltd.
Location/Region Cuddalore
Date of Approval July 2012
Total Area 257 Sq. Kms
Processing Area 104 Sq. Kms
Anchor Tenant Nagarjuna Oil
Corporation Ltd.
Location/Region Vishakhapatnam
Date of Approval Feb. 2009
Total Area 604 Sq. Kms
Processing Area 270 Sq. Kms
Anchor Tenant Hindustan Petroleum
Corporation Ltd.
 PCPIR in Dahej, Gujarat attracted more investments-compared with the other three cities-wherein various Indian and multinational
companies such as ONGC, GACL, OPAL, BASF and LANXESS have opened facilities.
 In December 2020, the PCPIR policy is being completely redesigned. Under the new PCPIR Policy 2020-35, it has been targeted to
attract a combined investment of Rs. 10 lakh crore (US$ 142 billion) by the year 2025, Rs. 15 lakh crore (US$ 213 billion) by 2030 and Rs.
20 lakh crore (US$ 284 billion) by 2035 in all the PCPIRs across the country.
 The four PCPIRs are expected to generate employment for ~33.83 lakh people. ~3.50 lakh persons have been employed in direct and
indirect activities related to PCPIRs by the end of 2020.
18
1
3
2
2. Kanoria Chemicals &
Industries Limited
 The company’s AlcoChem Ankleshwar Division runs ‘waste to
wealth’ programme, which involves treatment of effluent and
recycling water by a ‘Reverse Osmosis’ process developed by the
company.
1. Tata Chemicals
 Tata Chemicals commissioned a
solar photo-voltaic plant to save
energy.
 With an aim to control greenhouse
gas emissions, it proposed to
establish a 150 kWp grid-connected
solar photovoltaic power plant on
the rooftop terrace of the electrical
sub-station.
3. Arulpuram
Common Effluent
Treatment Co.
Pvt. Ltd.
 The company adopted technology to
recycle >98% of water and reuse >90%
of salt.
 The process consisted of a pre-
treatment system, followed by water
recovery system using reverse
osmosis.
Indian chemical companies are investing in innovative solutions, focusing on issues such as water,
environmental impact, raw materials, safety over lifecycle and energy use
Chemical players focusing on sustainable development
Source: News Articles
19
Growth Drivers
GROWTH DRIVERS
20
Strong demand and policy support driving investments
Higher real disposable
incomes
Shift in production and
consumption towards
Asian and Southeast
Asian countries
Shift in consumer
preference towards
environment-friendly
products
100% FDI under the
automatic route in the
chemical sector,
except for hazardous
chemicals
MSIHC Rules to be
merged with CAEPPR
to safely handle
hazardous chemicals
Establishing PCPIRs
(investment regions
for petroleum,
chemicals and
petrochemicals)
Domestic and
overseas companies
investing in greenfield
or brownfield projects
Increase in FDI
investments
Notes: MSIHC: Manufacture Storage and Import of Hazardous Chemicals, CAEPPR: Chemical Accidents Emergency Planning, Preparedness and Response
Source: News Articles
Growing demand Policy support Increasing investment
Inviting
Resulting
in
21
Source: National Council of Applied Research, World Economic Forum
Middle-class Growth in India (million)
63 68 73 78 84 90 97 104
148
0
50
100
150
200
FY18 FY19 FY20 FY21 FY22 FY23 FY24 FY25 FY30
CAGR 7.4%
• By 2030, India is likely to have ~80% of the
households in the middle-income group.
• The growing middle-class and increasing
urbanisation is driving the demand for
personal care, agrochemicals, food, paints
& coatings resulting into higher
consumption of chemicals per capita.
Rise in domestic
demand
Manufacturing as % of GDP
14
20
0
5
10
15
20
25
2019 2025E
• Government considers the manufacturing
sector to be a key focus area and has
contacted ~1,450 companies worldwide to
manufacture in India.
• The government plan includes 2-3
autonomous zones which does not have
labor and land laws.
• ~300 companies are actively pursuing
production plans in mobiles, electronics,
medical devices and textiles.
Government
aims to boost
manufacturing
share in GDP to
20% by 2025
Key growth drivers…(1/2)
22
Key growth drivers…(2/2)
1
EMERGING MANUFACTURING HUBS
The dedicated integrated manufacturing hubs under Petroleum, Chemicals and Petrochemicals Investment
Regions (PCPIR) policy to attract an investment of Rs. 20 lakh crore (US$ 276.46 billion) by 2035.
2
RISE IN DISINFECTANT DEMAND POST COVID-19
With increasing demand for disinfestation of personal and public places post COVID-19, the chloro-alkali,
ethanol, personal care, and surfactant industry is expected to record significant growth in near future.
3
FOREIGN INVESTMENT
Presence of prominent global players, such as BASF, Dow Chemicals, Bayer and others, 100% FDI in the
chemicals sector and stringent laws on anti-dumping to drive the Indian chemical market.
5 GROWING END USE INDUSTRIES
Demand from packaging, construction, automotive and other industries to drive the Indian chemical market.
4
SKILLED AND LOW-COST MANPOWER
The skilled and low-cost labour, world-class engineering and strong R&D set-up enable chemicals industries
in India.
23
4.CONSTRUCTION
 ‘Smart City’ projects by the
Indian government are driving
growth of chemical companies in
India. Availability of essential
raw materials at low cost is
anticipated to increase demand
for construction chemicals.
1. AUTOMOTIVE
• Disruption in automotive
sector with the emergence
of autonomous driving,
connected cars, electric
vehicles and shared
mobility will affect the value
chain of Indian chemical
companies supplying
chemicals to automotive
applications.
3. TEXTILE, FLAVOURS &
FRAGRANCES
 India has witnessed increasing demand for wide range of
cosmetic chemicals, health care products and hygiene
products that use specialty chemicals, polymers and oleo
chemicals. This segment is likely to outperform other
segments.
2. WATER TREATMENT
 Increasing urbanisation and population is
driving the demand for safe drinking water.
Moreover, rising awareness of hygiene
among the people is leading to excessive
water consumption.
Source: News Articles
Key industries driving growth
1
2 3
4
24
2
1
Source: Company Websites, News Sources,
Recent developments and investments by key players (1/2)
Rise in production
 HIL (Hindustan Insecticides Limited) signed a memorandum of understanding with the Department of Chemicals & Petro Chemicals
to achieve revenue target of Rs. 451 crore (US$ 60.86 million)
 In October 2020, HIL manufactured its highest-ever production of >530 tonne of Malathion Technical in the first two quarters of the
year.
M&As
 Pidilite Industries acquired Huntsman Group's Indian subsidiary for Rs. 2,100 crore (US$ 283.38 million) to strengthen its adhesives
and sealants portfolio and complement its retail portfolio.
3
Self-reliant in fertilisers
 By 2023, India will be self-reliant in fertiliser production and reduce import dependency, by establishing new units covering an
investment of Rs.400 billion. At present, Indian fertiliser production stands at 42-45 million tonnes and imports at 18 million tonnes
4
Public-private partnership (PPP) model
 Bhoramdev Cooperative Sugar Factory Kawardha and Chhattisgarh Distillery’s subsidiary NKJ Biofuel signed a memorandum of
understanding (MoU) for the country's first ethanol plant to be set up in the state under the public-private partnership (PPP) model.
25
Source: Company Websites, News Sources,
Recent developments and investments by key players (2/2)
5
6
Skills and technical support
 Central Institute of Petrochemicals Engineering & Technology (CIPET), under the Ministry of Chemicals and Fertilisers, will establish
two new ‘Centres for Skilling and Technical Support’ (CSTS) at Bhagalpur, Bihar and Varanasi, Uttar Pradesh. This will act as a
catalyst for development and growth of new and existing industries in the region
7
International collaboration
 Prince Pipes and Fittings (PPFL) entered into a technical collaboration with Tooling Holland, an international plastic injection
moulding industry, based in The Netherlands
 Germany headquartered SCHOTT AG, an international specialty glass and technical ceramic materials manufacturer, increases
sales in India and plans record investments
Sulphonation plant set up
 Ultramarine & pigments have successfully commissioned the Sulphonation plant setup in Nellore, Andhra Pradesh, to manufacture
surfactants and specialty chemicals.
26
Opportunities
OPPORTUNITIES
27
Specialty chemicals - aggressive capex to drive growth
 Specialty chemical companies in India have started
accelerating their capex plan on the back of strong growth
visibility and emerging opportunities
 Due to growing environmental concerns, many
chemical companies in China ceased activities in
2018; this led to an increase in manufacturing of
specialty chemicals in the Indian market to ensure
uninterrupted supply
Key growth drivers in the end-user industry for specialty
chemicals include the following:
 Paints & coatings: Increase in urbanisation, increase in
middle-income households, high replacement demand
and increase in per capita income.
 Textile: Increase in Indian export, increase in urbanisation
and higher disposal income.
 Construction: Low expenditure on admixtures compared
with China and the US.
 Home care: Increased consumption.
Subsegments User Industries
Paints & Coatings Construction, Automotive
Special Polymers Packaging Automotive
Construction Chemicals Infrastructure, Real Estate
Paper Chemicals Printing, Packaging
Textile Chemicals Apparel, Technical Textile
Water Chemicals Industrial Water, Municipal Water
Cosmetic Chemical Bath, Shower, Haircare
Flavours & Fragrances Food Processing, Personal Care
Agro Chemicals Agriculture, Exports
Home Care Surfactants Laundry Care, Dishwashing
Colourants Textile, Exports
Source: Department of Chemicals and Petrochemicals
28
Favourable initiatives by government
Source: Department of Chemicals and Petrochemicals,
1
A 2034 vision for the chemicals and petrochemicals sector has been set up by the government to explore
opportunities to improve domestic production, reduce imports and attract investments in the sector. The
government plans to implement production-link incentive system with 10-20% output incentives for the
agrochemical sector; to create an end-to-end manufacturing ecosystem through the growth of clusters.
2  100% FDI is allowed in the chemical sector under automatic route with exception to few hazardous
chemicals
3  Industrial licensing is approved in most sectors, except for few hazardous chemicals
4  The Indian Government supports the industry in research & development, reduced the basic customs duty
on several products and offers support through the ‘Make in India’ campaign
5  Four Petroleum, Chemicals and Petrochemical Investment Regions (PCPIRs) have been set up as the
investment regions for petroleum, chemicals and petrochemicals along with associated services
29
Favourable initiatives by government
Source: Department of Chemicals and Petrochemicals,
6 The Government of India is considering launching a production-linked incentive (PLI) scheme in the
chemical sector to boost domestic manufacturing and exports.
30
4. EXPOSURE TO
CUTTING-EDGE
TECHNOLOGIES
• Atul Chemicals, partnered
with Akzo Nobel to access
state-of-the-art eco-friendly
hydrogenation technology for
monochloroacetic acid
(MCA) production in India.
1. VALUE-CHAIN
INTEGRATION
• Camlin Fine Sciences
acquired Borregaard Italia
Spa54, a raw-material catechol
manufacture, and Ningbo
Wanglong, an end-product
vanillin flavour manufacturer
• The vertical integration made
CFS the third-largest vanillin
producer worldwide
2. ALTERNATIVE AND LOW-COST
FEEDSTOCK
• In November 2020, NextChem, and Indian Oil Corp.
Ltd. (IndianOil) signed a memorandum of
understanding (MOU) to use NextChem technologies to
build industrial projects to support industrialisation of
India's sustainable development.
• The projects would emphasis on recycling of plastics,
production of biofuels from renewable feedstock and
circular fuels and non-recyclable waste chemicals.
Many Indian chemical companies are focussing on attaining scale to build their margins and enhance environmental sustainability
Chemical industry: Exploring new opportunities
1
2 3
4
Source: Company Website, News Articles
3. GLOBAL FOOTPRINT AND
CUSTOMER SEGMENTS
• Aarti Industries generates >40% revenue from the
global markets.
• UPL has presence in multiple markets with >30% of its
revenue generated from Latin America.
• SH Kelkar has completed several strategic
acquisitions, including China-based Anhui Ruibang
Aroma and Italy’s Creative Flavours and Fragrances;
this helped expand its portfolio, improve technological
platforms and gain access to new markets.
31
Key Industry Contacts
32
Key Industry Contacts
Agency Contact Information
Department of Chemicals &
Petrochemicals
Dept. of Chemicals & Petrochemicals,
Ministry of Chemicals & Fertilisers,
341-(C), A-wing, 3rd floor, Shastri Bhawan, New Delhi-110001
Phone: +91 11 23383428 Fax: +91 11 23073682(F)
Email: samir.biswas@gov.in Website: https://chemicals.nic.in
Indian Chemical Council
Sir Vithaldas Chambers, 6th Floor 16 Mumbai Samachar Marg,
MUMBAI - 400 001
Phone: +91 22 61144000 / 22048043
Email: iccmumbai@iccmail.in, events@iccmail.in Website:
www.icmaindia.com
Dye Manufacturers Association of
India
A-317, 3rd Floor, Antop Hill Warehousing
Complex, Vidyalankar College Road, Near Barkat
Ali Naka, Wadala (East), Mumbai - 400 037. India
Phone: +91 22 24158156, 24158157 Fax: +91 22
24157374
Email: info@dmai.org Website: http://dmai.org/
Alkali Manufacturers Association of
India
Alkali Manufacturers Association of India,3rd Floor, Pankaj
Chambers, Commercial Complex
Preet Vihar, Vikas Marg, Delhi 110092
Phone: +91 11 22432003, 22410150 Fax: +91 11 22468249
Email: hkanand@ama-india.org, info@ama-india.org Website:
www.ama-india.org
Indian Specialty
Chemical
Manufacturers'
Association
1156, Bole Smruti, Suryavanshi Kshatriya Sabhagriha Marg,
Off. Veer Savarkar Marg,
Dadar (West), Mumbai - 400 028
Phone: +91 22 2446 5003
Email: info@iscma.in, iscma@email.com Website:
www.iscma.in
33
Appendix
34
 CAGR: Compound Annual Growth Rate
 Capex: Capital Expenditure
 MMTPA: Million metric tons per annum
 CENVAT: Central Value Added Tax
 EHTP: Electronic Hardware Technology Park
 EPCG: Export Promotion Capital Goods Scheme
 FDI: Foreign Direct Investment
 FY: Indian Financial Year (April to March); So, FY10 implies April 2009 to March 2010
 LCD: Liquid Crystal Display
 R&D: Research and Development
 US$ : US Dollar
 Wherever applicable, numbers have been rounded off to the nearest whole number
Glossary
35
Exchange rates
Exchange Rates (Fiscal Year) Exchange Rates (Calendar Year)
Year Rs. Equivalent of one US$
2004-05 44.95
2005-06 44.28
2006-07 45.29
2007-08 40.24
2008-09 45.91
2009-10 47.42
2010-11 45.58
2011-12 47.95
2012-13 54.45
2013-14 60.50
2014-15 61.15
2015-16 65.46
2016-17 67.09
2017-18 64.45
2018-19 69.89
2019-20 70.49
2020-21 73.20
Source: Reserve Bank of India, Average for the year
Note: As of April 2021
Year Rs. Equivalent of one US$
2005 44.11
2006 45.33
2007 41.29
2008 43.42
2009 48.35
2010 45.74
2011 46.67
2012 53.49
2013 58.63
2014 61.03
2015 64.15
2016 67.21
2017 65.12
2018 68.36
2019 69.89
2020 74.18
2021* 74.94
36
Disclaimer
India Brand Equity Foundation (IBEF) engaged Sutherland Global Services private Limited to prepare/update this presentation.
All rights reserved. All copyright in this presentation and related works is solely and exclusively owned by IBEF, delivered during the course of
engagement under the Professional Service Agreement signed by the Parties. The same may not be reproduced, wholly or in part in any material
form (including photocopying or storing it in any medium by electronic means and whether or not transiently or incidentally to some other use of this
presentation), modified or in any manner communicated to any third party except with the written approval of IBEF.
This presentation is for information purposes only. While due care has been taken during the compilation of this presentation to ensure that the
information is accurate to the best of Sutherland Global Services’ Private Limited and IBEF’s knowledge and belief, the content is not to be construed
in any manner whatsoever as a substitute for professional advice.
Sutherland Global Services Private Limited and IBEF neither recommend nor endorse any specific products or services that may have been
mentioned in this presentation and nor do they assume any liability, damages or responsibility for the outcome of decisions taken as a result of any
reliance placed on this presentation.
Neither Sutherland Global Services Private Limited nor IBEF shall be liable for any special, direct, indirect or consequential damages that may arise
due to any act or omission on the part of the user due to any reliance placed or guidance taken from any portion of this presentation.

Chemicals-May-2021 (1).pdf

  • 1.
    For updated information,please visit www.ibef.org May 2021 CHEMICALS
  • 2.
    2 Table of Contents ExecutiveSummary 3 Advantage India 4 Market Overview 6 Recent Trends and Strategies 12 Growth Drivers 19 Opportunities 26 Key Industry Contacts 31 Appendix 33
  • 3.
    3 Executive summary 4. LARGESTGLOBAL DYE SUPPLIER  India is the second-largest manufacturer and exporter of dyes and accounts for ~16% of the world production 1. GLOBAL POSITION • Globally, India is the third- largest consumer of polymers, fourth-largest producer of agrochemicals and sixth-largest producer of chemicals. • The Indian chemicals industry makes up 3.4% of the global chemicals industry. • In 2019, the Indian chemicals market stood at US$ 178 billion and is forecast to reach US$ 304 billion by 2025. 3. STRONG GROWTH IN SPECIALTY CHEMICALS  The specialty chemicals sector witnessed a significant growth of ~14% since 2015 and is expected to reach US$ 70 billion by end- 2020, followed by a CAGR of ~12-13% over the next five years.  The key segments of specialty chemicals—including personal care and paints & coatings—are likely to witness CAGR of ~13% and ~10%, respectively.  Also, ICRA’s ratings indicate improved exports and a positive outlook for agrochemicals and surfactants. 2. HIGHLY DIVERSIFIED  The Indian chemicals industry is highly diversified, covering >80,000 products and employing >2 million people.  A network of 200 national laboratories and 1,300 R&D centres provides a strong base to the Indian chemical industry to drive innovations.  The chemical industry is expected to contribute US$ 300 billion to India’s GDP by 2025. Notes: GDP: Gross Domestic Product, FDI: Foreign Direct Investment, CAGR: Compounded Annual Growth Rate Source: Department of Chemicals and Petrochemicals 1 2 3 4
  • 4.
  • 5.
    5 Advantage India Source: Budget2020-21, News Articles, DPIIT, *Ultratech investors presentation May 2018  Rise in demand from end-user industries such as food processing, personal care and home care is driving development of different segments in India’s specialty chemicals market.  The domestic chemicals sector's small and medium enterprises are expected to showcase 18-23% revenue growth in FY22, owing to an improvement in domestic demand and higher realisation due to high prices of chemicals. 1. Growing demand ► India’s specialty chemicals companies are expanding their capacities to cater to rising demand from domestic and overseas. ► With global companies seeking to de-risk their supply chains, which are dependent on China, the chemical sector in India has the opportunity for a significant growth. 4. Opportunities ► The government plans to introduce production-linked incentive (PLI) scheme to promote domestic manufacturing of agrochemicals. ► Under the Union Budget 2021-22, the government allocated Rs. 233.14 crore (US$ 32.2 million) to the Department of Chemicals and Petrochemicals. 3. Policy support ► PCPIRs are expected to attract investments worth Rs. 7.63 lakh crore (US$ 104.36 billion). ► Indian chemical companies spend ~1% of their revenue on R&D. ► An investment of Rs. 8 lakh crore (US$ 107.38 billion) is estimated in the Indian chemicals and petrochemicals sector by 2025. 2. Increasing investments and spending ADVANTAGE INDIA 1 4 3 2
  • 6.
  • 7.
    7 Chemical industry marketsize (US$ billion) 178.0 194.6 212.8 232.6 254.3 278.1 304.0 FY19 FY20 FY21 FY22 FY23 FY24 FY25 CAGR 9.3% Chemicals market in India Source: Department of Chemicals and Petrochemicals,  Chemicals industry in India covers >80,000 commercial products.  India’s chemicals industry is de-licensed, except for a few hazardous chemicals.  The industry is expected to reach US$ 304 billion by 2025 at a CAGR of 9.3%, driven by rising demand in the end-user segments for specialty chemicals and petrochemicals segment.  Specialty chemicals constitute for 22% of the total chemicals and petrochemicals market in India. Demand for specialty chemicals is expected to register 12% CAGR in 2019-22.  Specialty chemical companies are seeking at import substitutions while exploring export opportunities to accelerate their business.  The petrochemical demand is expected to record a 7.5% CAGR between 2019 and 2023, with the demand for polymers growing at 8%.  The agrochemicals market in India is expected to register 8% CAGR to reach US$ 3.7 billion by FY22 and US$ 4.7 billion by FY25.  The country ranks 14th in exports and 8th in imports of chemicals worldwide. Chemical Industry Revenue Shares in FY21 70.0% 30.0% Non-SME SME
  • 8.
    8 Chemical's market issplit into five key segments Bulk chemicals Petrochemicals & polymers Fertilisers Specialty chemicals Agrochemicals  These are groups of chemicals, which are manufactured on a large scale and further divided into organic, inorganic and alkali chemicals  These chemicals are derivative of several chemical compounds such as hydrocarbons, which are derived from crude oil or natural gas  These provide nutrients for plant growth; are divided into organic/inorganic and natural/synthetic. Further, these can be broadly classified into phosphate, potassium and nitrogenous  These are derivatives of basic chemicals that are manufactured for specific end-use solutions. The characteristics of these chemicals include high- value, high R&D and low volume  These chemicals are used to protect crops against insects and pests and include fungicides, herbicides, and insecticides, among others. These chemicals can be applied in water irrigation, seeds, soils and crops Chemical's Market
  • 9.
    9 Evolution of theIndian chemical sector 1939-1945 1950s-1960s 1980s-1990s 1990s-2000s 2000s to date  Foreign drug supplies were decreased, and several Indian pharmaceutical companies were established.  Companies included Unichem, Chemo Pharmaceuticals, Zandu Pharmaceutical Works, Chemical Industrial and Pharmaceutical Laboratories (CIPLA) and East India Pharmaceutical Works.  Indian government established five public-sector companies.  Established Hindustan Antibiotics Ltd. (HAL) in 1954 and Indian Drugs and Pharmaceuticals Ltd. (IDPL) in 1961.  Expansion of the petrochemical industry.  Development of integrated naphtha and gas crackers, along with related downstream plants for polymers, synthetic fibers, aromatics and other chemicals.  Indian players and MNCs collaborated for key investments.  Lower tariff barriers exposed the domestic industry to competitors (from imports).  The chemical industry is expected to contribute US$ 300 billion to India’s GDP by 2025.  Indian chemical companies spend ~1% of their revenue on R&D.  Chemicals contributes 4% to the total FDI equity inflow and ~8% to the country’s exports.  Investments in petrochemicals are driven by growth in end-user segments. Source: KPMG report, News Articles
  • 10.
    10 Key players inthe chemical sector…(1/2) Indian Companies Source: Company website Note: This list is indicative 1 PIDILITE INDUSTRIES LIMITED Adhesives, sealants, waterproofing solutions, construction chemicals, industrial resins, and polymers. 2 TATA CHEMICALS LIMITED Gypsum , soda ash, soda bicarbonate, cement, salt, marine chemicals and crushed refined soda. 3 UNITED PHOSPHORUS LIMITED Crop protection, herbicide, fungicide, insecticide, water conservation, seed treatments, adjuvants, biosolutions and fumigants. 4 GUJARAT FLUOROCHEMICALS LIMITED Caustic soda, special chlorine derivatives, sodium chlorate, caustic potash, chloromethane, phosphoric acid, hydrogen peroxide and water treatment solutions. 5 RELIANCE INDUSTRIES LIMITED Polymers, elastomers, polyesters, aromatics, fibre-intermediates and advanced materials.
  • 11.
    11 Key players inthe chemical sector…(2/2) International Companies Source: Company website Note: This list is indicative 1 BASF INDIA LIMITED Fungicide, herbicide, insecticide, industrial gases, alcohols and aldehydes, glycol ethers, glycol ether acetates and esters. 2 E.I. DU PONT INDIA PRIVATE LIMITED Adhesives, digital printing inks and packaging materials & solutions. 3 MITSUBISHI CHEMICAL INDIA PRIVATE LIMITED Industrial chemicals, basic petrochemicals, solvents and methyl methacrylate monomer & derivatives acrylonitrile & related products. 4 SABIC INDIA PRIVATE LIMITED Aromatics, chlor-alkali, ethanolamines, ethoxylated surfactants, glycols, linear alpha olefins, natural detergent alcohol and olefins. 5 EXXONMOBIL COMPANY INDIA PRIVATE LIMITED Butyl, ethylene propylene diene (EPDM) rubber, polyethylene products, polymer modifiers, polyolefin plastomers & elastomers and polypropylene.
  • 12.
  • 13.
    13 Chemical sector productioncapacity Notes: MT: metric tonnes Source: Department of Chemicals and Petrochemicals 1,910.73 1,694.12 Jan-21 Feb-21 930.68 839.31 Jan-21 Feb-21 Production of Chemicals (‘000 MT) Production of Petrochemicals (‘000 MT)  In February 2021, production of key chemicals was 839,308 MT and petrochemicals was 1,694,120 MT.  In February 2021, production of selected chemicals declined to 9.81% over January 2021, while petrochemicals production declined by 11.33%
  • 14.
    14 Imports and Exportsof Chemicals (US$ million) Source: Department of Chemicals and Petrochemicals, 1,297.24 2,242.53 1,198.40 2,019.82 Apr-20 Apr-21 Import Export Note: Import includes data for both organic and inorganic chemicals and chemicals materials and products; Export data includes only organic and inorganic chemicals Chemical sector import and export statistics  In April 2021, exports of organic and inorganic chemicals increased 68.54% YoY to reach US$ 2,288.30 million.  In April 2021, imports of organic and inorganic chemicals increased 72.87% YoY to reach US$ 2242.53 million.  For petrochemicals, imports of petroleum and crude products decreased 10.6% YoY to reach US$ 9,581.85 million in December 2020.  India holds a strong position in international trading of chemicals and ranks 9th in exports and 6th in imports at a global level (excluding pharmaceuticals).
  • 15.
    15 Source: Ministry ofChemical & Petrochemical Statistics, News Articles Agrochemical Market Segmentation by Pesticides (2018-19)  Globally, India is the fourth-largest producer of agrochemicals after the United States, Japan and China.  The Indian agrochemicals market is expected to register an 8% CAGR to reach US$ 3.7 billion by FY22 and US$ 4.7 billion by FY25.  India is the fourth India is a net exporter of agrochemicals and the thirteenth-largest exporter of pesticides and disinfectants. The country’s exports have increased on the account of low-cost manufacturing, availability of technically trained manpower, seasonal domestic demand, overcapacity, competitive pricing and strong presence in generic pesticide manufacturing  Rise in demand in the agricultural segment is driving growth of agrochemicals in India  In October 2020, the government urged players in the agrochemicals industry to come out with new molecules of global standards for the farmers' benefit, while CropLife India, the industry body, pitched for stable policies and regulatory regimes to boost growth in the sector  The current GST on agrochemical is 18%. In January 2021, CropLife India, an industry body, demanded the government to reduce GST as this will help lower prices of agrochemicals and benefit farmers. Agrochemical trends in India Pesticides and Insecticides Production (MT) 20.86 21.07 21.85 Dec-20 Jan-21 Feb-21 60.0% 18.0% 16.0% 6.0% Insecticides Fungicides Herbicides Others
  • 16.
    16 Note: *for FY20and FY21 Pesticide includes production of Pesticides and Insecticides Source: Ministry of Chemical & Petrochemical Statistics Chemical trends in India  Alkali chemicals accounted for 69.45% of the total chemical production from April to December 2020.  Government initiatives such as promotion of small and midsized ‘Sodium Bicarbonate’ and ‘Ammonia’ processing industries in proximity to soda ash manufacturing units is likely to boost demand for soda ash in the country. Chemical Production in 2015-2021 (MMT) 6,625 6,802 7,009 7,631 8,043 6,436 5,576 944 1,002 1,053 1,058 1,064 815 689 1,619 1,589 1,638 1,799 1,884 1,387 1,365 186 188 214 213 217 146 182 285 304 320 367 382 289 217 - 2,000 4,000 6,000 8,000 10,000 12,000 14,000 FY15 FY16 FY17 FY18 FY19 FY20* (Till Dec 2019) FY21* (Till Dec 2020) Alkali chemicals Inorganic chemicals Organic chemicals Pesticides Dyes & Pigments
  • 17.
    17 Petroleum, chemicals andpetrochemicals investment region (PCPIR) Source: Federation of Indian Chambers of Commerce and Industry, News Articles To promote investments and development in this sector, Indian government approved four PCPIRs Location/Region Dahej Date of Approval Feb. 2009 Total Area 453 Sq. Kms Processing Area 248 Sq. Kms Anchor Tenant ONGC Petro-additional Ltd. Location/Region Paradeep Date of Approval Dec. 2010 Total Area 284.15 Sq. Kms Processing Area 123 Sq. Kms Anchor Tenant Indian Oil Corporation Ltd. Location/Region Cuddalore Date of Approval July 2012 Total Area 257 Sq. Kms Processing Area 104 Sq. Kms Anchor Tenant Nagarjuna Oil Corporation Ltd. Location/Region Vishakhapatnam Date of Approval Feb. 2009 Total Area 604 Sq. Kms Processing Area 270 Sq. Kms Anchor Tenant Hindustan Petroleum Corporation Ltd.  PCPIR in Dahej, Gujarat attracted more investments-compared with the other three cities-wherein various Indian and multinational companies such as ONGC, GACL, OPAL, BASF and LANXESS have opened facilities.  In December 2020, the PCPIR policy is being completely redesigned. Under the new PCPIR Policy 2020-35, it has been targeted to attract a combined investment of Rs. 10 lakh crore (US$ 142 billion) by the year 2025, Rs. 15 lakh crore (US$ 213 billion) by 2030 and Rs. 20 lakh crore (US$ 284 billion) by 2035 in all the PCPIRs across the country.  The four PCPIRs are expected to generate employment for ~33.83 lakh people. ~3.50 lakh persons have been employed in direct and indirect activities related to PCPIRs by the end of 2020.
  • 18.
    18 1 3 2 2. Kanoria Chemicals& Industries Limited  The company’s AlcoChem Ankleshwar Division runs ‘waste to wealth’ programme, which involves treatment of effluent and recycling water by a ‘Reverse Osmosis’ process developed by the company. 1. Tata Chemicals  Tata Chemicals commissioned a solar photo-voltaic plant to save energy.  With an aim to control greenhouse gas emissions, it proposed to establish a 150 kWp grid-connected solar photovoltaic power plant on the rooftop terrace of the electrical sub-station. 3. Arulpuram Common Effluent Treatment Co. Pvt. Ltd.  The company adopted technology to recycle >98% of water and reuse >90% of salt.  The process consisted of a pre- treatment system, followed by water recovery system using reverse osmosis. Indian chemical companies are investing in innovative solutions, focusing on issues such as water, environmental impact, raw materials, safety over lifecycle and energy use Chemical players focusing on sustainable development Source: News Articles
  • 19.
  • 20.
    20 Strong demand andpolicy support driving investments Higher real disposable incomes Shift in production and consumption towards Asian and Southeast Asian countries Shift in consumer preference towards environment-friendly products 100% FDI under the automatic route in the chemical sector, except for hazardous chemicals MSIHC Rules to be merged with CAEPPR to safely handle hazardous chemicals Establishing PCPIRs (investment regions for petroleum, chemicals and petrochemicals) Domestic and overseas companies investing in greenfield or brownfield projects Increase in FDI investments Notes: MSIHC: Manufacture Storage and Import of Hazardous Chemicals, CAEPPR: Chemical Accidents Emergency Planning, Preparedness and Response Source: News Articles Growing demand Policy support Increasing investment Inviting Resulting in
  • 21.
    21 Source: National Councilof Applied Research, World Economic Forum Middle-class Growth in India (million) 63 68 73 78 84 90 97 104 148 0 50 100 150 200 FY18 FY19 FY20 FY21 FY22 FY23 FY24 FY25 FY30 CAGR 7.4% • By 2030, India is likely to have ~80% of the households in the middle-income group. • The growing middle-class and increasing urbanisation is driving the demand for personal care, agrochemicals, food, paints & coatings resulting into higher consumption of chemicals per capita. Rise in domestic demand Manufacturing as % of GDP 14 20 0 5 10 15 20 25 2019 2025E • Government considers the manufacturing sector to be a key focus area and has contacted ~1,450 companies worldwide to manufacture in India. • The government plan includes 2-3 autonomous zones which does not have labor and land laws. • ~300 companies are actively pursuing production plans in mobiles, electronics, medical devices and textiles. Government aims to boost manufacturing share in GDP to 20% by 2025 Key growth drivers…(1/2)
  • 22.
    22 Key growth drivers…(2/2) 1 EMERGINGMANUFACTURING HUBS The dedicated integrated manufacturing hubs under Petroleum, Chemicals and Petrochemicals Investment Regions (PCPIR) policy to attract an investment of Rs. 20 lakh crore (US$ 276.46 billion) by 2035. 2 RISE IN DISINFECTANT DEMAND POST COVID-19 With increasing demand for disinfestation of personal and public places post COVID-19, the chloro-alkali, ethanol, personal care, and surfactant industry is expected to record significant growth in near future. 3 FOREIGN INVESTMENT Presence of prominent global players, such as BASF, Dow Chemicals, Bayer and others, 100% FDI in the chemicals sector and stringent laws on anti-dumping to drive the Indian chemical market. 5 GROWING END USE INDUSTRIES Demand from packaging, construction, automotive and other industries to drive the Indian chemical market. 4 SKILLED AND LOW-COST MANPOWER The skilled and low-cost labour, world-class engineering and strong R&D set-up enable chemicals industries in India.
  • 23.
    23 4.CONSTRUCTION  ‘Smart City’projects by the Indian government are driving growth of chemical companies in India. Availability of essential raw materials at low cost is anticipated to increase demand for construction chemicals. 1. AUTOMOTIVE • Disruption in automotive sector with the emergence of autonomous driving, connected cars, electric vehicles and shared mobility will affect the value chain of Indian chemical companies supplying chemicals to automotive applications. 3. TEXTILE, FLAVOURS & FRAGRANCES  India has witnessed increasing demand for wide range of cosmetic chemicals, health care products and hygiene products that use specialty chemicals, polymers and oleo chemicals. This segment is likely to outperform other segments. 2. WATER TREATMENT  Increasing urbanisation and population is driving the demand for safe drinking water. Moreover, rising awareness of hygiene among the people is leading to excessive water consumption. Source: News Articles Key industries driving growth 1 2 3 4
  • 24.
    24 2 1 Source: Company Websites,News Sources, Recent developments and investments by key players (1/2) Rise in production  HIL (Hindustan Insecticides Limited) signed a memorandum of understanding with the Department of Chemicals & Petro Chemicals to achieve revenue target of Rs. 451 crore (US$ 60.86 million)  In October 2020, HIL manufactured its highest-ever production of >530 tonne of Malathion Technical in the first two quarters of the year. M&As  Pidilite Industries acquired Huntsman Group's Indian subsidiary for Rs. 2,100 crore (US$ 283.38 million) to strengthen its adhesives and sealants portfolio and complement its retail portfolio. 3 Self-reliant in fertilisers  By 2023, India will be self-reliant in fertiliser production and reduce import dependency, by establishing new units covering an investment of Rs.400 billion. At present, Indian fertiliser production stands at 42-45 million tonnes and imports at 18 million tonnes 4 Public-private partnership (PPP) model  Bhoramdev Cooperative Sugar Factory Kawardha and Chhattisgarh Distillery’s subsidiary NKJ Biofuel signed a memorandum of understanding (MoU) for the country's first ethanol plant to be set up in the state under the public-private partnership (PPP) model.
  • 25.
    25 Source: Company Websites,News Sources, Recent developments and investments by key players (2/2) 5 6 Skills and technical support  Central Institute of Petrochemicals Engineering & Technology (CIPET), under the Ministry of Chemicals and Fertilisers, will establish two new ‘Centres for Skilling and Technical Support’ (CSTS) at Bhagalpur, Bihar and Varanasi, Uttar Pradesh. This will act as a catalyst for development and growth of new and existing industries in the region 7 International collaboration  Prince Pipes and Fittings (PPFL) entered into a technical collaboration with Tooling Holland, an international plastic injection moulding industry, based in The Netherlands  Germany headquartered SCHOTT AG, an international specialty glass and technical ceramic materials manufacturer, increases sales in India and plans record investments Sulphonation plant set up  Ultramarine & pigments have successfully commissioned the Sulphonation plant setup in Nellore, Andhra Pradesh, to manufacture surfactants and specialty chemicals.
  • 26.
  • 27.
    27 Specialty chemicals -aggressive capex to drive growth  Specialty chemical companies in India have started accelerating their capex plan on the back of strong growth visibility and emerging opportunities  Due to growing environmental concerns, many chemical companies in China ceased activities in 2018; this led to an increase in manufacturing of specialty chemicals in the Indian market to ensure uninterrupted supply Key growth drivers in the end-user industry for specialty chemicals include the following:  Paints & coatings: Increase in urbanisation, increase in middle-income households, high replacement demand and increase in per capita income.  Textile: Increase in Indian export, increase in urbanisation and higher disposal income.  Construction: Low expenditure on admixtures compared with China and the US.  Home care: Increased consumption. Subsegments User Industries Paints & Coatings Construction, Automotive Special Polymers Packaging Automotive Construction Chemicals Infrastructure, Real Estate Paper Chemicals Printing, Packaging Textile Chemicals Apparel, Technical Textile Water Chemicals Industrial Water, Municipal Water Cosmetic Chemical Bath, Shower, Haircare Flavours & Fragrances Food Processing, Personal Care Agro Chemicals Agriculture, Exports Home Care Surfactants Laundry Care, Dishwashing Colourants Textile, Exports Source: Department of Chemicals and Petrochemicals
  • 28.
    28 Favourable initiatives bygovernment Source: Department of Chemicals and Petrochemicals, 1 A 2034 vision for the chemicals and petrochemicals sector has been set up by the government to explore opportunities to improve domestic production, reduce imports and attract investments in the sector. The government plans to implement production-link incentive system with 10-20% output incentives for the agrochemical sector; to create an end-to-end manufacturing ecosystem through the growth of clusters. 2  100% FDI is allowed in the chemical sector under automatic route with exception to few hazardous chemicals 3  Industrial licensing is approved in most sectors, except for few hazardous chemicals 4  The Indian Government supports the industry in research & development, reduced the basic customs duty on several products and offers support through the ‘Make in India’ campaign 5  Four Petroleum, Chemicals and Petrochemical Investment Regions (PCPIRs) have been set up as the investment regions for petroleum, chemicals and petrochemicals along with associated services
  • 29.
    29 Favourable initiatives bygovernment Source: Department of Chemicals and Petrochemicals, 6 The Government of India is considering launching a production-linked incentive (PLI) scheme in the chemical sector to boost domestic manufacturing and exports.
  • 30.
    30 4. EXPOSURE TO CUTTING-EDGE TECHNOLOGIES •Atul Chemicals, partnered with Akzo Nobel to access state-of-the-art eco-friendly hydrogenation technology for monochloroacetic acid (MCA) production in India. 1. VALUE-CHAIN INTEGRATION • Camlin Fine Sciences acquired Borregaard Italia Spa54, a raw-material catechol manufacture, and Ningbo Wanglong, an end-product vanillin flavour manufacturer • The vertical integration made CFS the third-largest vanillin producer worldwide 2. ALTERNATIVE AND LOW-COST FEEDSTOCK • In November 2020, NextChem, and Indian Oil Corp. Ltd. (IndianOil) signed a memorandum of understanding (MOU) to use NextChem technologies to build industrial projects to support industrialisation of India's sustainable development. • The projects would emphasis on recycling of plastics, production of biofuels from renewable feedstock and circular fuels and non-recyclable waste chemicals. Many Indian chemical companies are focussing on attaining scale to build their margins and enhance environmental sustainability Chemical industry: Exploring new opportunities 1 2 3 4 Source: Company Website, News Articles 3. GLOBAL FOOTPRINT AND CUSTOMER SEGMENTS • Aarti Industries generates >40% revenue from the global markets. • UPL has presence in multiple markets with >30% of its revenue generated from Latin America. • SH Kelkar has completed several strategic acquisitions, including China-based Anhui Ruibang Aroma and Italy’s Creative Flavours and Fragrances; this helped expand its portfolio, improve technological platforms and gain access to new markets.
  • 31.
  • 32.
    32 Key Industry Contacts AgencyContact Information Department of Chemicals & Petrochemicals Dept. of Chemicals & Petrochemicals, Ministry of Chemicals & Fertilisers, 341-(C), A-wing, 3rd floor, Shastri Bhawan, New Delhi-110001 Phone: +91 11 23383428 Fax: +91 11 23073682(F) Email: samir.biswas@gov.in Website: https://chemicals.nic.in Indian Chemical Council Sir Vithaldas Chambers, 6th Floor 16 Mumbai Samachar Marg, MUMBAI - 400 001 Phone: +91 22 61144000 / 22048043 Email: iccmumbai@iccmail.in, events@iccmail.in Website: www.icmaindia.com Dye Manufacturers Association of India A-317, 3rd Floor, Antop Hill Warehousing Complex, Vidyalankar College Road, Near Barkat Ali Naka, Wadala (East), Mumbai - 400 037. India Phone: +91 22 24158156, 24158157 Fax: +91 22 24157374 Email: info@dmai.org Website: http://dmai.org/ Alkali Manufacturers Association of India Alkali Manufacturers Association of India,3rd Floor, Pankaj Chambers, Commercial Complex Preet Vihar, Vikas Marg, Delhi 110092 Phone: +91 11 22432003, 22410150 Fax: +91 11 22468249 Email: hkanand@ama-india.org, info@ama-india.org Website: www.ama-india.org Indian Specialty Chemical Manufacturers' Association 1156, Bole Smruti, Suryavanshi Kshatriya Sabhagriha Marg, Off. Veer Savarkar Marg, Dadar (West), Mumbai - 400 028 Phone: +91 22 2446 5003 Email: info@iscma.in, iscma@email.com Website: www.iscma.in
  • 33.
  • 34.
    34  CAGR: CompoundAnnual Growth Rate  Capex: Capital Expenditure  MMTPA: Million metric tons per annum  CENVAT: Central Value Added Tax  EHTP: Electronic Hardware Technology Park  EPCG: Export Promotion Capital Goods Scheme  FDI: Foreign Direct Investment  FY: Indian Financial Year (April to March); So, FY10 implies April 2009 to March 2010  LCD: Liquid Crystal Display  R&D: Research and Development  US$ : US Dollar  Wherever applicable, numbers have been rounded off to the nearest whole number Glossary
  • 35.
    35 Exchange rates Exchange Rates(Fiscal Year) Exchange Rates (Calendar Year) Year Rs. Equivalent of one US$ 2004-05 44.95 2005-06 44.28 2006-07 45.29 2007-08 40.24 2008-09 45.91 2009-10 47.42 2010-11 45.58 2011-12 47.95 2012-13 54.45 2013-14 60.50 2014-15 61.15 2015-16 65.46 2016-17 67.09 2017-18 64.45 2018-19 69.89 2019-20 70.49 2020-21 73.20 Source: Reserve Bank of India, Average for the year Note: As of April 2021 Year Rs. Equivalent of one US$ 2005 44.11 2006 45.33 2007 41.29 2008 43.42 2009 48.35 2010 45.74 2011 46.67 2012 53.49 2013 58.63 2014 61.03 2015 64.15 2016 67.21 2017 65.12 2018 68.36 2019 69.89 2020 74.18 2021* 74.94
  • 36.
    36 Disclaimer India Brand EquityFoundation (IBEF) engaged Sutherland Global Services private Limited to prepare/update this presentation. All rights reserved. All copyright in this presentation and related works is solely and exclusively owned by IBEF, delivered during the course of engagement under the Professional Service Agreement signed by the Parties. The same may not be reproduced, wholly or in part in any material form (including photocopying or storing it in any medium by electronic means and whether or not transiently or incidentally to some other use of this presentation), modified or in any manner communicated to any third party except with the written approval of IBEF. This presentation is for information purposes only. While due care has been taken during the compilation of this presentation to ensure that the information is accurate to the best of Sutherland Global Services’ Private Limited and IBEF’s knowledge and belief, the content is not to be construed in any manner whatsoever as a substitute for professional advice. Sutherland Global Services Private Limited and IBEF neither recommend nor endorse any specific products or services that may have been mentioned in this presentation and nor do they assume any liability, damages or responsibility for the outcome of decisions taken as a result of any reliance placed on this presentation. Neither Sutherland Global Services Private Limited nor IBEF shall be liable for any special, direct, indirect or consequential damages that may arise due to any act or omission on the part of the user due to any reliance placed or guidance taken from any portion of this presentation.