SlideShare a Scribd company logo
1 of 5
Download to read offline
San José State University
                                                                            One Washington Square
                                                                           San José, CA 95192-0119
                                                                                      408.924.5293
                                                                                 www.sjsu.edu/spri


Dr. Melinda Jackson, Research Director            Melinda.Jackson@sjsu.edu
PLEASE CONTACT FOR FURTHER COMMENT:               Office 408.924.5293   Cell 408.876.8792

RELEASE DATE AND TIME: NOVEMBER 10, 2009 6:00AM

SILICON VALLEY CONSUMER CONFIDENCE REMAINS LOW
CURRENT PERCEPTIONS UP, FUTURE EXPECTATIONS DOWN
SAN JOSE, NOVEMBER 10 – Silicon Valley consumer confidence remains low, with
perceptions of current conditions up while future expectations are down, a new survey
by the Survey and Policy Research Institute at San Jose State University shows.

The Index of Consumer Sentiment, which combines assessments of current conditions
and future expectations for personal finances and business conditions in the country as a
whole, stands at 76.2 among Silicon Valley residents, unchanged from April of this year.
Index numbers below 100 indicate that negative perceptions outweigh positive.

The overall flat line actually reflects two opposing trends. Perceptions of current
economic conditions (CEC Index) rose to 68.6 in October, an increase of 3.8 percentage
points from April. At the same time, expectations for the future, as measured by the
Index of Consumer Expectations (ICE) dropped slightly, falling more than two points to
81.0 in October, from 83.4 in April.

                                         Silicon Valley
                                   Consumer Confidence Indices
                110


                100
  Index value


                 90


                 80


                 70


                 60
                  Se 2


                  Se 03


                  Se 4


                  Se 5


                  Se 6


                  O 7
                  M 3


                  M 4


                  M 5


                  M 6


                  M 7
                       01

                  Ju 2


                  Ja 2


                       03


                  Ja 3


                       04


                       04


                       05


                       05


                       06


                       06


                       07


                       07


                                                                                      9
                                                                                     09
                       0


                       0


                       0


                       0


                       0
                       0


                       0


                       0


                       0


                       0
                       0


                       0


                       0


                                                                                   r0
                     n


                     n


                     n
                     n


                     n


                     n
                     n


                     n


                     n
                     n


                     n
                    p


                    p


                    p


                    p


                    p
                 ec

                   ar


                   ar


                   ar


                   ar


                   ar


                   ar


                    ct


                                                                                  ct
                                                                                 Ap
                  Ju


                  Ju


                  Ju
                  Ju


                  Ju
                  Ja


                  Ja


                  Ja


                                                                                      O
                      M
                D


                          SV ICS             SV CEC               SV ICE

  NOTE: The Index of Consumer Sentiment (ICS) combines consumer perceptions about Current
          Economic Conditions (CEC) and the Index of Consumer Expectations (ICE).
            Index numbers = % positive responses - % negative responses + 100.


                                                 1
MIXED ECONOMIC OUTLOOK

When asked about their current financial situation compared to one year ago, 52% of
Silicon Valley residents said they were worse off today, and just 19% said they were
better off, while 28% volunteered that they were doing about the same. Looking ahead,
33% of respondents said they expected to be better off a year from now, while 49% said
they expected their finances to be about the same, and 10% thought they would be
worse off.

With regard to business conditions in the country as a whole, 33% of Silicon Valley
residents said they expected bad times ahead in the next 12 months, while an equal
number said they expected good times. Long-term expectations were slightly more
optimistic, with 37% saying they thought the country would see good economic times
during the next five years, and 33% saying they expected to see widespread
unemployment and depression.

Current buying conditions were judged to be good by 42% of those in the Valley, while
32% thought it was a bad time to buy major household items.

Comparing the current ratings to SPRI’s last survey in April, expectations of personal
finances one year from now, and the long-term business outlook both dropped, while
ratings of current buying conditions, short-term business conditions, and personal
finances versus one year ago improved.

“People are expressing mixed feelings about the economy right now” said Survey and
Policy Research Institute Research Director Dr. Melinda Jackson, “While they may feel
that the worst is behind us, they’re still not expecting to see good times again for a
while.”

                                           Silicon Valley Consumer Confidence
                                                      Index Variables
                   160
                   150
                   140
                   130
     Index Value


                   120
                   110
                   100
                    90
                    80
                    70
                    60
                    50
                    40
                   Ju 4


                   Ju 5


                   Ju 6


                   Ju 7


                                                                                      O 9
                   M 04


                   Se 04

                   Ja 4
                   M 05


                   Se 05

                   Ja 5
                   M 06


                   Se 06
                   Ja 6
                   M 07


                   O 7
                        07


                                                                                          09
                        0


                        0


                        0


                        0


                                                                                         r0
                        0


                        0


                        0


                        0
                    ar


                    ar


                    ar


                    ar
                      n


                      n
                      p
                      n


                      n
                      p
                      n


                      n
                      p
                      n


                      n
                     ct


                                                                                       ct
                                                                                      Ap
                   Ja


                         Personal Finances vs. 1 year ago           Personal Finances 1 year from now
                         Business Conditions - Next 12 months       Five year outlook
                         Buying Conditions - Durables

                   Index numbers = % positive responses - % negative responses + 100.


                                                                2
SERIOUS RECESSION EXPECTED TO LAST MORE THAN A YEAR

SPRI also asked respondents if they believed California is in an economic recession –
92% said yes. Overall, 58% of Silicon Valley residents said they think California is in a
serious recession, 27% said it is a moderate recession, and 8% considered it a mild
recession.

When asked how long they think the economic recession will last, just 8% of Silicon
Valley residents said less than one year, 47% said 1-2 years, 34% said 3-5 years, and
7% said more than five years.

FEARS OF UNEMPLOYMENT LESSEN

Forty percent of Silicon Valley residents said that they are concerned that they or
someone in their family will lose their job in the next year. Another 10% reported that
they have already lost their job. Forty-six percent of those surveyed said that they were
not concerned about someone in their household losing a job.

This represents an easing of unemployment fears compared to six months ago when
49% of Silicon Valley residents expressed concern about job loss, and only 37% were
unconcerned.

SILICON VALLEY CONSUMER CONFIDENCE HIGHER THAN US

Despite the gloomy picture in the region, Silicon Valley consumer confidence remains
higher than in the country as a whole. The national Index of Consumer Sentiment stood
at 70.6 in October, as measured by the University of Michigan’s Survey of Consumers.
The same Index of Consumer Sentiment stood at 76.2 among Valley residents, 5.6 points
higher than the national index.

  Index            Consumer Sentiment     Current Economic Conditions    Consumer Expectations
                           (ICS)                     (CEC)                         (ICE)
  2009              April 09     Oct 09     April 09        Oct 09        April 09       Oct 09
  Silicon Valley     76.2         76.2        64.8           68.6          83.4           81.0
  CA                 73.8          --         66.3            --           78.6            --
  US                 57.3         70.6        63.3           73.7          53.5           68.6


BUSINESS CONDITIONS IN SILICON VALLEY

Silicon Valley residents were also asked about business conditions in Silicon Valley
specifically. Current business conditions in Silicon Valley were seen as worse compared
to a year ago by 59% of residents, while 28% thought they were better compared to last
fall. Looking ahead, 38% of Silicon Valley residents expected the region’s economy to
improve over the next 12 months, while 30% thought the bad economic times would
continue, and 25% thought it would be mixed.

Looking ahead to one year from now, expectations are higher, with 49% of Silicon Valley
residents saying they expect business conditions in the Valley to be better than now,
40% expecting them to be about the same, and just 8% saying they thought they would
be worse. All three of these judgments represent an improvement over six months ago.


                                                  3
Silicon Valley Business Conditions


 150

 100

   50

    0
   Ju 0 3
   Ju 02


   Ju 04


   Ju 05


   Ju 06


   Ju 07
   M 02


   S e 02


   S e 03


   M 04


   S e 04


   M 05


   S e 05


   M 06


   S e 06


   M 07


   O 07
         07


   O 09
         09
   D 02
   M 02


   Ja 0 3


   Ja 0 4


   Ja 0 5


   Ja 0 6
     ar


     ar


     ar


     ar


     ar


      ct


      ct
       r
      n


      n

     ec


      n


      n


      n


      n


      n


      n


      n


      n


      n
      p


      p


      p


      p


      p
    ar


   Ap
   Ja


                                    SV-Economic conditions next 12 months
                                    SV-Business conditions vs. 1 year ago
                                    SV-Business conditions 1 year from now


ABOUT THE SURVEY
The Survey and Policy Research Institute at San José State University conducted the Fall 2009
Silicon Valley Pulse Survey September 29 – October 7, 2009. This telephone survey of 765
Silicon Valley adults was conducted in English and Spanish, and included questions on several
different topics including consumer attitudes, charitable giving, and state and local political
issues.

Some telephone numbers included in this sample were randomly generated by computer to
ensure that both listed and unlisted numbers were included, from all landline exchanges in Silicon
Valley; others were randomly selected from the list of registered voters in Santa Clara County.
Telephone numbers in the survey sample were called up to four times at different times and days
to increase the likelihood of reaching eligible households.

The sampling error for the total sample is plus or minus 3.54 percentage points at the 95%
confidence level. Results were statistically weighted by race and gender to match recent U.S.
Census estimates of the Silicon Valley population.

Silicon Valley is defined as all of Santa Clara and San Mateo Counties, plus Fremont, Newark, and
Union City in Alameda County, and Scotts Valley in Santa Cruz County. This follows the
geographic definition of Silicon Valley used by Joint Venture Silicon Valley in their annual Silicon
Valley Index.


Contact:        Dr. Melinda Jackson, SPRI Research Director
                408.924.5293
                Melinda.Jackson@sjsu.edu


                                                  4
SPRI FALL 2009 SILICON VALLEY PULSE
CONSUMER CONFIDENCE SURVEY QUESTIONS                    SILICON VALLEY/CALIFORNIA ECONOMY QUESTIONS:

CURRENT ECONOMIC CONDITIONS INDEX (CEC):                6. Thinking now about Silicon Valley specifically,
                                                        do you think that during the next 12 months we'll
1. We are interested in how people are getting          have good times financially, or bad times, or
along financially these days. Would you say that        what?
you (and your family living there) are better off                                  April 09 Oct 09
or worse off financially than you were a year             Good                       26%      38%
ago?                                                      Good and bad (vol.)        22       25
                            April 09 Oct 09               Bad                        43       30
  Better off                  17%     19%                 Don't know                  9        6
  Same (volunteered)          25      28
  Worse off                   55      52                7. Would you say that at the present time,
  Don't know                   2       1                business conditions in Silicon Valley are better or
                                                        worse than they were a year ago?
2. About the big things people buy for their                                         April 09 Oct 09
homes - such as furniture, a refrigerator, stove,         Better Now                   8%      28%
television, and things like that. Generally               Same (vol.)                  6        9
speaking do you think now is a good or bad time           Worse Now                   78       59
for people to buy major household items?                  Don't know                   6        4
                             April 09 Oct 09
   Good                        39%     42%              8. How about a year from now? Do you expect
   Good and Bad (vol.)         15      17               that business conditions in Silicon Valley will be
   Bad                         36      32               better or worse than they are at present, or just
   Don't know                  10      8                about the same?
                                                                                    April 09 Oct 09
INDEX OF CONSUMER EXPECTATIONS (ICE) QUESTIONS:           Better than now            43%        49%
                                                          Same                       32         40
3. Now looking ahead - do you think that a year           Worse than now             14          8
from now you (and your family living there) will          Don't know                   4         2
be better off financially, or worse off, or just
about the same as now?                                  9. Would you say that California is in an
                              April 09 Oct 09           economic recession, or not? [If yes: Do you
   Better off                  43%       33%            think it is in a serious, a moderate, or a mild
   Same as now                 39        49             recession?]
   Worse off                   11        10                                      April 09 Oct 09
   Don't know                   7         8               Yes, serious recession  55%      58%
                                                          Yes, moderate recession 30       27
4. Now turning to business conditions in the              Yes, mild recession      6        8
country as a whole - do you think that during the         No                       8        5
next 12 months we'll have good times financially,         Don’t know               1        3
or bad times, or what?
                           April 09 Oct 09              10. How long do you think the economic
  Good Times                34%      33%                recession will last? [if yes to Q9]
  Good and Bad (vol.)       19       28                                               April 09 Oct 09
  Bad Times                 41       33                   Less than one year           14%      8%
  Don't know                 6        6                   1-2 years                    45      47
                                                          3-5 years                    29      34
5. Looking ahead, which would you say is more             More than 5 years             9       7
likely: that in the country as a whole we'll have         Don’t know                    4       5
continuous good times during the next five years
or so, or that we will have periods of widespread       11. Are you concerned that you or someone in
unemployment or depression, or what?                    your family will lose their job in the next year, or
                                April09 Oct09           not? [If yes: Are you very concerned or
   Continuous good times          47%     37%           somewhat concerned about this?]
   Stay about the same (vol.)     11      20                                        April 09   Oct09
   Widespread unemployment                                Yes, very concerned          28%      19%
     or depression                 37     33              Yes, somewhat concerned 21            21
   Don't know                       6      9              No                           37       46
                                                          Have lost job already (vol.) 11       10
                                                          Don’t know                    1        3


                                                    5

More Related Content

Similar to Sv Pulse Consumer Confidence Fall 2009

NAIS Building School Websites Around Participation
NAIS Building School Websites Around ParticipationNAIS Building School Websites Around Participation
NAIS Building School Websites Around ParticipationWhippleHill
 
Mortgage Delinquencies: I Quarter 2011
Mortgage Delinquencies: I Quarter 2011Mortgage Delinquencies: I Quarter 2011
Mortgage Delinquencies: I Quarter 2011REALTORS
 
Depot wise abnormal losses
Depot wise abnormal lossesDepot wise abnormal losses
Depot wise abnormal lossesmaverick4300
 
Mortgage Delinquencies
Mortgage DelinquenciesMortgage Delinquencies
Mortgage DelinquenciesNAR Research
 
1.2 from gaun yersel to older and better joint improvement team
1.2 from gaun yersel to older and better   joint improvement team1.2 from gaun yersel to older and better   joint improvement team
1.2 from gaun yersel to older and better joint improvement teamPublicSectorConference
 
Examining the Blueprint for Surface Transportation Investment and Reform
Examining the Blueprint for Surface Transportation Investment and ReformExamining the Blueprint for Surface Transportation Investment and Reform
Examining the Blueprint for Surface Transportation Investment and ReformAASHTO
 
Learning analytics UCSF Keynote
Learning analytics UCSF KeynoteLearning analytics UCSF Keynote
Learning analytics UCSF KeynoteJanet Corral
 

Similar to Sv Pulse Consumer Confidence Fall 2009 (9)

NAIS Building School Websites Around Participation
NAIS Building School Websites Around ParticipationNAIS Building School Websites Around Participation
NAIS Building School Websites Around Participation
 
July 2011 Economic Barometer
July 2011 Economic BarometerJuly 2011 Economic Barometer
July 2011 Economic Barometer
 
Mortgage Delinquencies: I Quarter 2011
Mortgage Delinquencies: I Quarter 2011Mortgage Delinquencies: I Quarter 2011
Mortgage Delinquencies: I Quarter 2011
 
Depot wise abnormal losses
Depot wise abnormal lossesDepot wise abnormal losses
Depot wise abnormal losses
 
Mortgage Delinquencies
Mortgage DelinquenciesMortgage Delinquencies
Mortgage Delinquencies
 
1.2 from gaun yersel to older and better joint improvement team
1.2 from gaun yersel to older and better   joint improvement team1.2 from gaun yersel to older and better   joint improvement team
1.2 from gaun yersel to older and better joint improvement team
 
Examining the Blueprint for Surface Transportation Investment and Reform
Examining the Blueprint for Surface Transportation Investment and ReformExamining the Blueprint for Surface Transportation Investment and Reform
Examining the Blueprint for Surface Transportation Investment and Reform
 
Learning analytics UCSF Keynote
Learning analytics UCSF KeynoteLearning analytics UCSF Keynote
Learning analytics UCSF Keynote
 
Workforce Statewide Presentation 2012
Workforce Statewide Presentation 2012Workforce Statewide Presentation 2012
Workforce Statewide Presentation 2012
 

Recently uploaded

Russian Call Girls in Andheri Airport Mumbai WhatsApp 9167673311 💞 Full Nigh...
Russian Call Girls in Andheri Airport Mumbai WhatsApp  9167673311 💞 Full Nigh...Russian Call Girls in Andheri Airport Mumbai WhatsApp  9167673311 💞 Full Nigh...
Russian Call Girls in Andheri Airport Mumbai WhatsApp 9167673311 💞 Full Nigh...Pooja Nehwal
 
Separation of Lanthanides/ Lanthanides and Actinides
Separation of Lanthanides/ Lanthanides and ActinidesSeparation of Lanthanides/ Lanthanides and Actinides
Separation of Lanthanides/ Lanthanides and ActinidesFatimaKhan178732
 
Web & Social Media Analytics Previous Year Question Paper.pdf
Web & Social Media Analytics Previous Year Question Paper.pdfWeb & Social Media Analytics Previous Year Question Paper.pdf
Web & Social Media Analytics Previous Year Question Paper.pdfJayanti Pande
 
Z Score,T Score, Percential Rank and Box Plot Graph
Z Score,T Score, Percential Rank and Box Plot GraphZ Score,T Score, Percential Rank and Box Plot Graph
Z Score,T Score, Percential Rank and Box Plot GraphThiyagu K
 
Software Engineering Methodologies (overview)
Software Engineering Methodologies (overview)Software Engineering Methodologies (overview)
Software Engineering Methodologies (overview)eniolaolutunde
 
Ecosystem Interactions Class Discussion Presentation in Blue Green Lined Styl...
Ecosystem Interactions Class Discussion Presentation in Blue Green Lined Styl...Ecosystem Interactions Class Discussion Presentation in Blue Green Lined Styl...
Ecosystem Interactions Class Discussion Presentation in Blue Green Lined Styl...fonyou31
 
Q4-W6-Restating Informational Text Grade 3
Q4-W6-Restating Informational Text Grade 3Q4-W6-Restating Informational Text Grade 3
Q4-W6-Restating Informational Text Grade 3JemimahLaneBuaron
 
Organic Name Reactions for the students and aspirants of Chemistry12th.pptx
Organic Name Reactions  for the students and aspirants of Chemistry12th.pptxOrganic Name Reactions  for the students and aspirants of Chemistry12th.pptx
Organic Name Reactions for the students and aspirants of Chemistry12th.pptxVS Mahajan Coaching Centre
 
BAG TECHNIQUE Bag technique-a tool making use of public health bag through wh...
BAG TECHNIQUE Bag technique-a tool making use of public health bag through wh...BAG TECHNIQUE Bag technique-a tool making use of public health bag through wh...
BAG TECHNIQUE Bag technique-a tool making use of public health bag through wh...Sapna Thakur
 
JAPAN: ORGANISATION OF PMDA, PHARMACEUTICAL LAWS & REGULATIONS, TYPES OF REGI...
JAPAN: ORGANISATION OF PMDA, PHARMACEUTICAL LAWS & REGULATIONS, TYPES OF REGI...JAPAN: ORGANISATION OF PMDA, PHARMACEUTICAL LAWS & REGULATIONS, TYPES OF REGI...
JAPAN: ORGANISATION OF PMDA, PHARMACEUTICAL LAWS & REGULATIONS, TYPES OF REGI...anjaliyadav012327
 
POINT- BIOCHEMISTRY SEM 2 ENZYMES UNIT 5.pptx
POINT- BIOCHEMISTRY SEM 2 ENZYMES UNIT 5.pptxPOINT- BIOCHEMISTRY SEM 2 ENZYMES UNIT 5.pptx
POINT- BIOCHEMISTRY SEM 2 ENZYMES UNIT 5.pptxSayali Powar
 
Mastering the Unannounced Regulatory Inspection
Mastering the Unannounced Regulatory InspectionMastering the Unannounced Regulatory Inspection
Mastering the Unannounced Regulatory InspectionSafetyChain Software
 
APM Welcome, APM North West Network Conference, Synergies Across Sectors
APM Welcome, APM North West Network Conference, Synergies Across SectorsAPM Welcome, APM North West Network Conference, Synergies Across Sectors
APM Welcome, APM North West Network Conference, Synergies Across SectorsAssociation for Project Management
 
Sanyam Choudhary Chemistry practical.pdf
Sanyam Choudhary Chemistry practical.pdfSanyam Choudhary Chemistry practical.pdf
Sanyam Choudhary Chemistry practical.pdfsanyamsingh5019
 
Beyond the EU: DORA and NIS 2 Directive's Global Impact
Beyond the EU: DORA and NIS 2 Directive's Global ImpactBeyond the EU: DORA and NIS 2 Directive's Global Impact
Beyond the EU: DORA and NIS 2 Directive's Global ImpactPECB
 
1029-Danh muc Sach Giao Khoa khoi 6.pdf
1029-Danh muc Sach Giao Khoa khoi  6.pdf1029-Danh muc Sach Giao Khoa khoi  6.pdf
1029-Danh muc Sach Giao Khoa khoi 6.pdfQucHHunhnh
 
CARE OF CHILD IN INCUBATOR..........pptx
CARE OF CHILD IN INCUBATOR..........pptxCARE OF CHILD IN INCUBATOR..........pptx
CARE OF CHILD IN INCUBATOR..........pptxGaneshChakor2
 
Disha NEET Physics Guide for classes 11 and 12.pdf
Disha NEET Physics Guide for classes 11 and 12.pdfDisha NEET Physics Guide for classes 11 and 12.pdf
Disha NEET Physics Guide for classes 11 and 12.pdfchloefrazer622
 
Accessible design: Minimum effort, maximum impact
Accessible design: Minimum effort, maximum impactAccessible design: Minimum effort, maximum impact
Accessible design: Minimum effort, maximum impactdawncurless
 

Recently uploaded (20)

Russian Call Girls in Andheri Airport Mumbai WhatsApp 9167673311 💞 Full Nigh...
Russian Call Girls in Andheri Airport Mumbai WhatsApp  9167673311 💞 Full Nigh...Russian Call Girls in Andheri Airport Mumbai WhatsApp  9167673311 💞 Full Nigh...
Russian Call Girls in Andheri Airport Mumbai WhatsApp 9167673311 💞 Full Nigh...
 
Separation of Lanthanides/ Lanthanides and Actinides
Separation of Lanthanides/ Lanthanides and ActinidesSeparation of Lanthanides/ Lanthanides and Actinides
Separation of Lanthanides/ Lanthanides and Actinides
 
Web & Social Media Analytics Previous Year Question Paper.pdf
Web & Social Media Analytics Previous Year Question Paper.pdfWeb & Social Media Analytics Previous Year Question Paper.pdf
Web & Social Media Analytics Previous Year Question Paper.pdf
 
Z Score,T Score, Percential Rank and Box Plot Graph
Z Score,T Score, Percential Rank and Box Plot GraphZ Score,T Score, Percential Rank and Box Plot Graph
Z Score,T Score, Percential Rank and Box Plot Graph
 
Mattingly "AI & Prompt Design: The Basics of Prompt Design"
Mattingly "AI & Prompt Design: The Basics of Prompt Design"Mattingly "AI & Prompt Design: The Basics of Prompt Design"
Mattingly "AI & Prompt Design: The Basics of Prompt Design"
 
Software Engineering Methodologies (overview)
Software Engineering Methodologies (overview)Software Engineering Methodologies (overview)
Software Engineering Methodologies (overview)
 
Ecosystem Interactions Class Discussion Presentation in Blue Green Lined Styl...
Ecosystem Interactions Class Discussion Presentation in Blue Green Lined Styl...Ecosystem Interactions Class Discussion Presentation in Blue Green Lined Styl...
Ecosystem Interactions Class Discussion Presentation in Blue Green Lined Styl...
 
Q4-W6-Restating Informational Text Grade 3
Q4-W6-Restating Informational Text Grade 3Q4-W6-Restating Informational Text Grade 3
Q4-W6-Restating Informational Text Grade 3
 
Organic Name Reactions for the students and aspirants of Chemistry12th.pptx
Organic Name Reactions  for the students and aspirants of Chemistry12th.pptxOrganic Name Reactions  for the students and aspirants of Chemistry12th.pptx
Organic Name Reactions for the students and aspirants of Chemistry12th.pptx
 
BAG TECHNIQUE Bag technique-a tool making use of public health bag through wh...
BAG TECHNIQUE Bag technique-a tool making use of public health bag through wh...BAG TECHNIQUE Bag technique-a tool making use of public health bag through wh...
BAG TECHNIQUE Bag technique-a tool making use of public health bag through wh...
 
JAPAN: ORGANISATION OF PMDA, PHARMACEUTICAL LAWS & REGULATIONS, TYPES OF REGI...
JAPAN: ORGANISATION OF PMDA, PHARMACEUTICAL LAWS & REGULATIONS, TYPES OF REGI...JAPAN: ORGANISATION OF PMDA, PHARMACEUTICAL LAWS & REGULATIONS, TYPES OF REGI...
JAPAN: ORGANISATION OF PMDA, PHARMACEUTICAL LAWS & REGULATIONS, TYPES OF REGI...
 
POINT- BIOCHEMISTRY SEM 2 ENZYMES UNIT 5.pptx
POINT- BIOCHEMISTRY SEM 2 ENZYMES UNIT 5.pptxPOINT- BIOCHEMISTRY SEM 2 ENZYMES UNIT 5.pptx
POINT- BIOCHEMISTRY SEM 2 ENZYMES UNIT 5.pptx
 
Mastering the Unannounced Regulatory Inspection
Mastering the Unannounced Regulatory InspectionMastering the Unannounced Regulatory Inspection
Mastering the Unannounced Regulatory Inspection
 
APM Welcome, APM North West Network Conference, Synergies Across Sectors
APM Welcome, APM North West Network Conference, Synergies Across SectorsAPM Welcome, APM North West Network Conference, Synergies Across Sectors
APM Welcome, APM North West Network Conference, Synergies Across Sectors
 
Sanyam Choudhary Chemistry practical.pdf
Sanyam Choudhary Chemistry practical.pdfSanyam Choudhary Chemistry practical.pdf
Sanyam Choudhary Chemistry practical.pdf
 
Beyond the EU: DORA and NIS 2 Directive's Global Impact
Beyond the EU: DORA and NIS 2 Directive's Global ImpactBeyond the EU: DORA and NIS 2 Directive's Global Impact
Beyond the EU: DORA and NIS 2 Directive's Global Impact
 
1029-Danh muc Sach Giao Khoa khoi 6.pdf
1029-Danh muc Sach Giao Khoa khoi  6.pdf1029-Danh muc Sach Giao Khoa khoi  6.pdf
1029-Danh muc Sach Giao Khoa khoi 6.pdf
 
CARE OF CHILD IN INCUBATOR..........pptx
CARE OF CHILD IN INCUBATOR..........pptxCARE OF CHILD IN INCUBATOR..........pptx
CARE OF CHILD IN INCUBATOR..........pptx
 
Disha NEET Physics Guide for classes 11 and 12.pdf
Disha NEET Physics Guide for classes 11 and 12.pdfDisha NEET Physics Guide for classes 11 and 12.pdf
Disha NEET Physics Guide for classes 11 and 12.pdf
 
Accessible design: Minimum effort, maximum impact
Accessible design: Minimum effort, maximum impactAccessible design: Minimum effort, maximum impact
Accessible design: Minimum effort, maximum impact
 

Sv Pulse Consumer Confidence Fall 2009

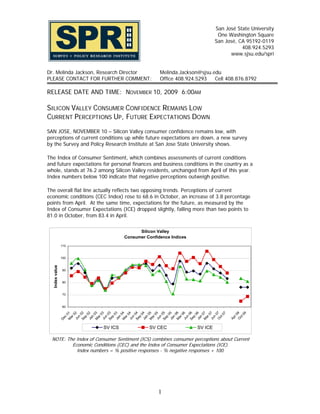
  • 1. San José State University One Washington Square San José, CA 95192-0119 408.924.5293 www.sjsu.edu/spri Dr. Melinda Jackson, Research Director Melinda.Jackson@sjsu.edu PLEASE CONTACT FOR FURTHER COMMENT: Office 408.924.5293 Cell 408.876.8792 RELEASE DATE AND TIME: NOVEMBER 10, 2009 6:00AM SILICON VALLEY CONSUMER CONFIDENCE REMAINS LOW CURRENT PERCEPTIONS UP, FUTURE EXPECTATIONS DOWN SAN JOSE, NOVEMBER 10 – Silicon Valley consumer confidence remains low, with perceptions of current conditions up while future expectations are down, a new survey by the Survey and Policy Research Institute at San Jose State University shows. The Index of Consumer Sentiment, which combines assessments of current conditions and future expectations for personal finances and business conditions in the country as a whole, stands at 76.2 among Silicon Valley residents, unchanged from April of this year. Index numbers below 100 indicate that negative perceptions outweigh positive. The overall flat line actually reflects two opposing trends. Perceptions of current economic conditions (CEC Index) rose to 68.6 in October, an increase of 3.8 percentage points from April. At the same time, expectations for the future, as measured by the Index of Consumer Expectations (ICE) dropped slightly, falling more than two points to 81.0 in October, from 83.4 in April. Silicon Valley Consumer Confidence Indices 110 100 Index value 90 80 70 60 Se 2 Se 03 Se 4 Se 5 Se 6 O 7 M 3 M 4 M 5 M 6 M 7 01 Ju 2 Ja 2 03 Ja 3 04 04 05 05 06 06 07 07 9 09 0 0 0 0 0 0 0 0 0 0 0 0 0 r0 n n n n n n n n n n n p p p p p ec ar ar ar ar ar ar ct ct Ap Ju Ju Ju Ju Ju Ja Ja Ja O M D SV ICS SV CEC SV ICE NOTE: The Index of Consumer Sentiment (ICS) combines consumer perceptions about Current Economic Conditions (CEC) and the Index of Consumer Expectations (ICE). Index numbers = % positive responses - % negative responses + 100. 1
  • 2. MIXED ECONOMIC OUTLOOK When asked about their current financial situation compared to one year ago, 52% of Silicon Valley residents said they were worse off today, and just 19% said they were better off, while 28% volunteered that they were doing about the same. Looking ahead, 33% of respondents said they expected to be better off a year from now, while 49% said they expected their finances to be about the same, and 10% thought they would be worse off. With regard to business conditions in the country as a whole, 33% of Silicon Valley residents said they expected bad times ahead in the next 12 months, while an equal number said they expected good times. Long-term expectations were slightly more optimistic, with 37% saying they thought the country would see good economic times during the next five years, and 33% saying they expected to see widespread unemployment and depression. Current buying conditions were judged to be good by 42% of those in the Valley, while 32% thought it was a bad time to buy major household items. Comparing the current ratings to SPRI’s last survey in April, expectations of personal finances one year from now, and the long-term business outlook both dropped, while ratings of current buying conditions, short-term business conditions, and personal finances versus one year ago improved. “People are expressing mixed feelings about the economy right now” said Survey and Policy Research Institute Research Director Dr. Melinda Jackson, “While they may feel that the worst is behind us, they’re still not expecting to see good times again for a while.” Silicon Valley Consumer Confidence Index Variables 160 150 140 130 Index Value 120 110 100 90 80 70 60 50 40 Ju 4 Ju 5 Ju 6 Ju 7 O 9 M 04 Se 04 Ja 4 M 05 Se 05 Ja 5 M 06 Se 06 Ja 6 M 07 O 7 07 09 0 0 0 0 r0 0 0 0 0 ar ar ar ar n n p n n p n n p n n ct ct Ap Ja Personal Finances vs. 1 year ago Personal Finances 1 year from now Business Conditions - Next 12 months Five year outlook Buying Conditions - Durables Index numbers = % positive responses - % negative responses + 100. 2
  • 3. SERIOUS RECESSION EXPECTED TO LAST MORE THAN A YEAR SPRI also asked respondents if they believed California is in an economic recession – 92% said yes. Overall, 58% of Silicon Valley residents said they think California is in a serious recession, 27% said it is a moderate recession, and 8% considered it a mild recession. When asked how long they think the economic recession will last, just 8% of Silicon Valley residents said less than one year, 47% said 1-2 years, 34% said 3-5 years, and 7% said more than five years. FEARS OF UNEMPLOYMENT LESSEN Forty percent of Silicon Valley residents said that they are concerned that they or someone in their family will lose their job in the next year. Another 10% reported that they have already lost their job. Forty-six percent of those surveyed said that they were not concerned about someone in their household losing a job. This represents an easing of unemployment fears compared to six months ago when 49% of Silicon Valley residents expressed concern about job loss, and only 37% were unconcerned. SILICON VALLEY CONSUMER CONFIDENCE HIGHER THAN US Despite the gloomy picture in the region, Silicon Valley consumer confidence remains higher than in the country as a whole. The national Index of Consumer Sentiment stood at 70.6 in October, as measured by the University of Michigan’s Survey of Consumers. The same Index of Consumer Sentiment stood at 76.2 among Valley residents, 5.6 points higher than the national index. Index Consumer Sentiment Current Economic Conditions Consumer Expectations (ICS) (CEC) (ICE) 2009 April 09 Oct 09 April 09 Oct 09 April 09 Oct 09 Silicon Valley 76.2 76.2 64.8 68.6 83.4 81.0 CA 73.8 -- 66.3 -- 78.6 -- US 57.3 70.6 63.3 73.7 53.5 68.6 BUSINESS CONDITIONS IN SILICON VALLEY Silicon Valley residents were also asked about business conditions in Silicon Valley specifically. Current business conditions in Silicon Valley were seen as worse compared to a year ago by 59% of residents, while 28% thought they were better compared to last fall. Looking ahead, 38% of Silicon Valley residents expected the region’s economy to improve over the next 12 months, while 30% thought the bad economic times would continue, and 25% thought it would be mixed. Looking ahead to one year from now, expectations are higher, with 49% of Silicon Valley residents saying they expect business conditions in the Valley to be better than now, 40% expecting them to be about the same, and just 8% saying they thought they would be worse. All three of these judgments represent an improvement over six months ago. 3
  • 4. Silicon Valley Business Conditions 150 100 50 0 Ju 0 3 Ju 02 Ju 04 Ju 05 Ju 06 Ju 07 M 02 S e 02 S e 03 M 04 S e 04 M 05 S e 05 M 06 S e 06 M 07 O 07 07 O 09 09 D 02 M 02 Ja 0 3 Ja 0 4 Ja 0 5 Ja 0 6 ar ar ar ar ar ct ct r n n ec n n n n n n n n n p p p p p ar Ap Ja SV-Economic conditions next 12 months SV-Business conditions vs. 1 year ago SV-Business conditions 1 year from now ABOUT THE SURVEY The Survey and Policy Research Institute at San José State University conducted the Fall 2009 Silicon Valley Pulse Survey September 29 – October 7, 2009. This telephone survey of 765 Silicon Valley adults was conducted in English and Spanish, and included questions on several different topics including consumer attitudes, charitable giving, and state and local political issues. Some telephone numbers included in this sample were randomly generated by computer to ensure that both listed and unlisted numbers were included, from all landline exchanges in Silicon Valley; others were randomly selected from the list of registered voters in Santa Clara County. Telephone numbers in the survey sample were called up to four times at different times and days to increase the likelihood of reaching eligible households. The sampling error for the total sample is plus or minus 3.54 percentage points at the 95% confidence level. Results were statistically weighted by race and gender to match recent U.S. Census estimates of the Silicon Valley population. Silicon Valley is defined as all of Santa Clara and San Mateo Counties, plus Fremont, Newark, and Union City in Alameda County, and Scotts Valley in Santa Cruz County. This follows the geographic definition of Silicon Valley used by Joint Venture Silicon Valley in their annual Silicon Valley Index. Contact: Dr. Melinda Jackson, SPRI Research Director 408.924.5293 Melinda.Jackson@sjsu.edu 4
  • 5. SPRI FALL 2009 SILICON VALLEY PULSE CONSUMER CONFIDENCE SURVEY QUESTIONS SILICON VALLEY/CALIFORNIA ECONOMY QUESTIONS: CURRENT ECONOMIC CONDITIONS INDEX (CEC): 6. Thinking now about Silicon Valley specifically, do you think that during the next 12 months we'll 1. We are interested in how people are getting have good times financially, or bad times, or along financially these days. Would you say that what? you (and your family living there) are better off April 09 Oct 09 or worse off financially than you were a year Good 26% 38% ago? Good and bad (vol.) 22 25 April 09 Oct 09 Bad 43 30 Better off 17% 19% Don't know 9 6 Same (volunteered) 25 28 Worse off 55 52 7. Would you say that at the present time, Don't know 2 1 business conditions in Silicon Valley are better or worse than they were a year ago? 2. About the big things people buy for their April 09 Oct 09 homes - such as furniture, a refrigerator, stove, Better Now 8% 28% television, and things like that. Generally Same (vol.) 6 9 speaking do you think now is a good or bad time Worse Now 78 59 for people to buy major household items? Don't know 6 4 April 09 Oct 09 Good 39% 42% 8. How about a year from now? Do you expect Good and Bad (vol.) 15 17 that business conditions in Silicon Valley will be Bad 36 32 better or worse than they are at present, or just Don't know 10 8 about the same? April 09 Oct 09 INDEX OF CONSUMER EXPECTATIONS (ICE) QUESTIONS: Better than now 43% 49% Same 32 40 3. Now looking ahead - do you think that a year Worse than now 14 8 from now you (and your family living there) will Don't know 4 2 be better off financially, or worse off, or just about the same as now? 9. Would you say that California is in an April 09 Oct 09 economic recession, or not? [If yes: Do you Better off 43% 33% think it is in a serious, a moderate, or a mild Same as now 39 49 recession?] Worse off 11 10 April 09 Oct 09 Don't know 7 8 Yes, serious recession 55% 58% Yes, moderate recession 30 27 4. Now turning to business conditions in the Yes, mild recession 6 8 country as a whole - do you think that during the No 8 5 next 12 months we'll have good times financially, Don’t know 1 3 or bad times, or what? April 09 Oct 09 10. How long do you think the economic Good Times 34% 33% recession will last? [if yes to Q9] Good and Bad (vol.) 19 28 April 09 Oct 09 Bad Times 41 33 Less than one year 14% 8% Don't know 6 6 1-2 years 45 47 3-5 years 29 34 5. Looking ahead, which would you say is more More than 5 years 9 7 likely: that in the country as a whole we'll have Don’t know 4 5 continuous good times during the next five years or so, or that we will have periods of widespread 11. Are you concerned that you or someone in unemployment or depression, or what? your family will lose their job in the next year, or April09 Oct09 not? [If yes: Are you very concerned or Continuous good times 47% 37% somewhat concerned about this?] Stay about the same (vol.) 11 20 April 09 Oct09 Widespread unemployment Yes, very concerned 28% 19% or depression 37 33 Yes, somewhat concerned 21 21 Don't know 6 9 No 37 46 Have lost job already (vol.) 11 10 Don’t know 1 3 5