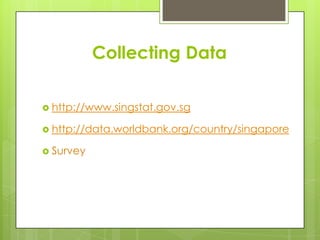
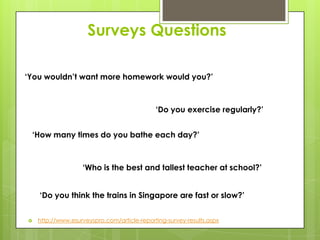
Surveys, Data
& Statistics
Collecting Data

 http://www.singstat.gov.sg

 http://data.worldbank.org/country/singapore

 Survey
Surveys Questions

‘You wouldn’t want more homework would you?’


                                              ‘Do you exercise regularly?’


    ‘How many times do you bathe each day?’


                    ‘Who is the best and tallest teacher at school?’


     ‘Do you think the trains in Singapore are fast or slow?’


    http://www.esurveyspro.com/article-reporting-survey-results.aspx
Reporting Results
   Introduce your research & its objectives
   Explain how you collected the data
   Describe your findings
   Summarise, make
    recommendations, conclusions…


(http://www.esurveyspro.com/article-reporting-survey-results.aspx)
Techniques for Presenting Data
   http://office.microsoft.com/en-us/excel-help/create-a-chart-
    HP001233728.aspx


   Explain the data axes
   Highlight subsets of data
   Dig deeper to unwrap data
   Place labels close to data points
   Complement data with energetic delivery!


(Andrew Dlugen, Six Minutes: Speaking and Presentation Skills)
http://sixminutes.dlugan.com
Surveys, data and statistics

Surveys, data and statistics

  • 1.
  • 2.
    Collecting Data  http://www.singstat.gov.sg http://data.worldbank.org/country/singapore  Survey
  • 3.
    Surveys Questions ‘You wouldn’twant more homework would you?’ ‘Do you exercise regularly?’ ‘How many times do you bathe each day?’ ‘Who is the best and tallest teacher at school?’ ‘Do you think the trains in Singapore are fast or slow?’  http://www.esurveyspro.com/article-reporting-survey-results.aspx
  • 4.
    Reporting Results  Introduce your research & its objectives  Explain how you collected the data  Describe your findings  Summarise, make recommendations, conclusions… (http://www.esurveyspro.com/article-reporting-survey-results.aspx)
  • 5.
    Techniques for PresentingData  http://office.microsoft.com/en-us/excel-help/create-a-chart- HP001233728.aspx  Explain the data axes  Highlight subsets of data  Dig deeper to unwrap data  Place labels close to data points  Complement data with energetic delivery! (Andrew Dlugen, Six Minutes: Speaking and Presentation Skills) http://sixminutes.dlugan.com