The document provides an overview of support vector machines (SVM), detailing their role as classifiers that output optimal hyperplanes for categorizing data points through supervised learning. It explains concepts such as linear vs nonlinear separability, margin, and key tuning parameters like kernel, regularization, and gamma. Additionally, it highlights the pros and cons of SVMs and their applications in various fields, including face detection and text categorization.
Introduction
SVM
A Support VectorMachine
(SVM) is a discriminative
classifier which intakes
training data (supervised
learning), the algorithm
outputs an optimal
hyperplane which
categorizes new examples.
3.
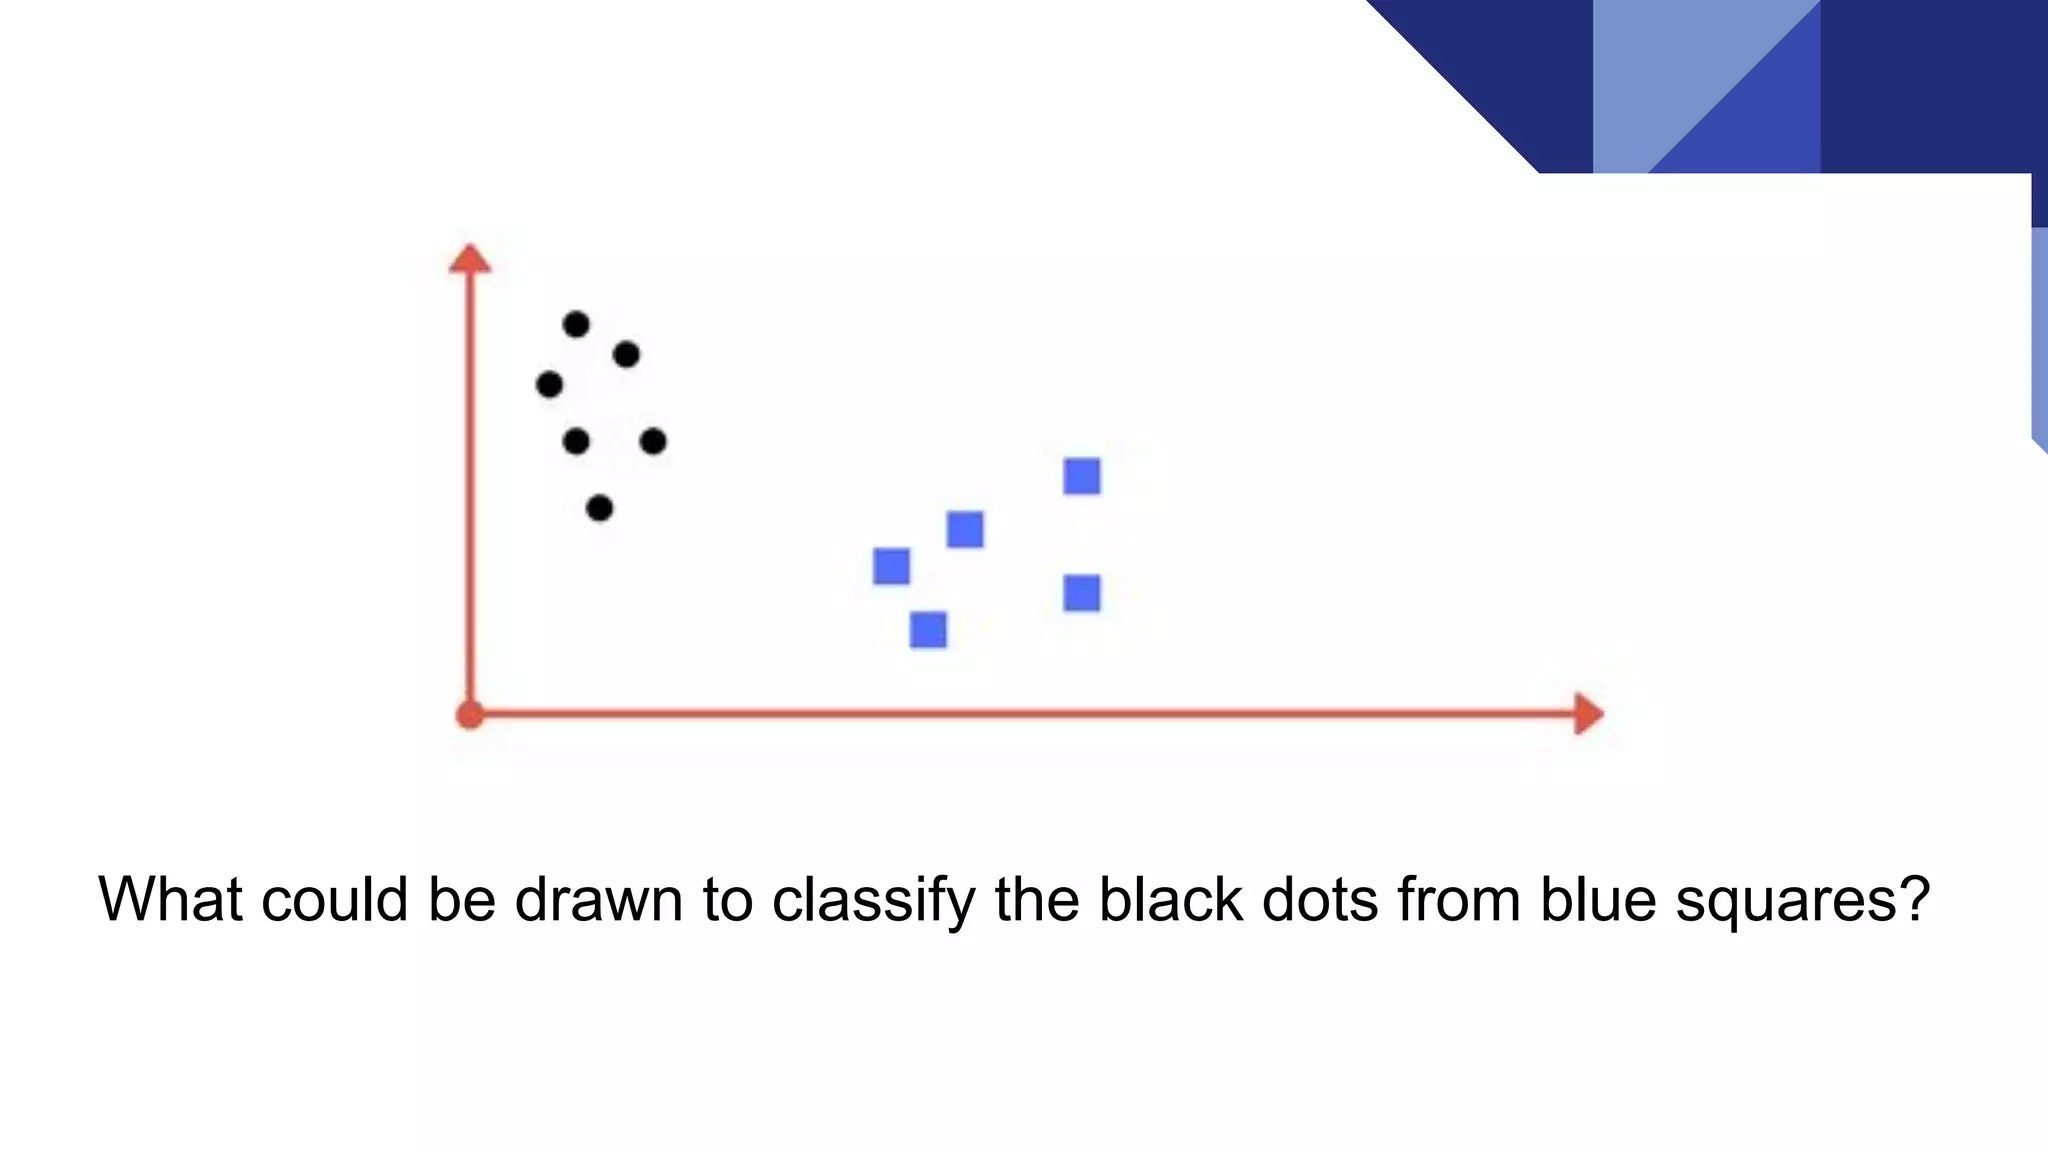
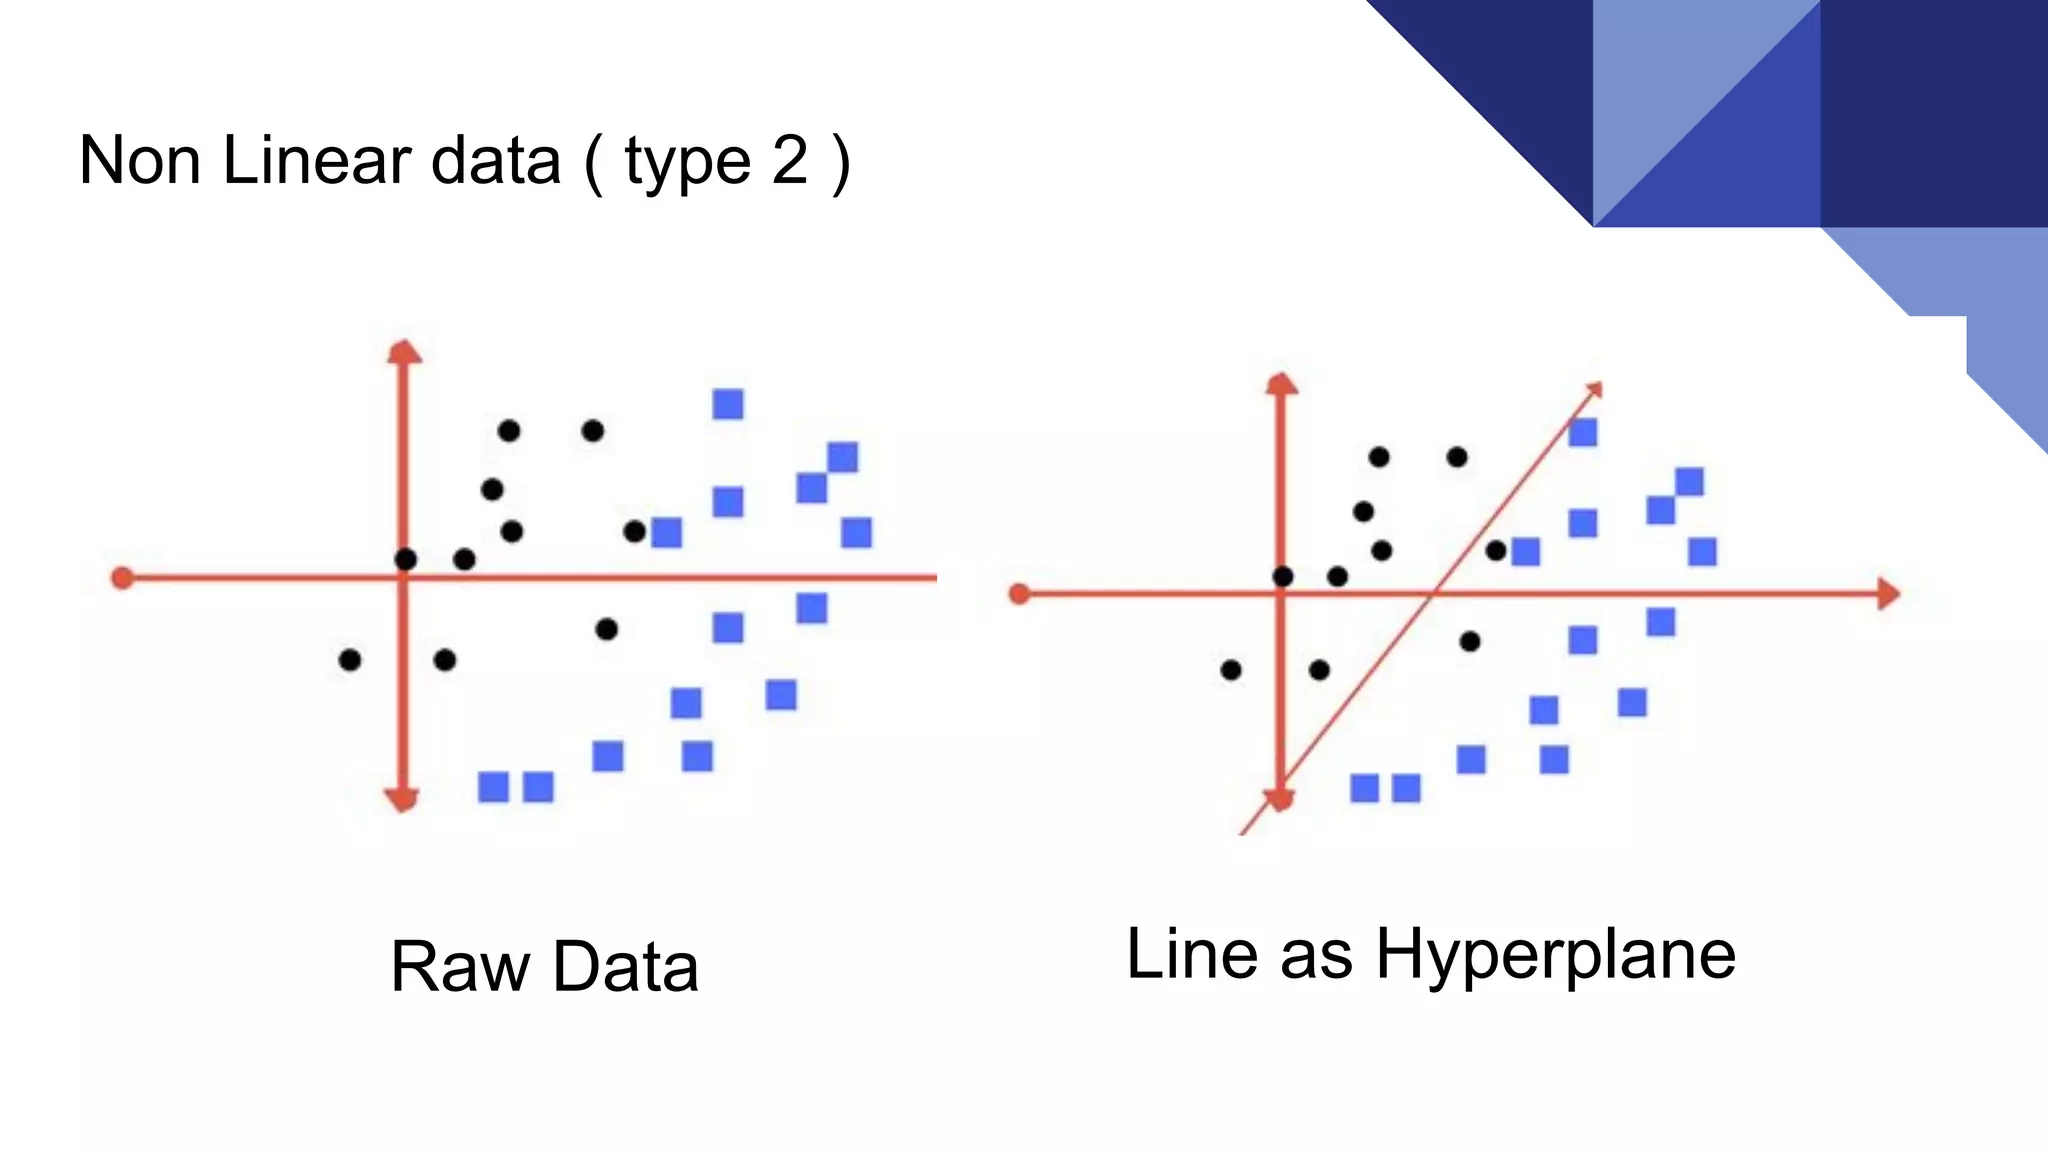
What could bedrawn to classify the black dots from blue squares?
4.
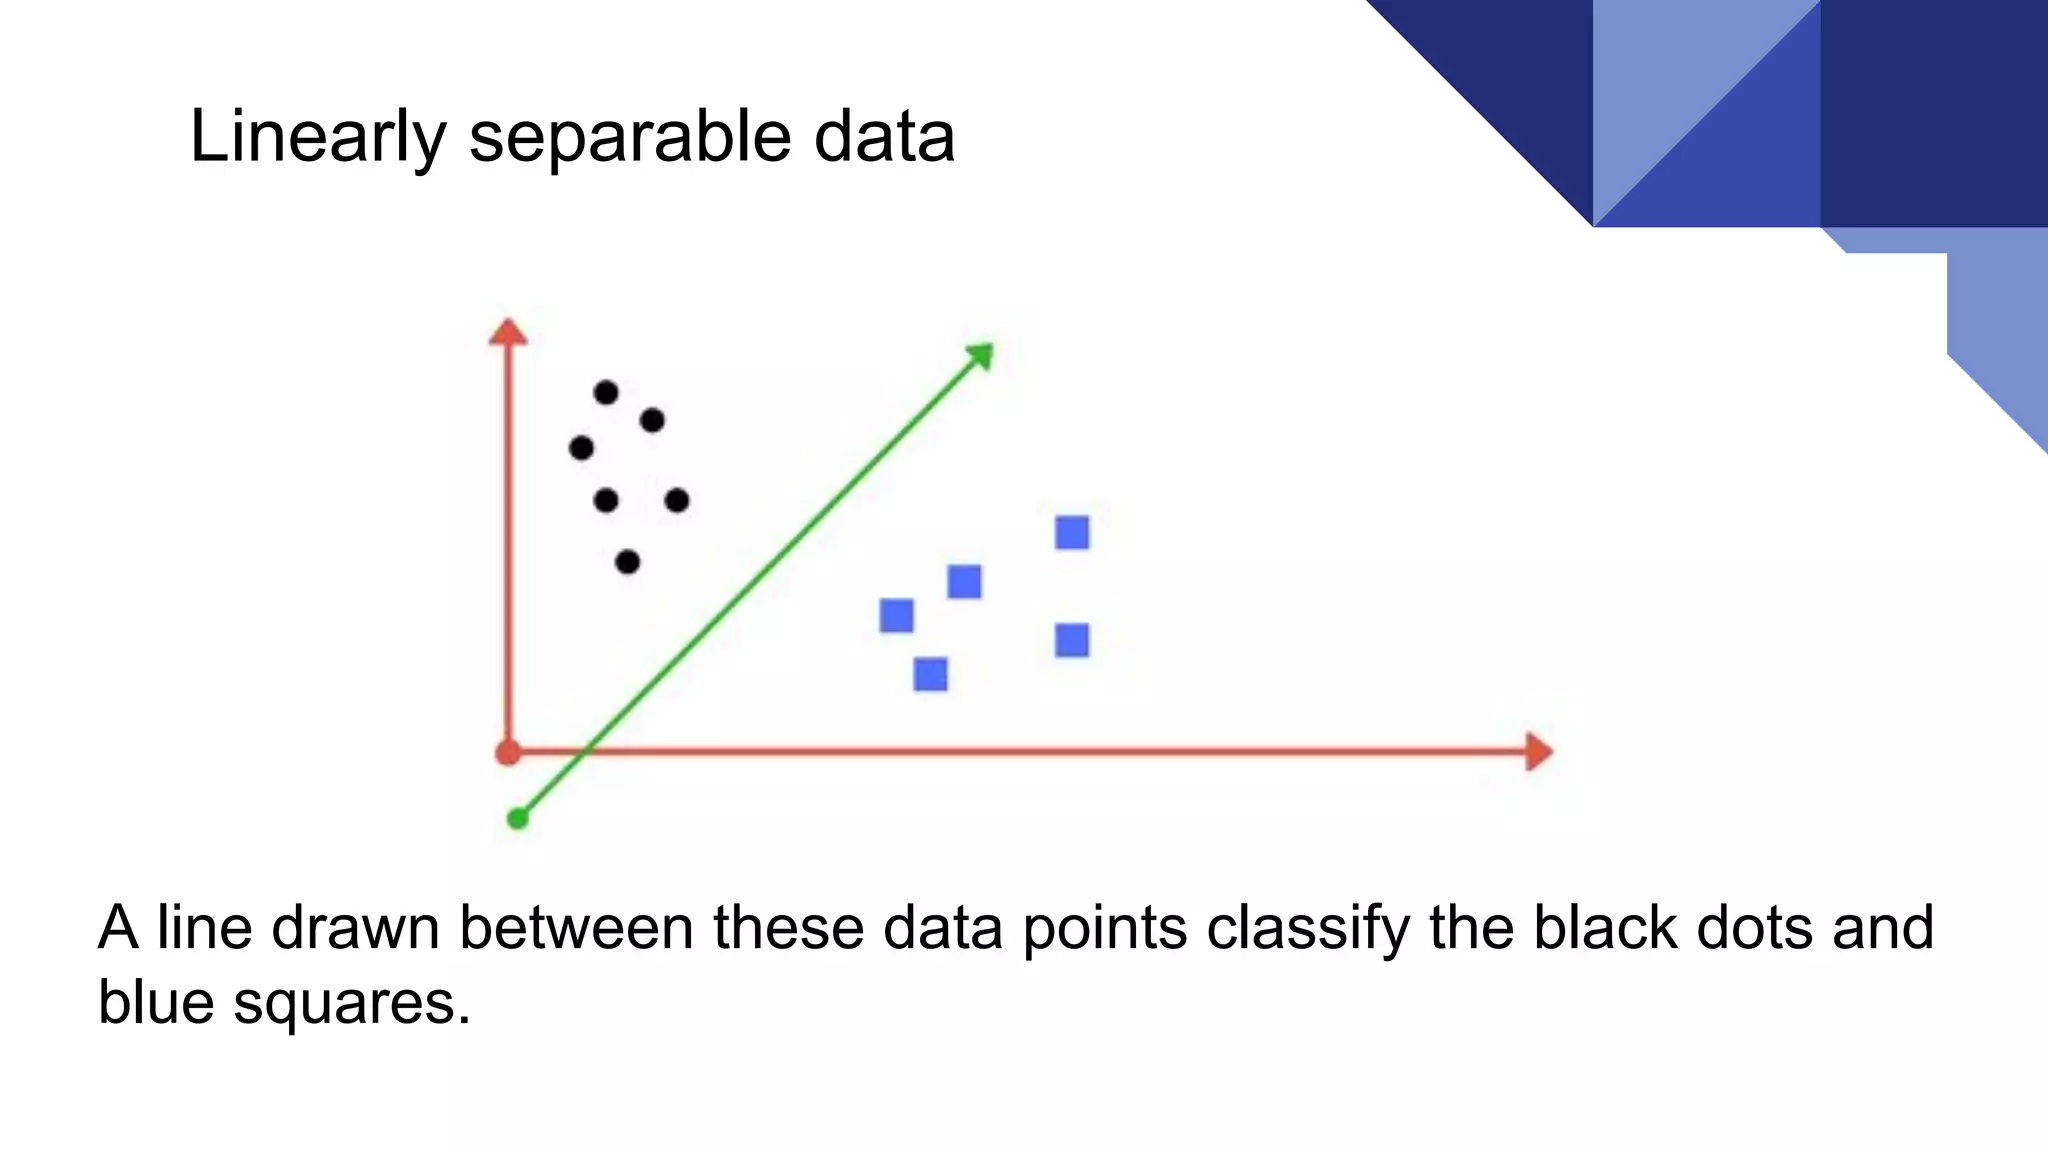
A line drawnbetween these data points classify the black dots and
blue squares.
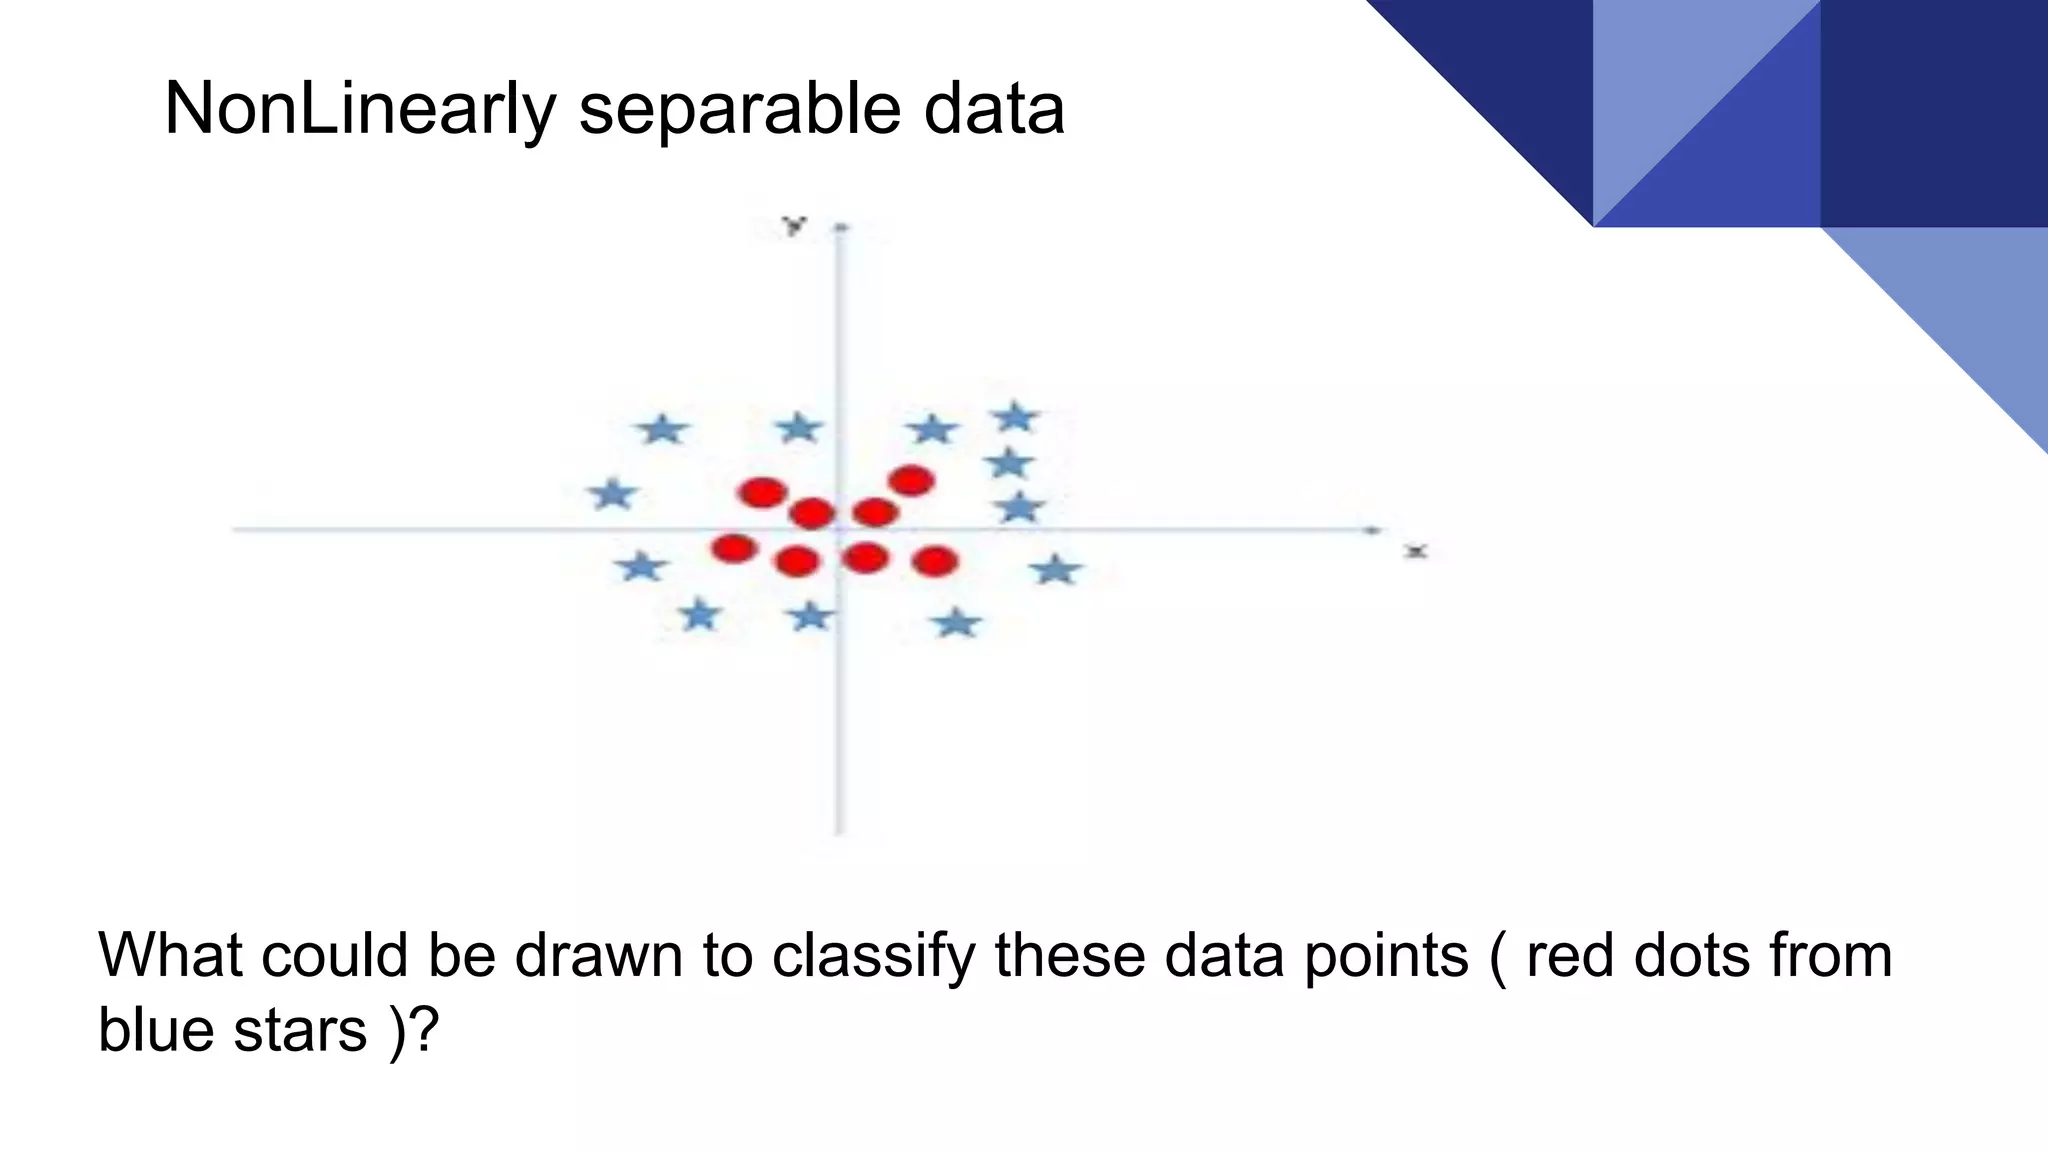
Linearly separable data
For the previousdata the line , if used as a
Hyperplane
● Two black dots also fall in category of
blue squares
● Data separation is not perfect
● It tolerates some outliers in the
classification
10.
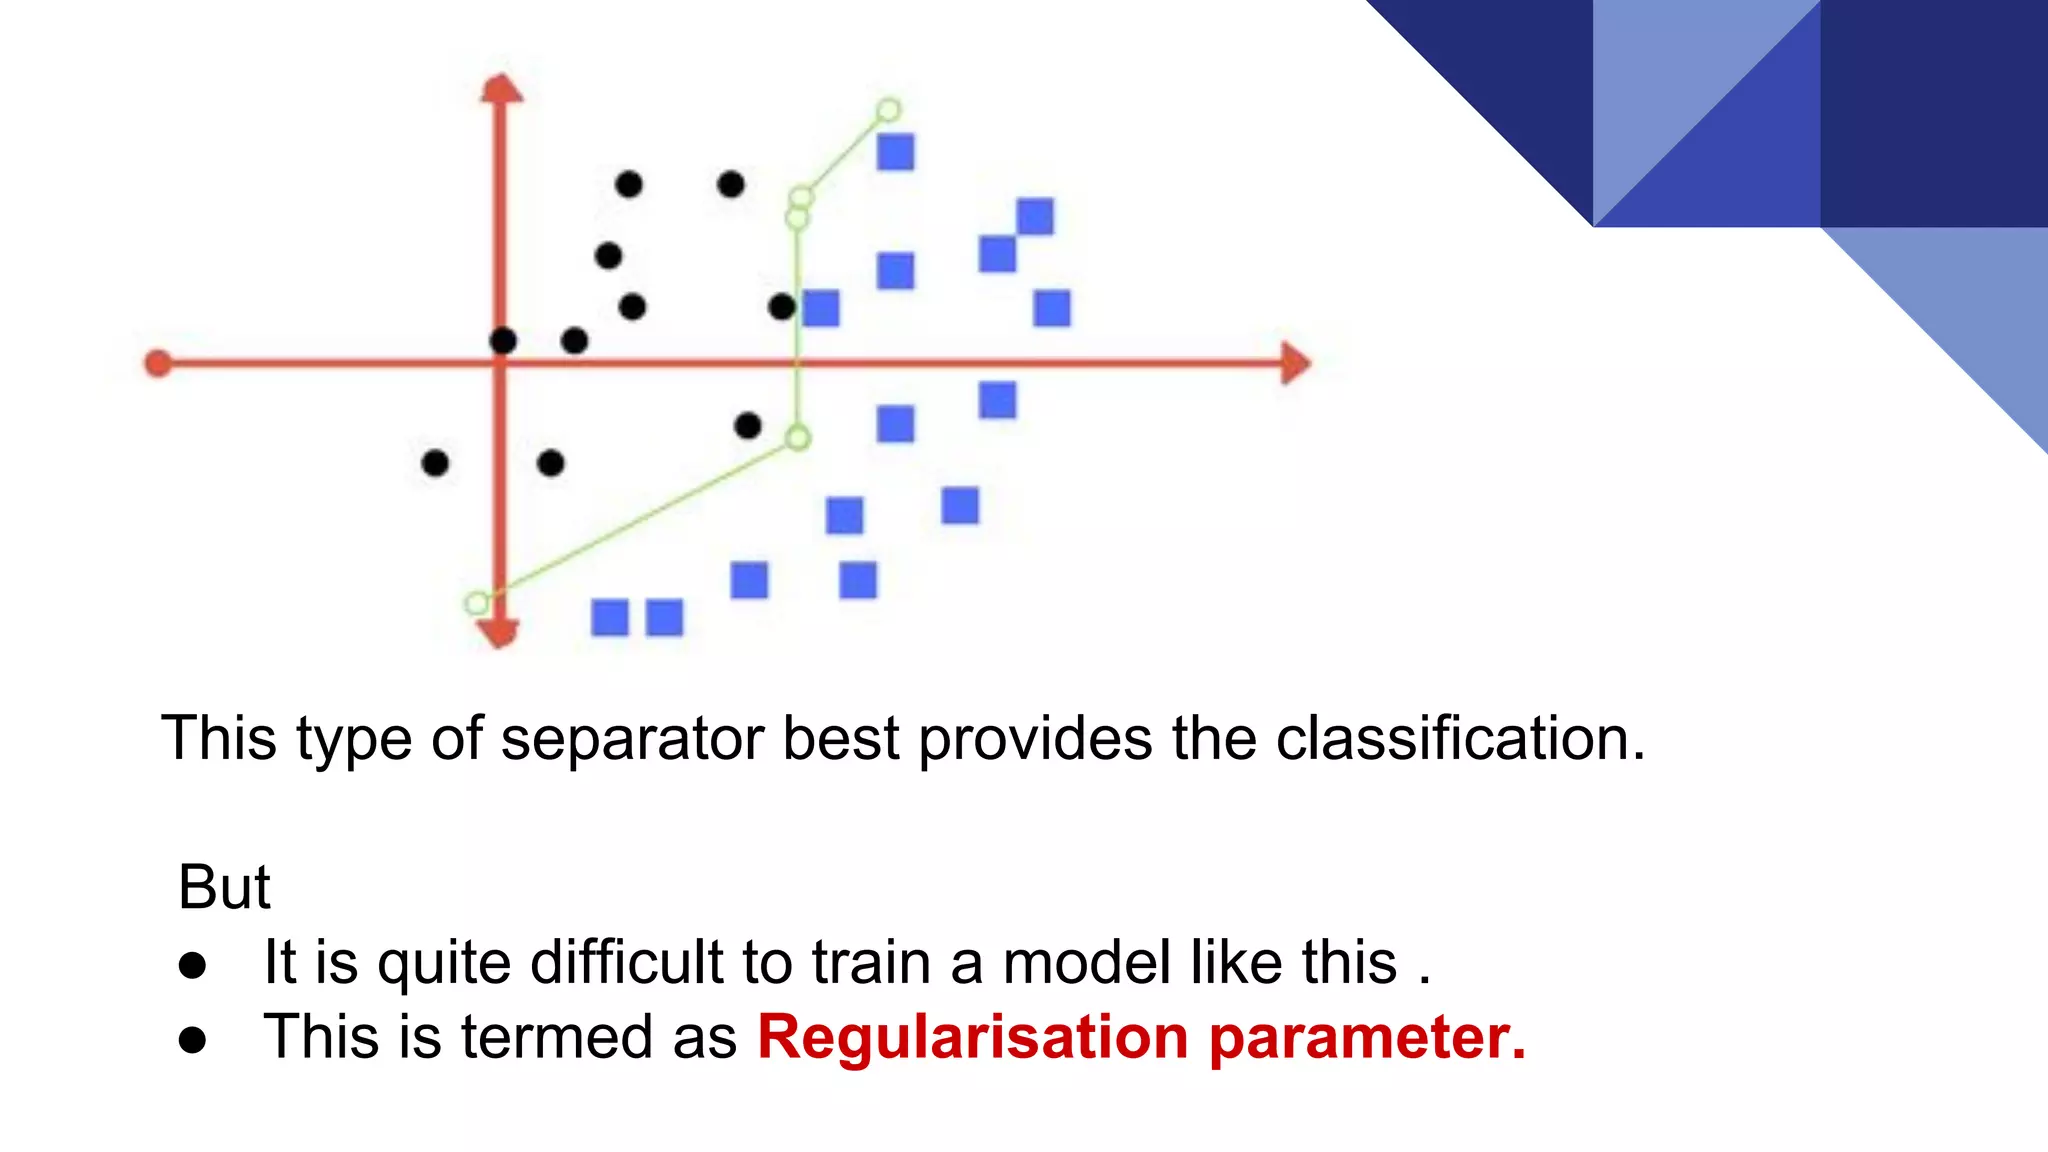
This type ofseparator best provides the classification.
But
● It is quite difficult to train a model like this .
● This is termed as Regularisation parameter.
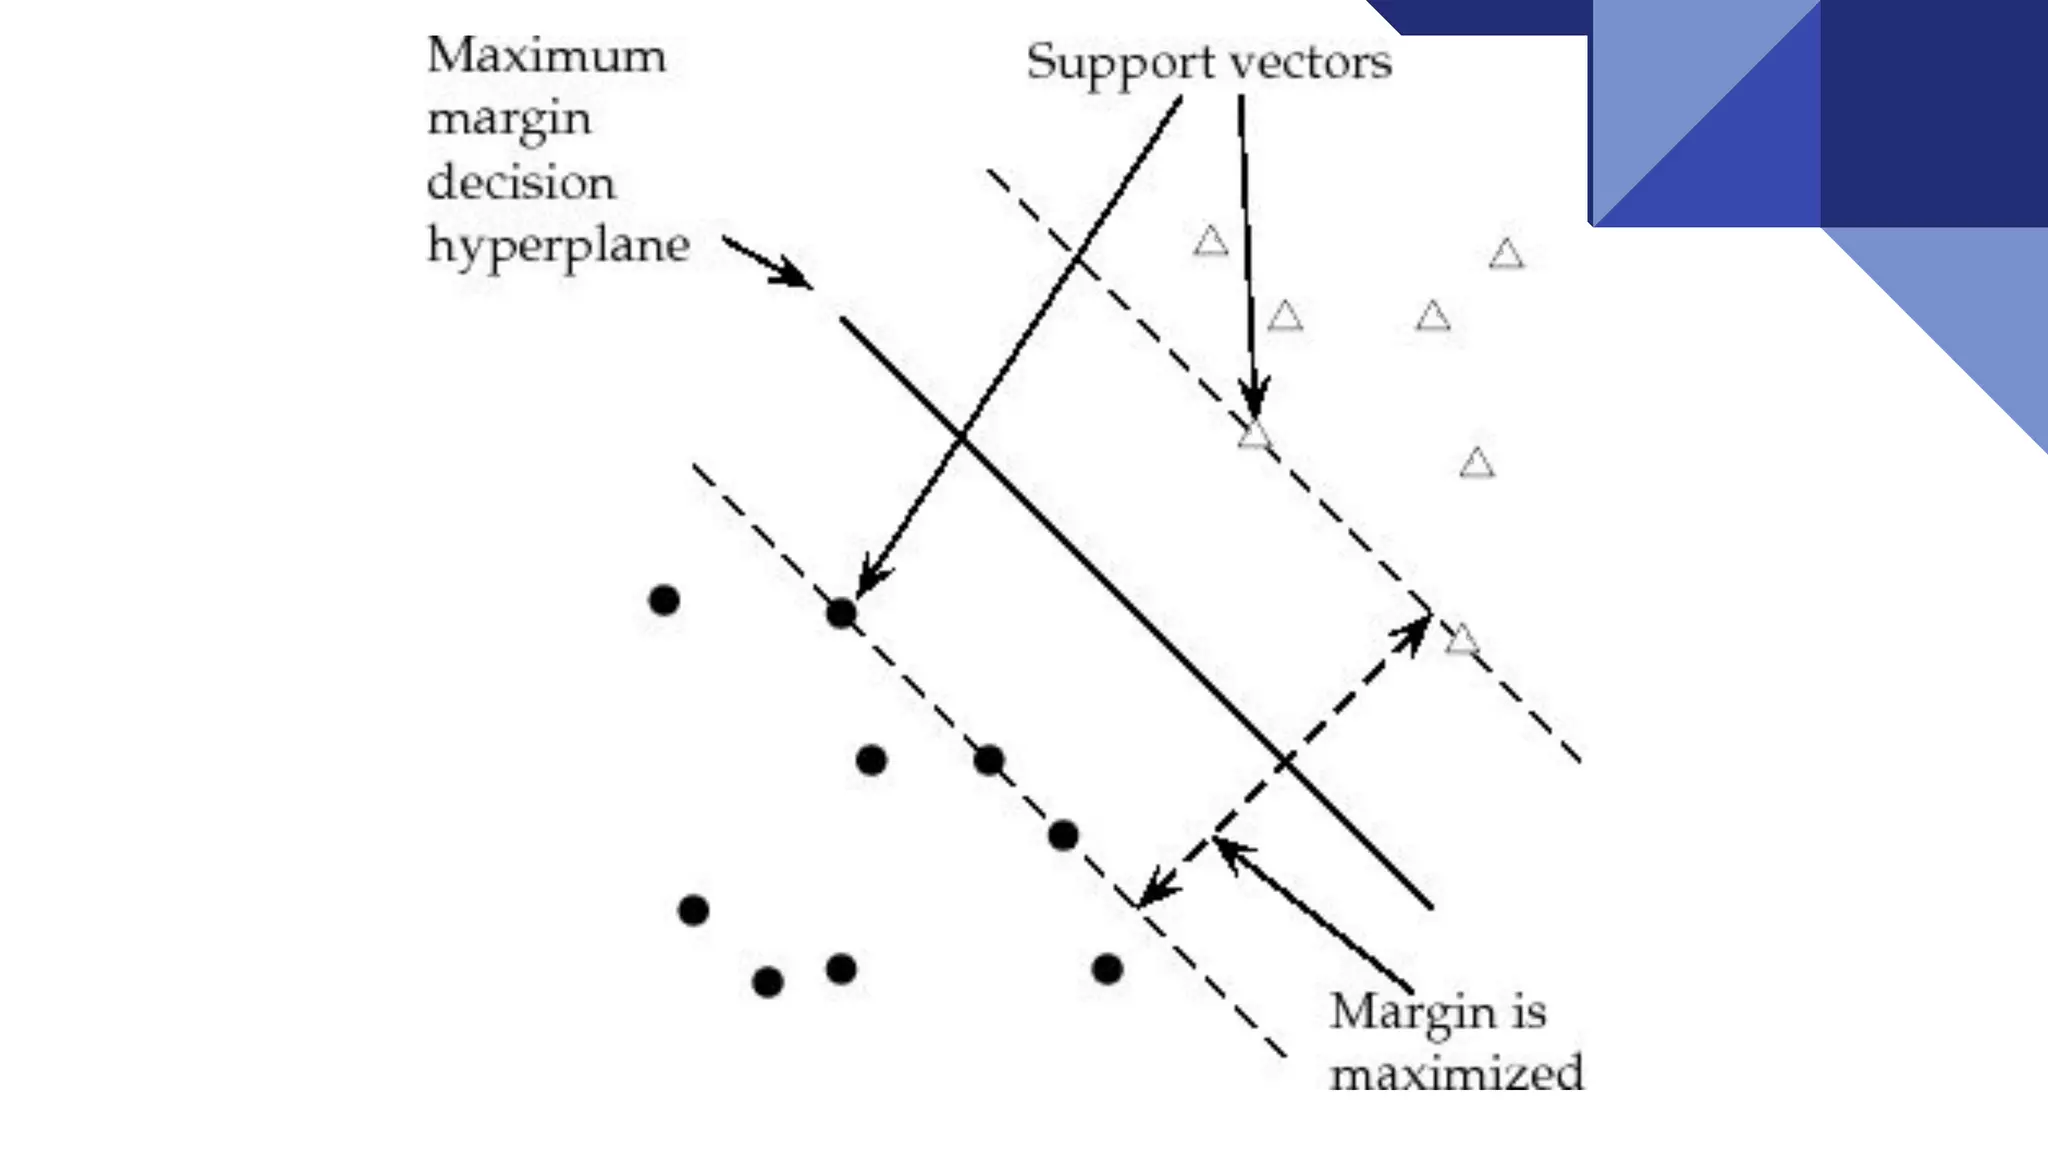
Margin
Margin is theperpendicular distance between the
closest data points and the Hyperplane ( on both sides )
The best optimised line ( hyperplane ) with maximum
margin is termed as Margin Maximal Hyperplane.
The closest points where the margin distance is
calculated are considered as the support vectors.
14.
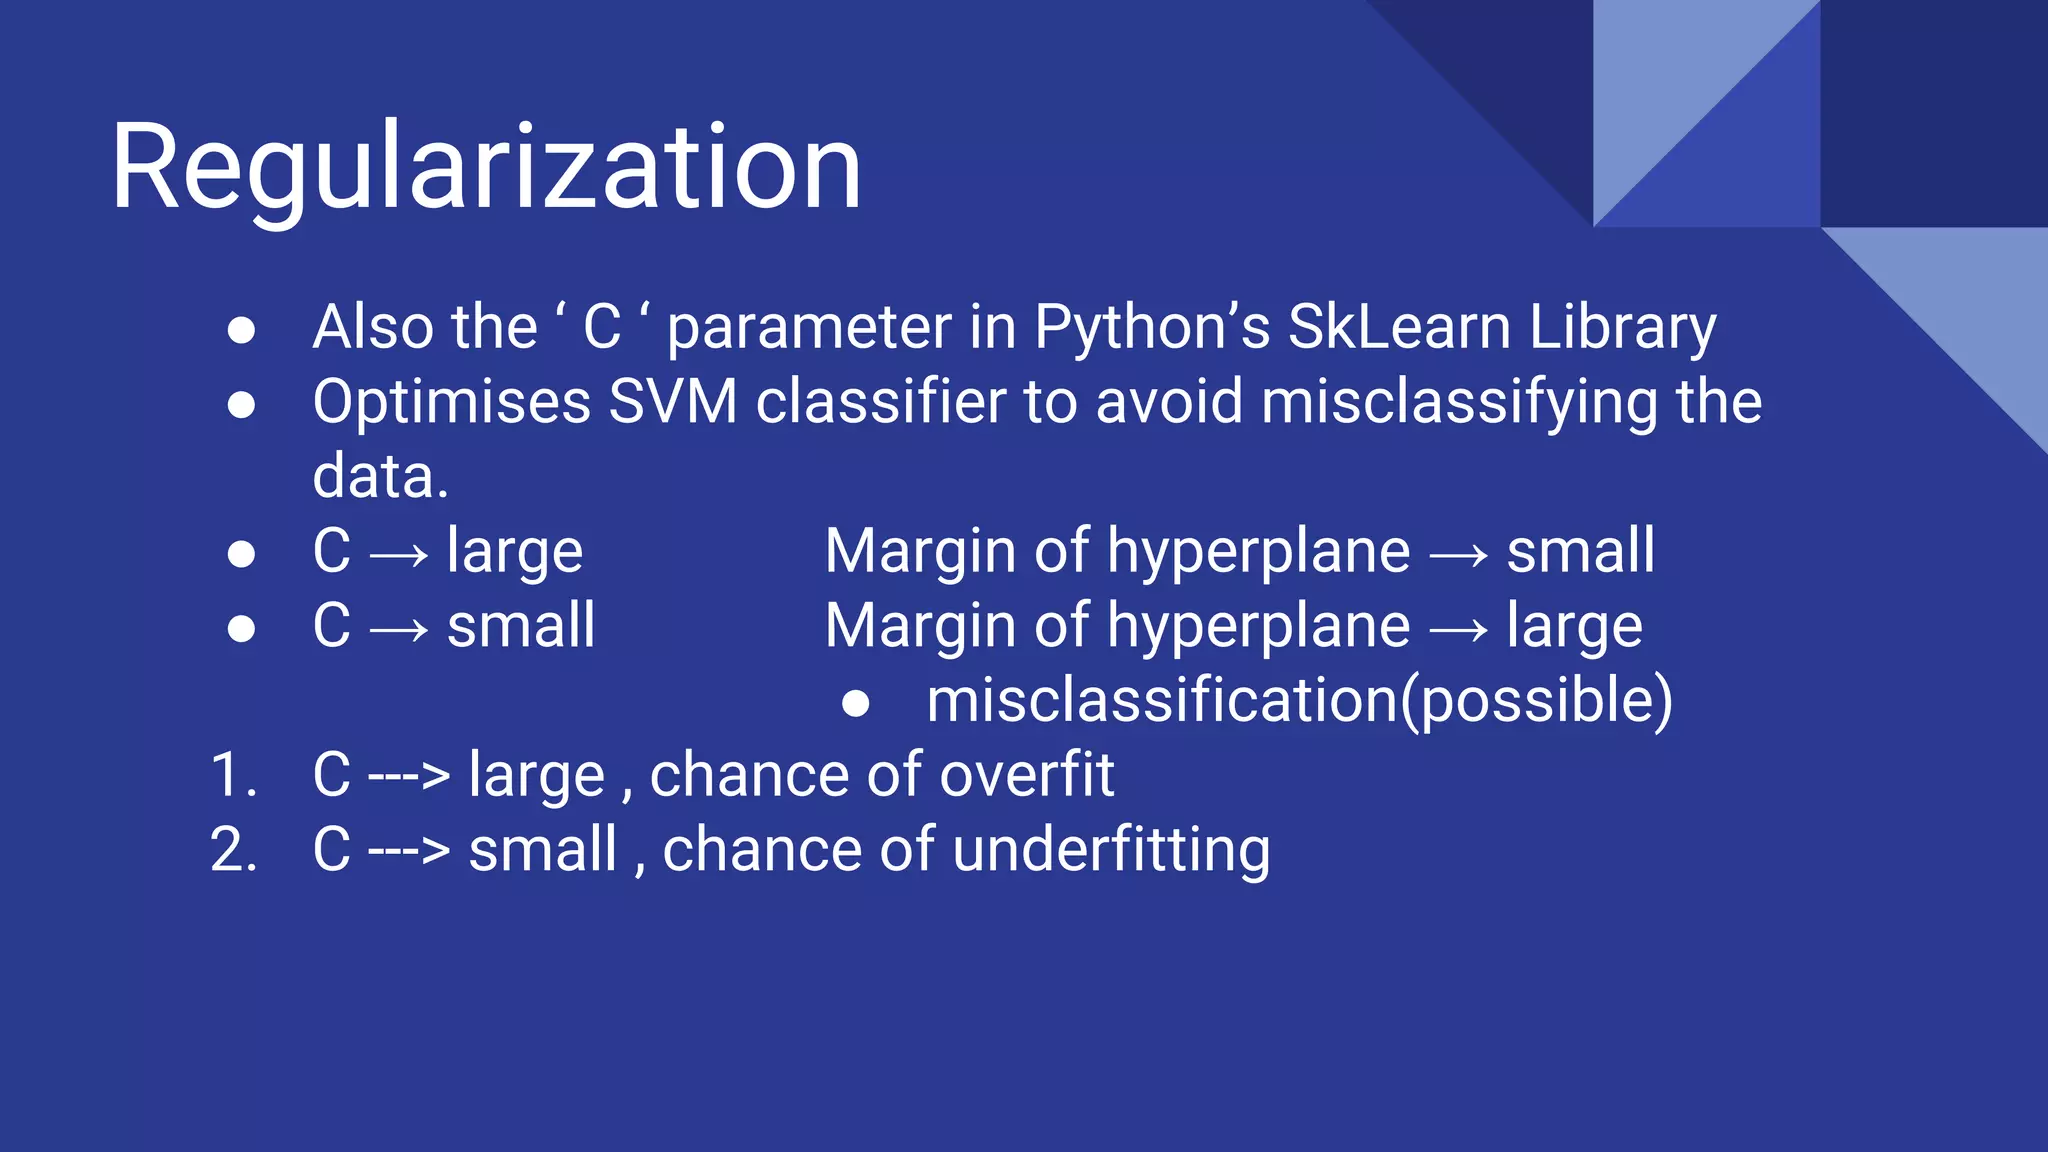
Regularization
● Also the‘ C ‘ parameter in Python’s SkLearn Library
● Optimises SVM classifier to avoid misclassifying the
data.
● C → large Margin of hyperplane → small
● C → small Margin of hyperplane → large
● misclassification(possible)
1. C ---> large , chance of overfit
2. C ---> small , chance of underfitting
16.
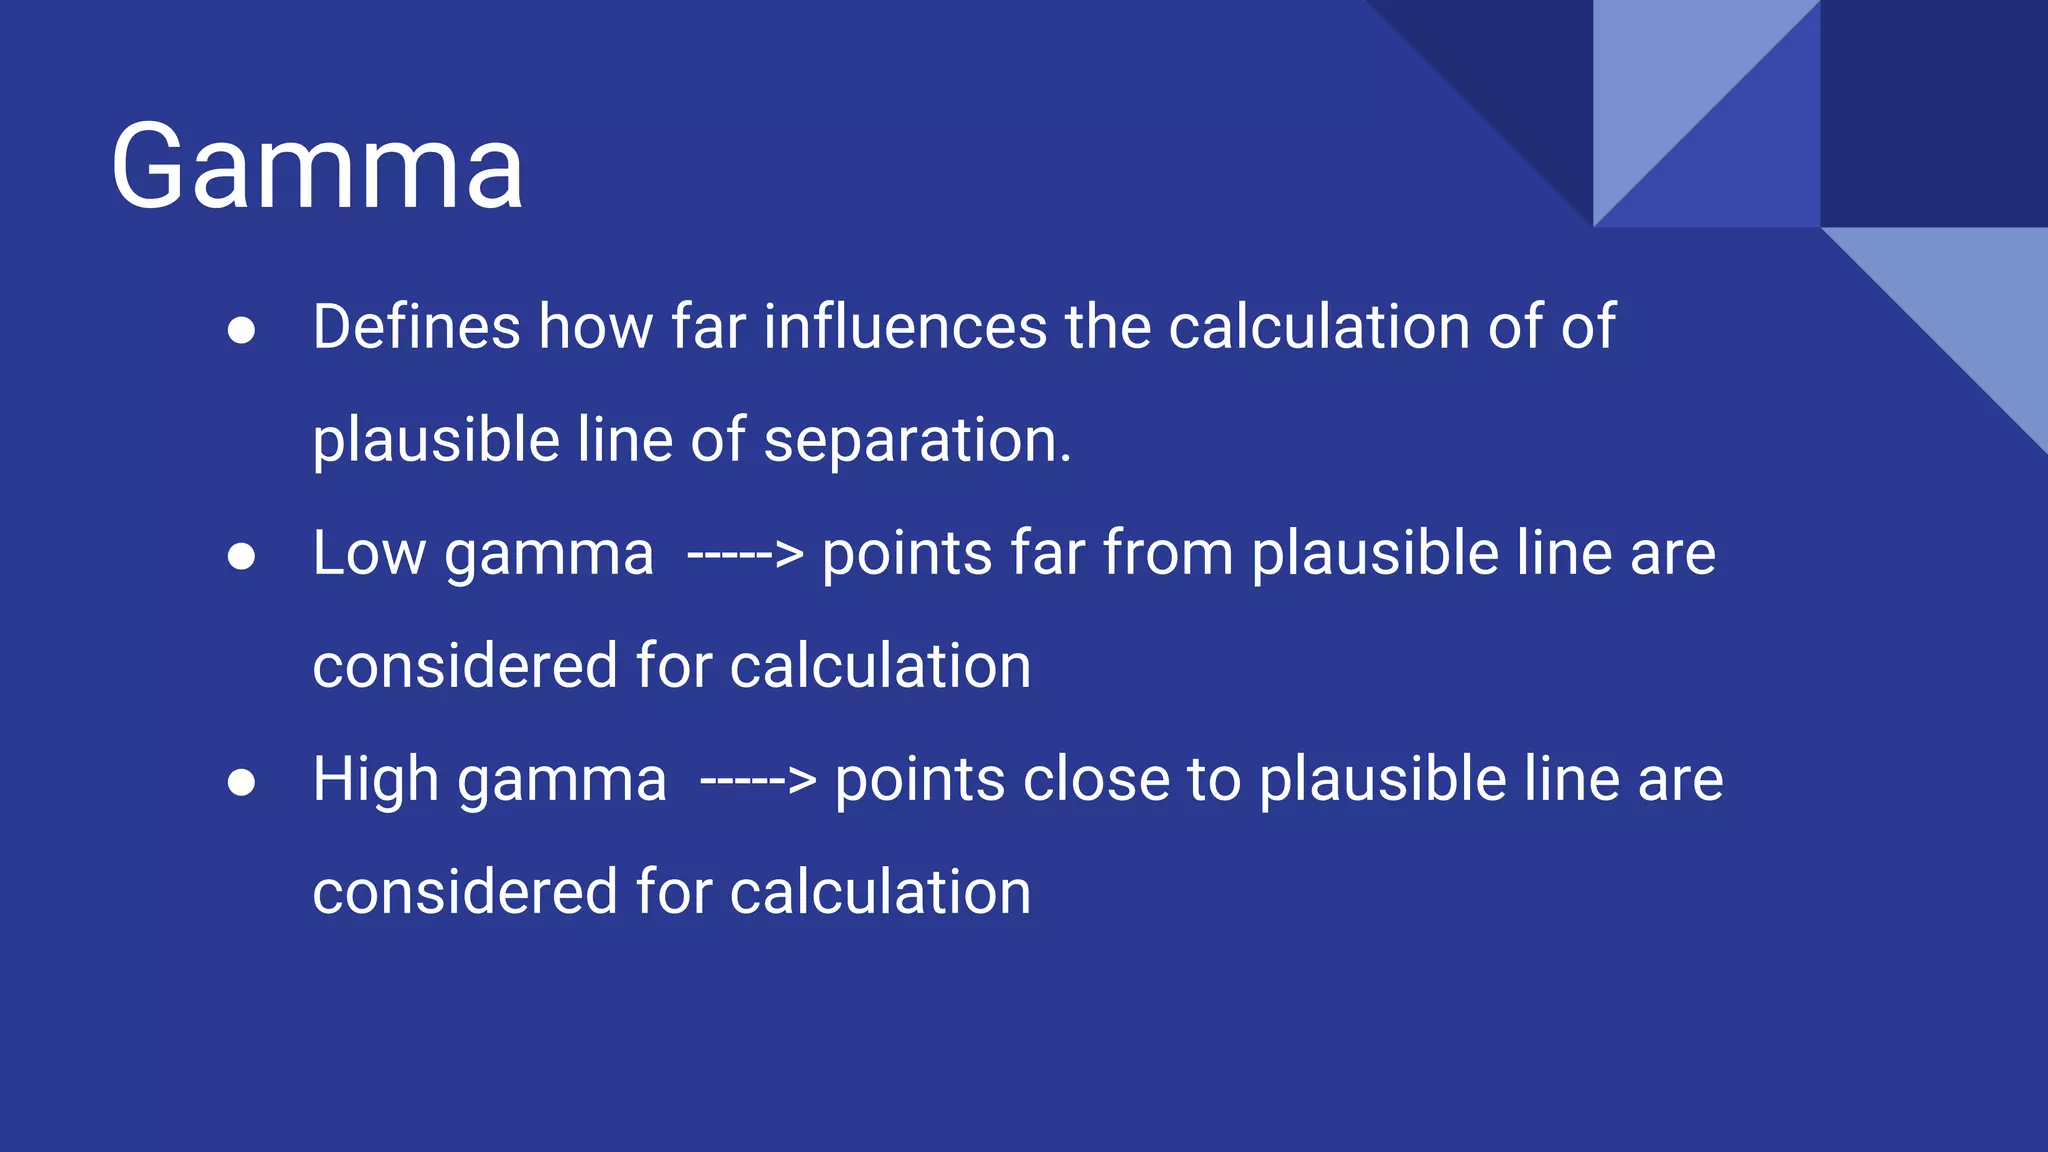
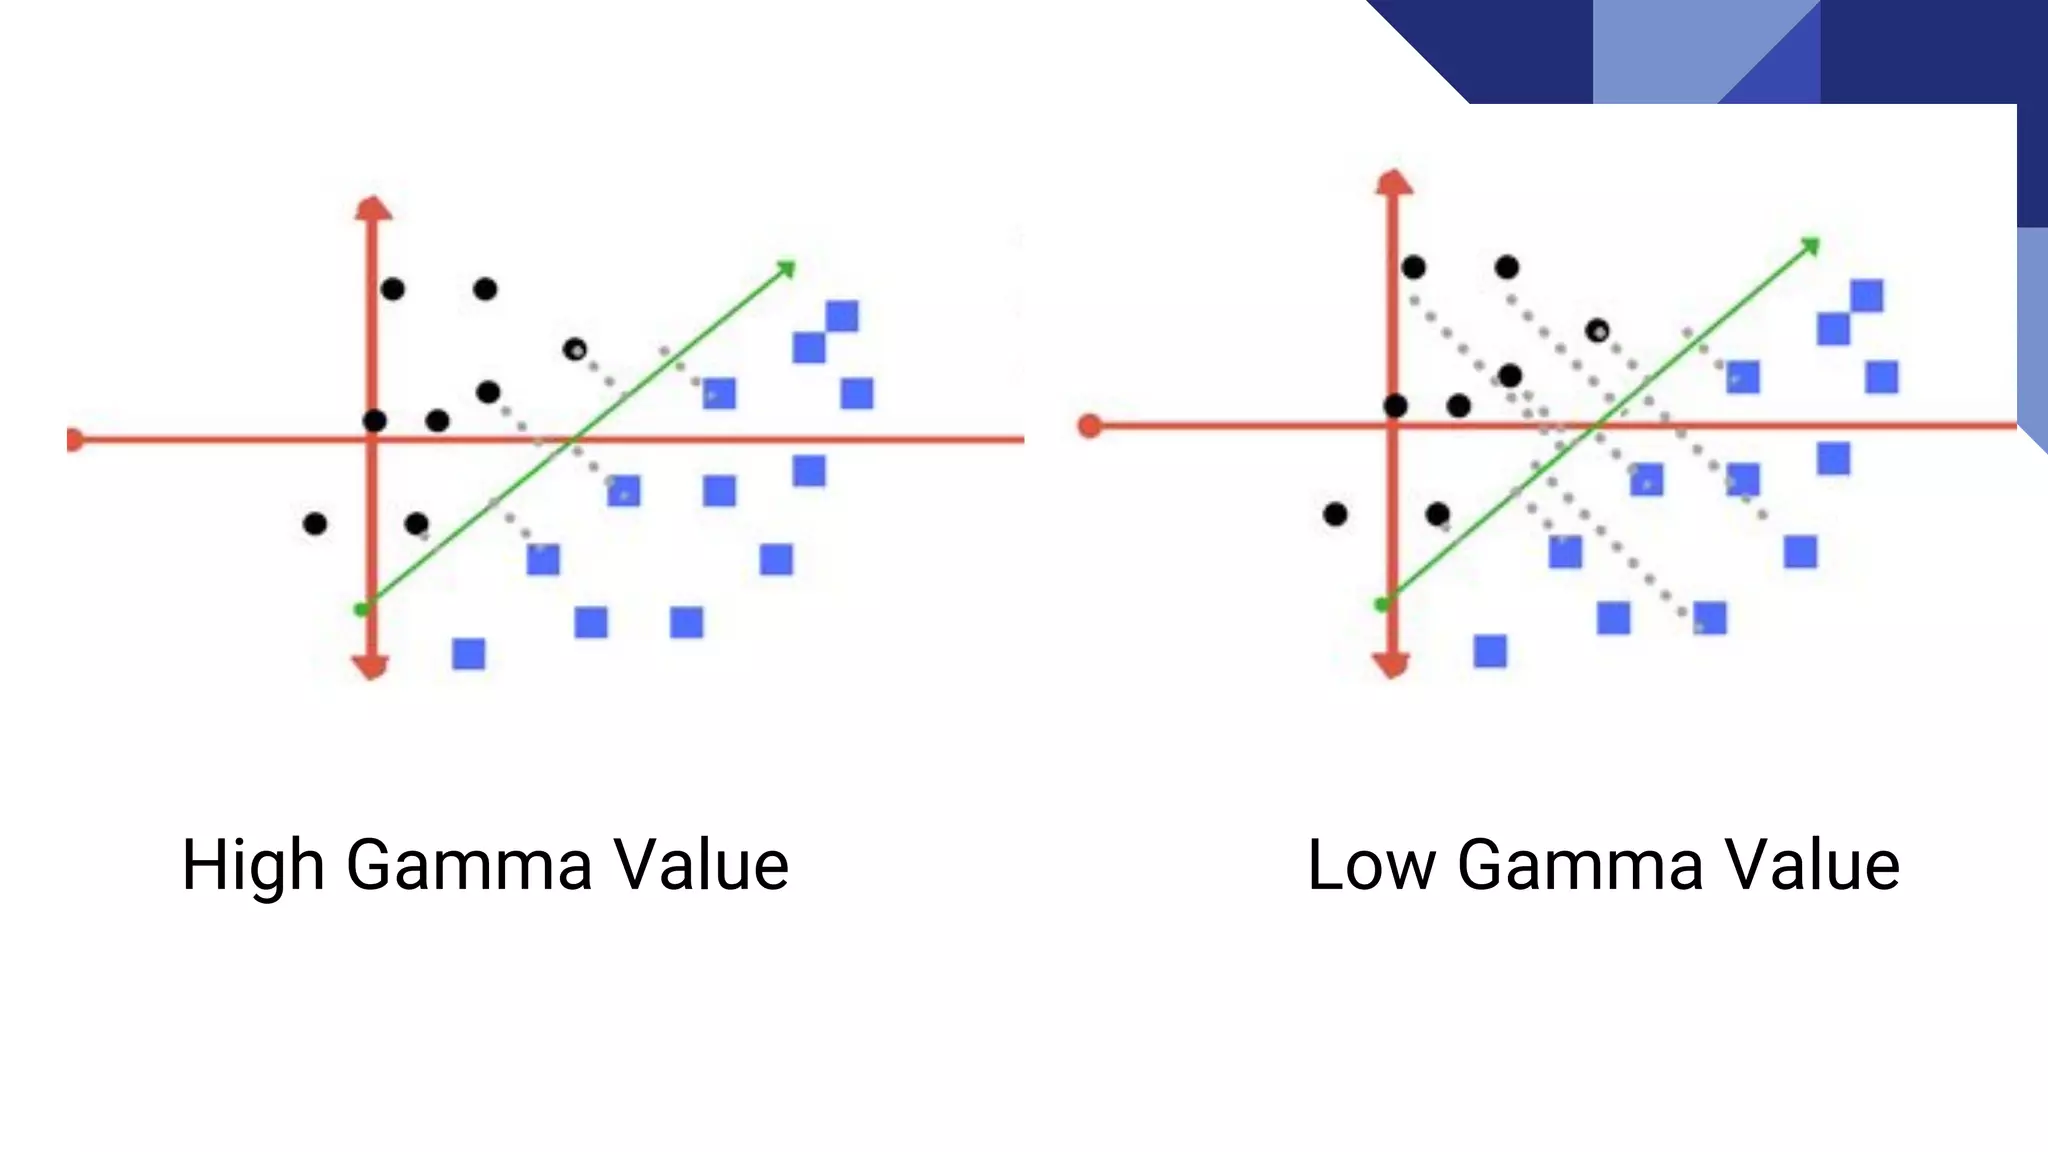
Gamma
● Defines howfar influences the calculation of of
plausible line of separation.
● Low gamma -----> points far from plausible line are
considered for calculation
● High gamma -----> points close to plausible line are
considered for calculation
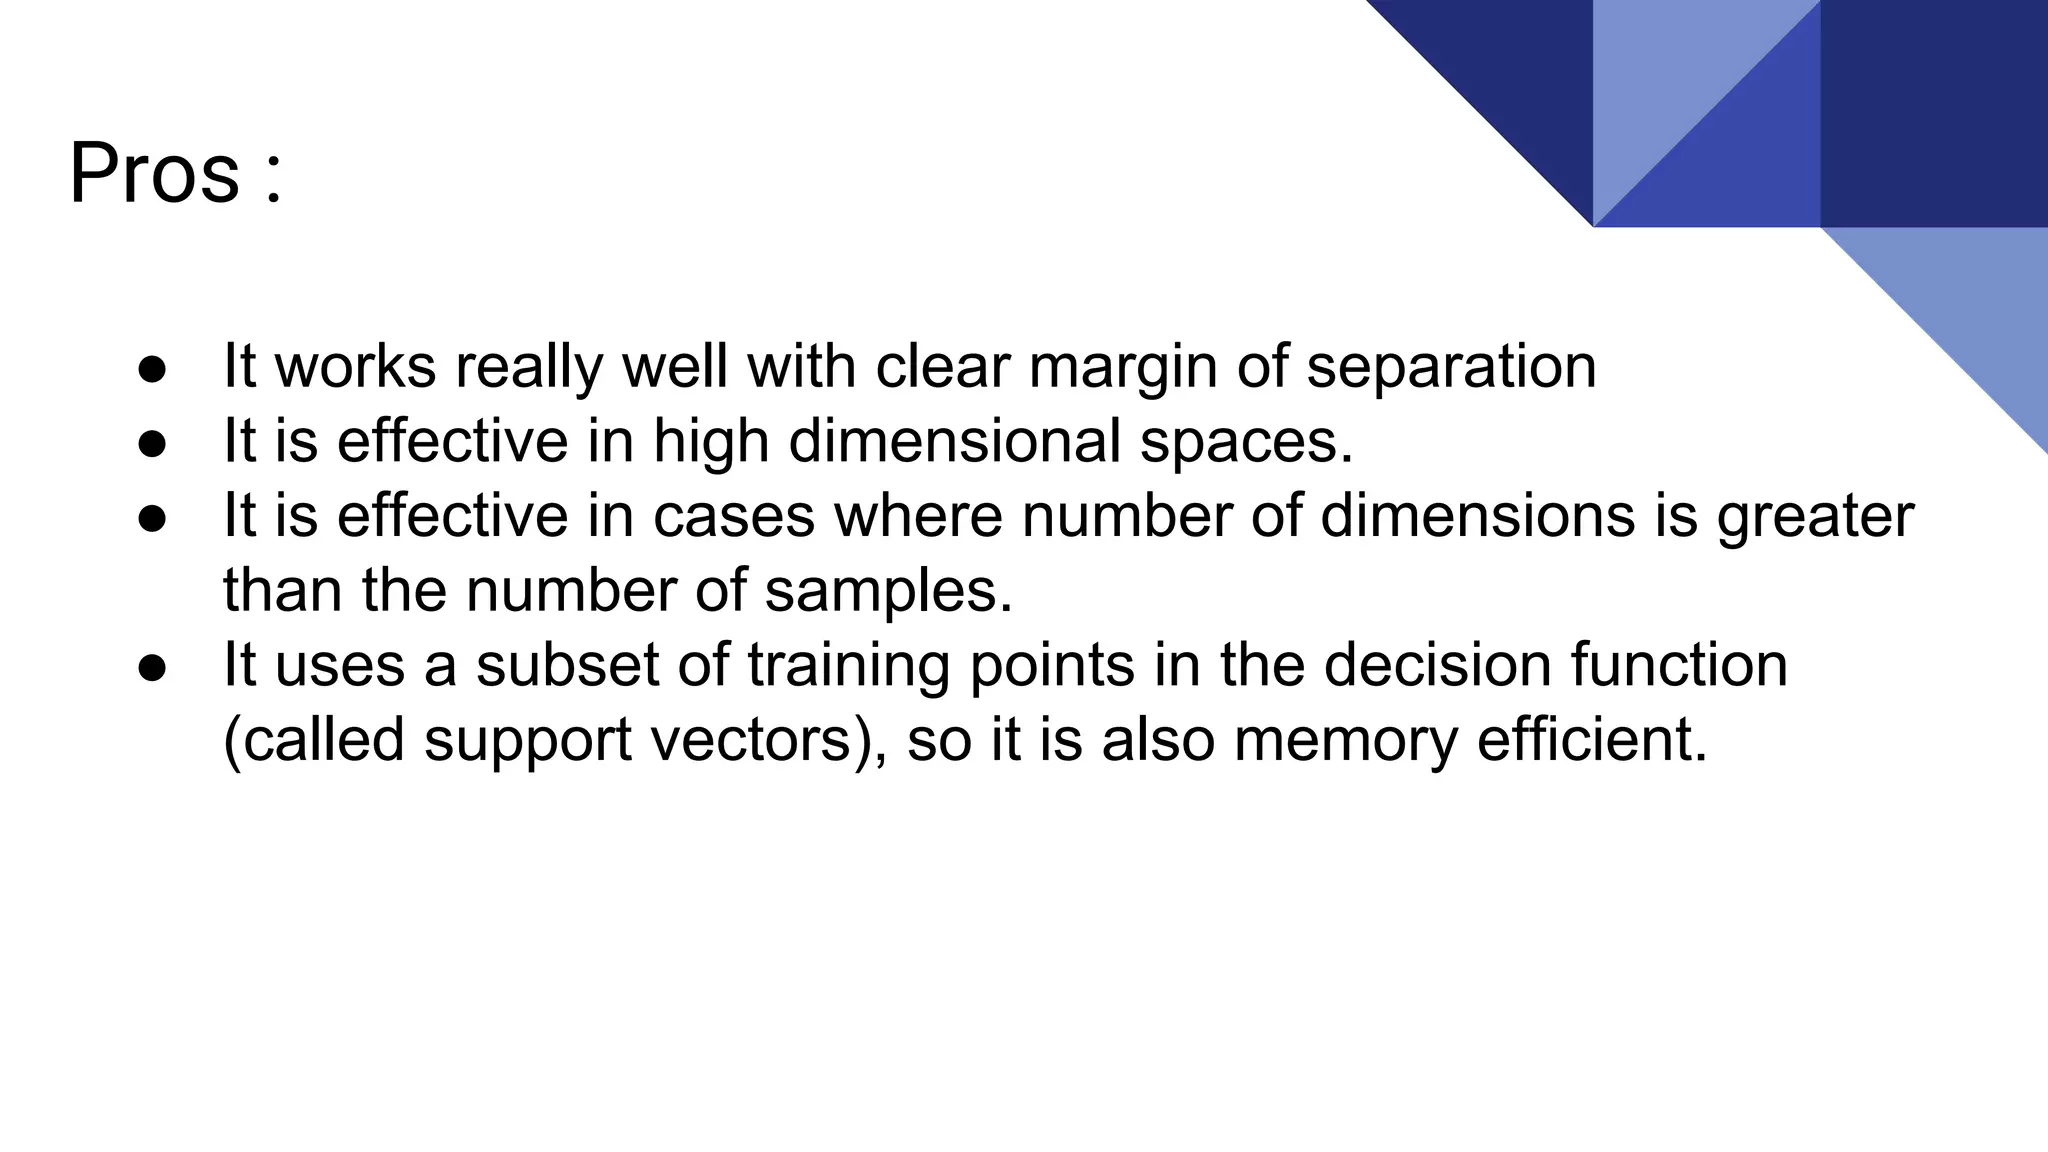
Pros :
● Itworks really well with clear margin of separation
● It is effective in high dimensional spaces.
● It is effective in cases where number of dimensions is greater
than the number of samples.
● It uses a subset of training points in the decision function
(called support vectors), so it is also memory efficient.
23.
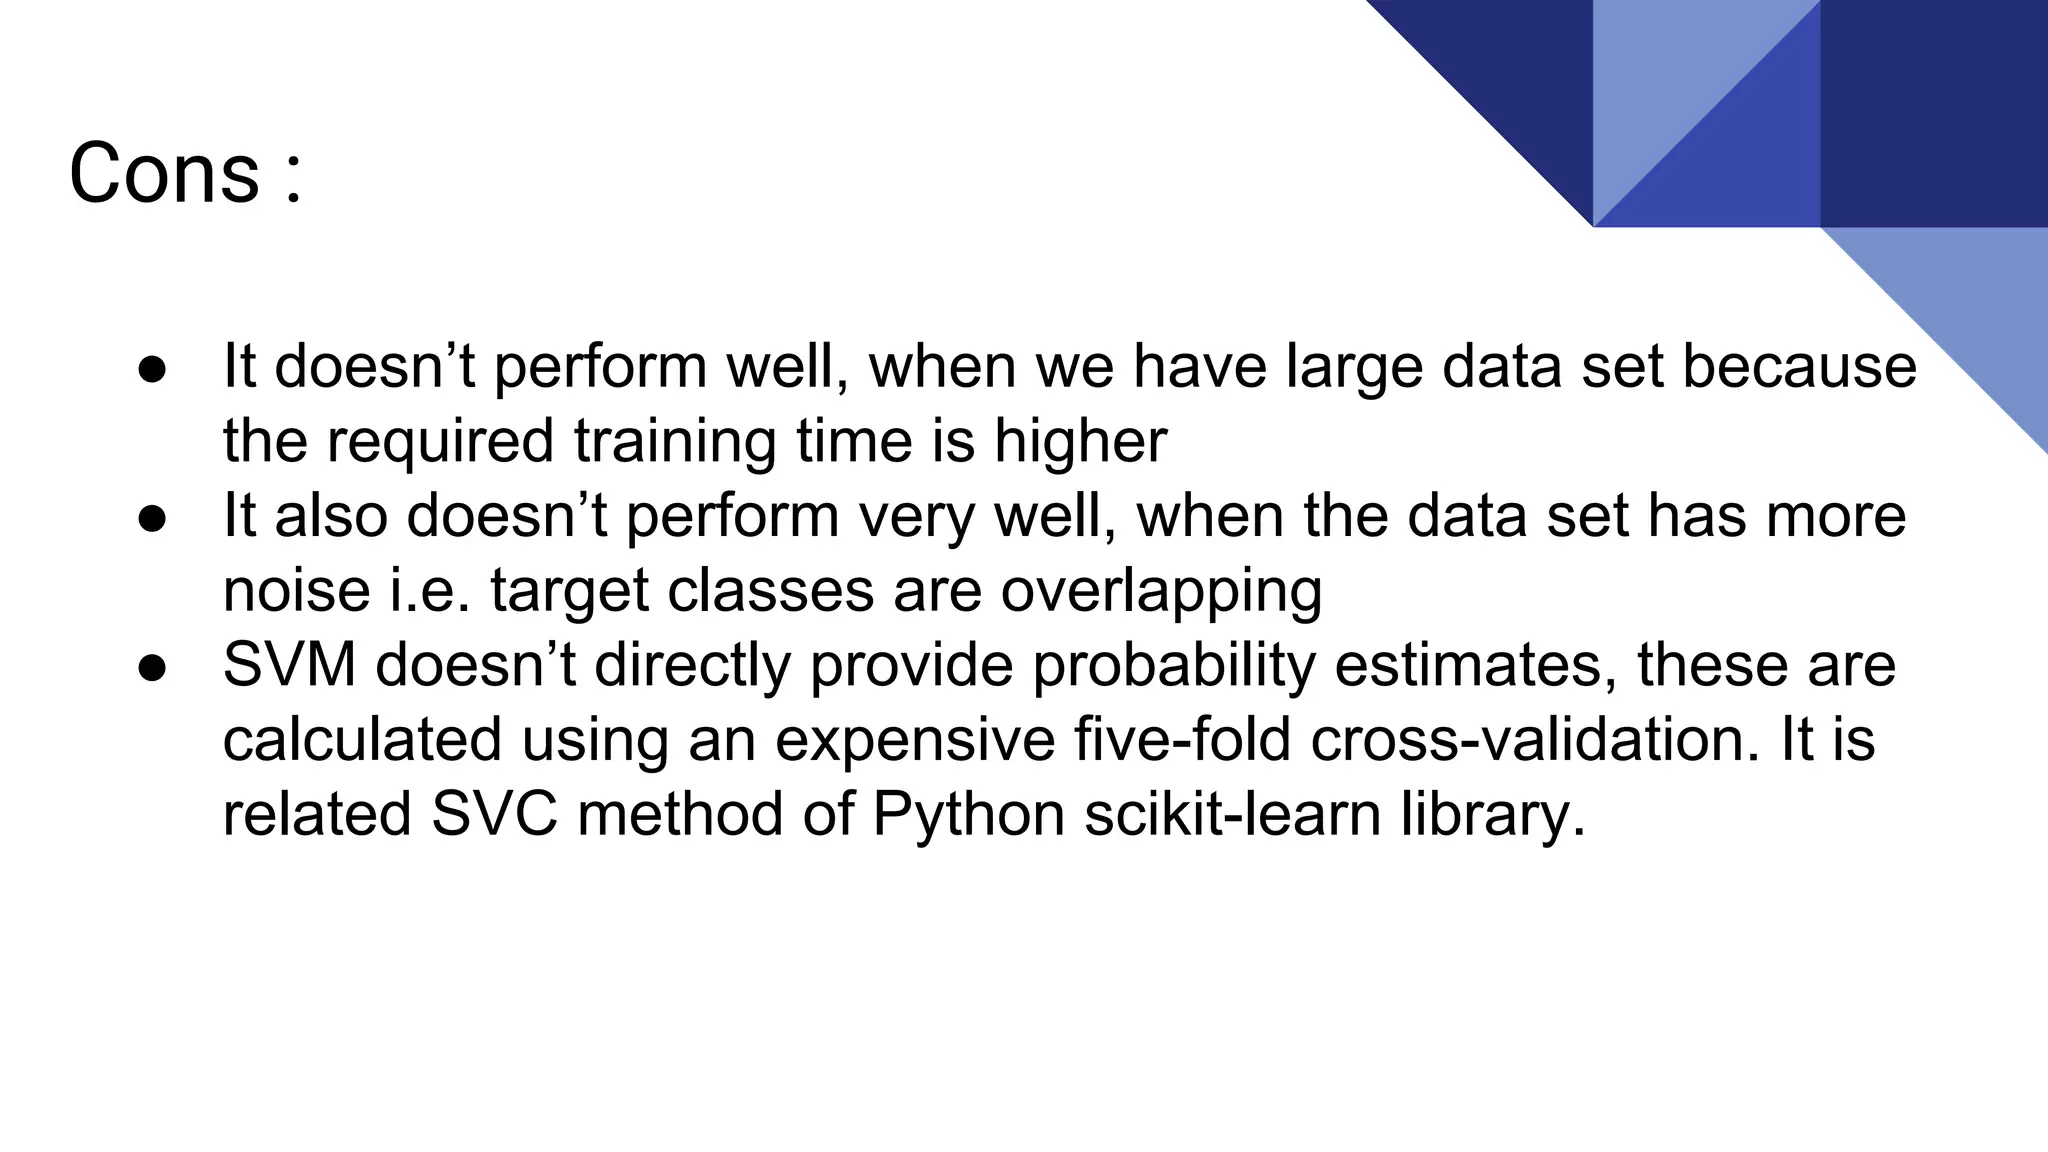
Cons :
● Itdoesn’t perform well, when we have large data set because
the required training time is higher
● It also doesn’t perform very well, when the data set has more
noise i.e. target classes are overlapping
● SVM doesn’t directly provide probability estimates, these are
calculated using an expensive five-fold cross-validation. It is
related SVC method of Python scikit-learn library.
24.
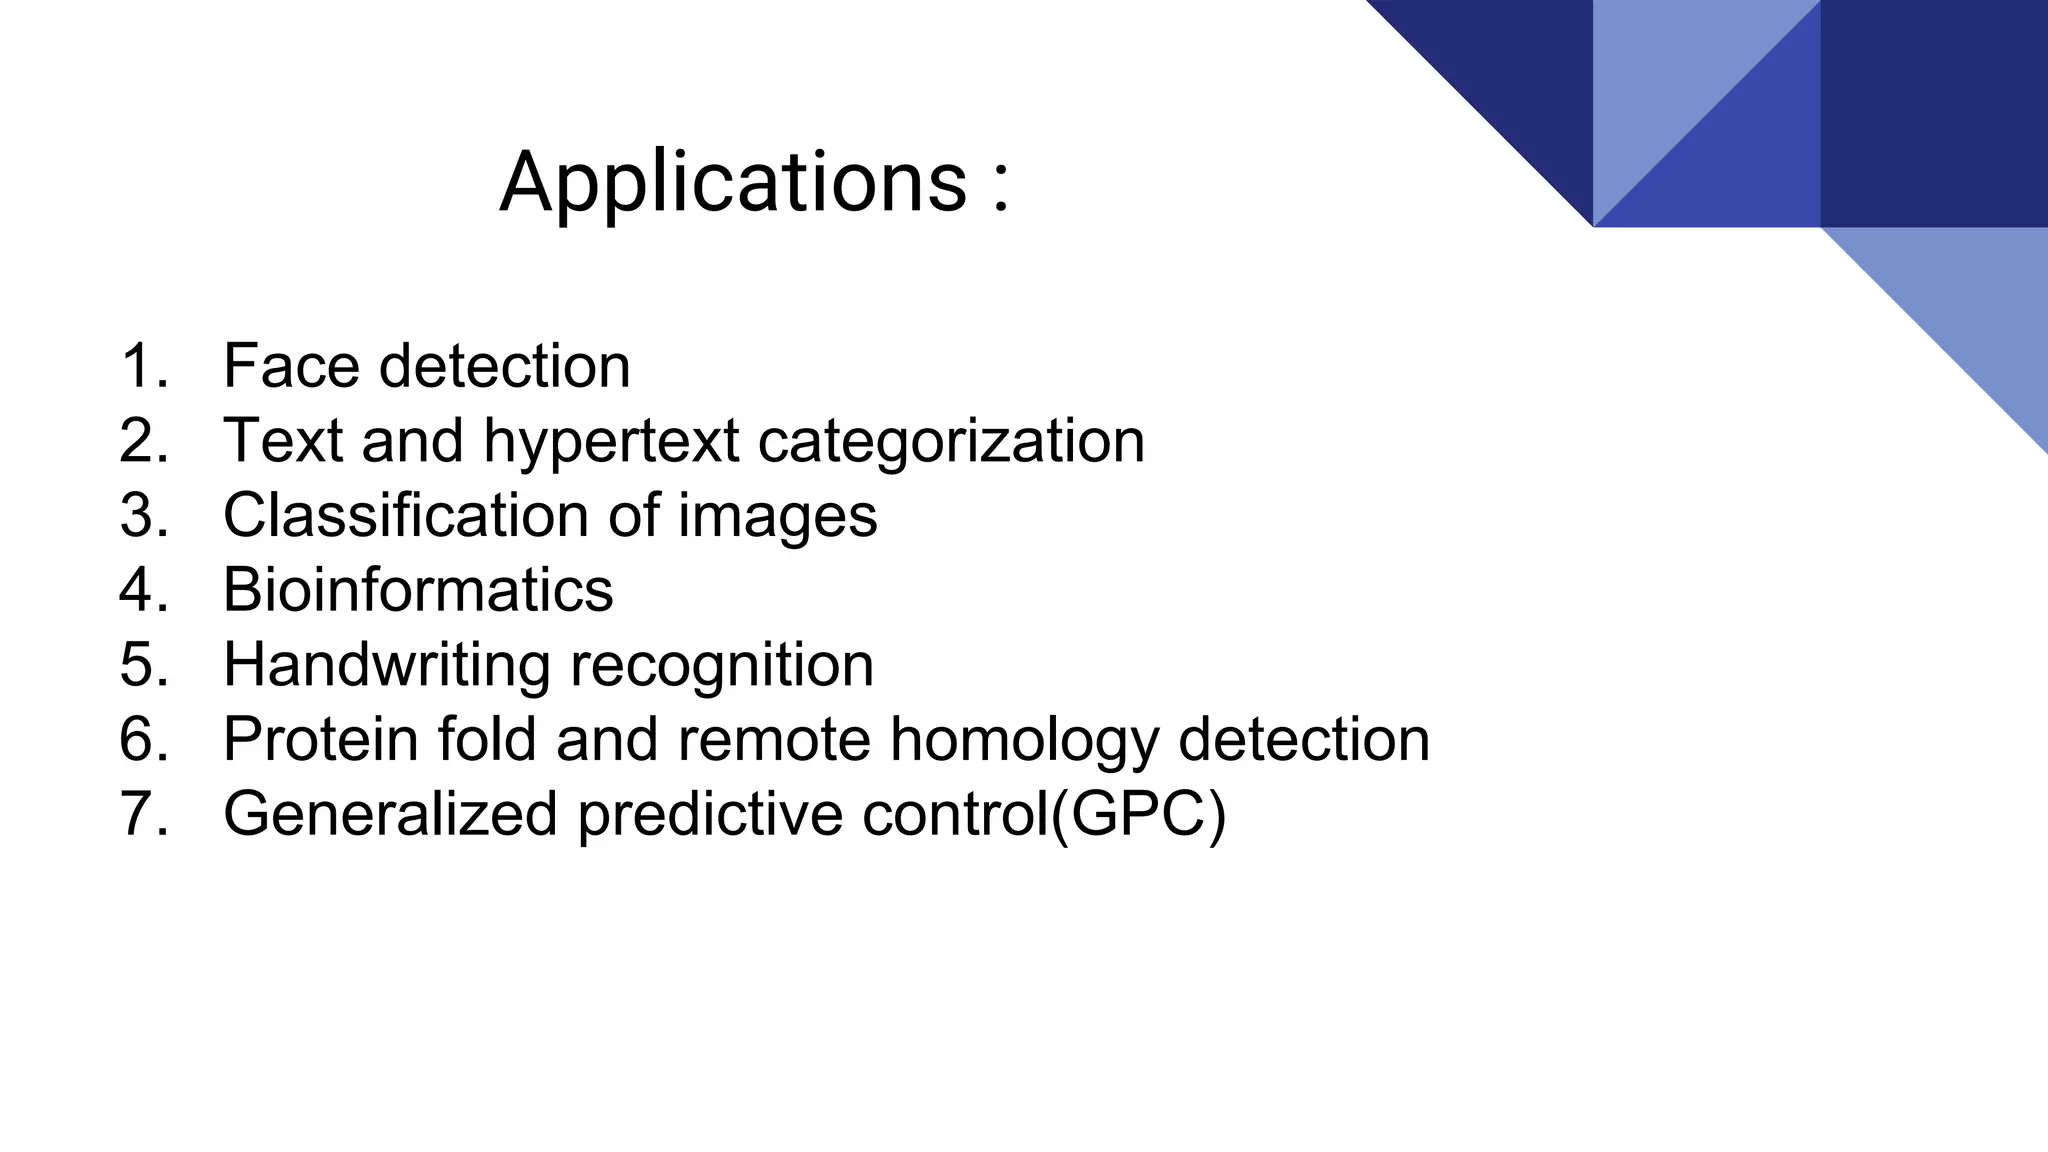
Applications :
1. Facedetection
2. Text and hypertext categorization
3. Classification of images
4. Bioinformatics
5. Handwriting recognition
6. Protein fold and remote homology detection
7. Generalized predictive control(GPC)
25.
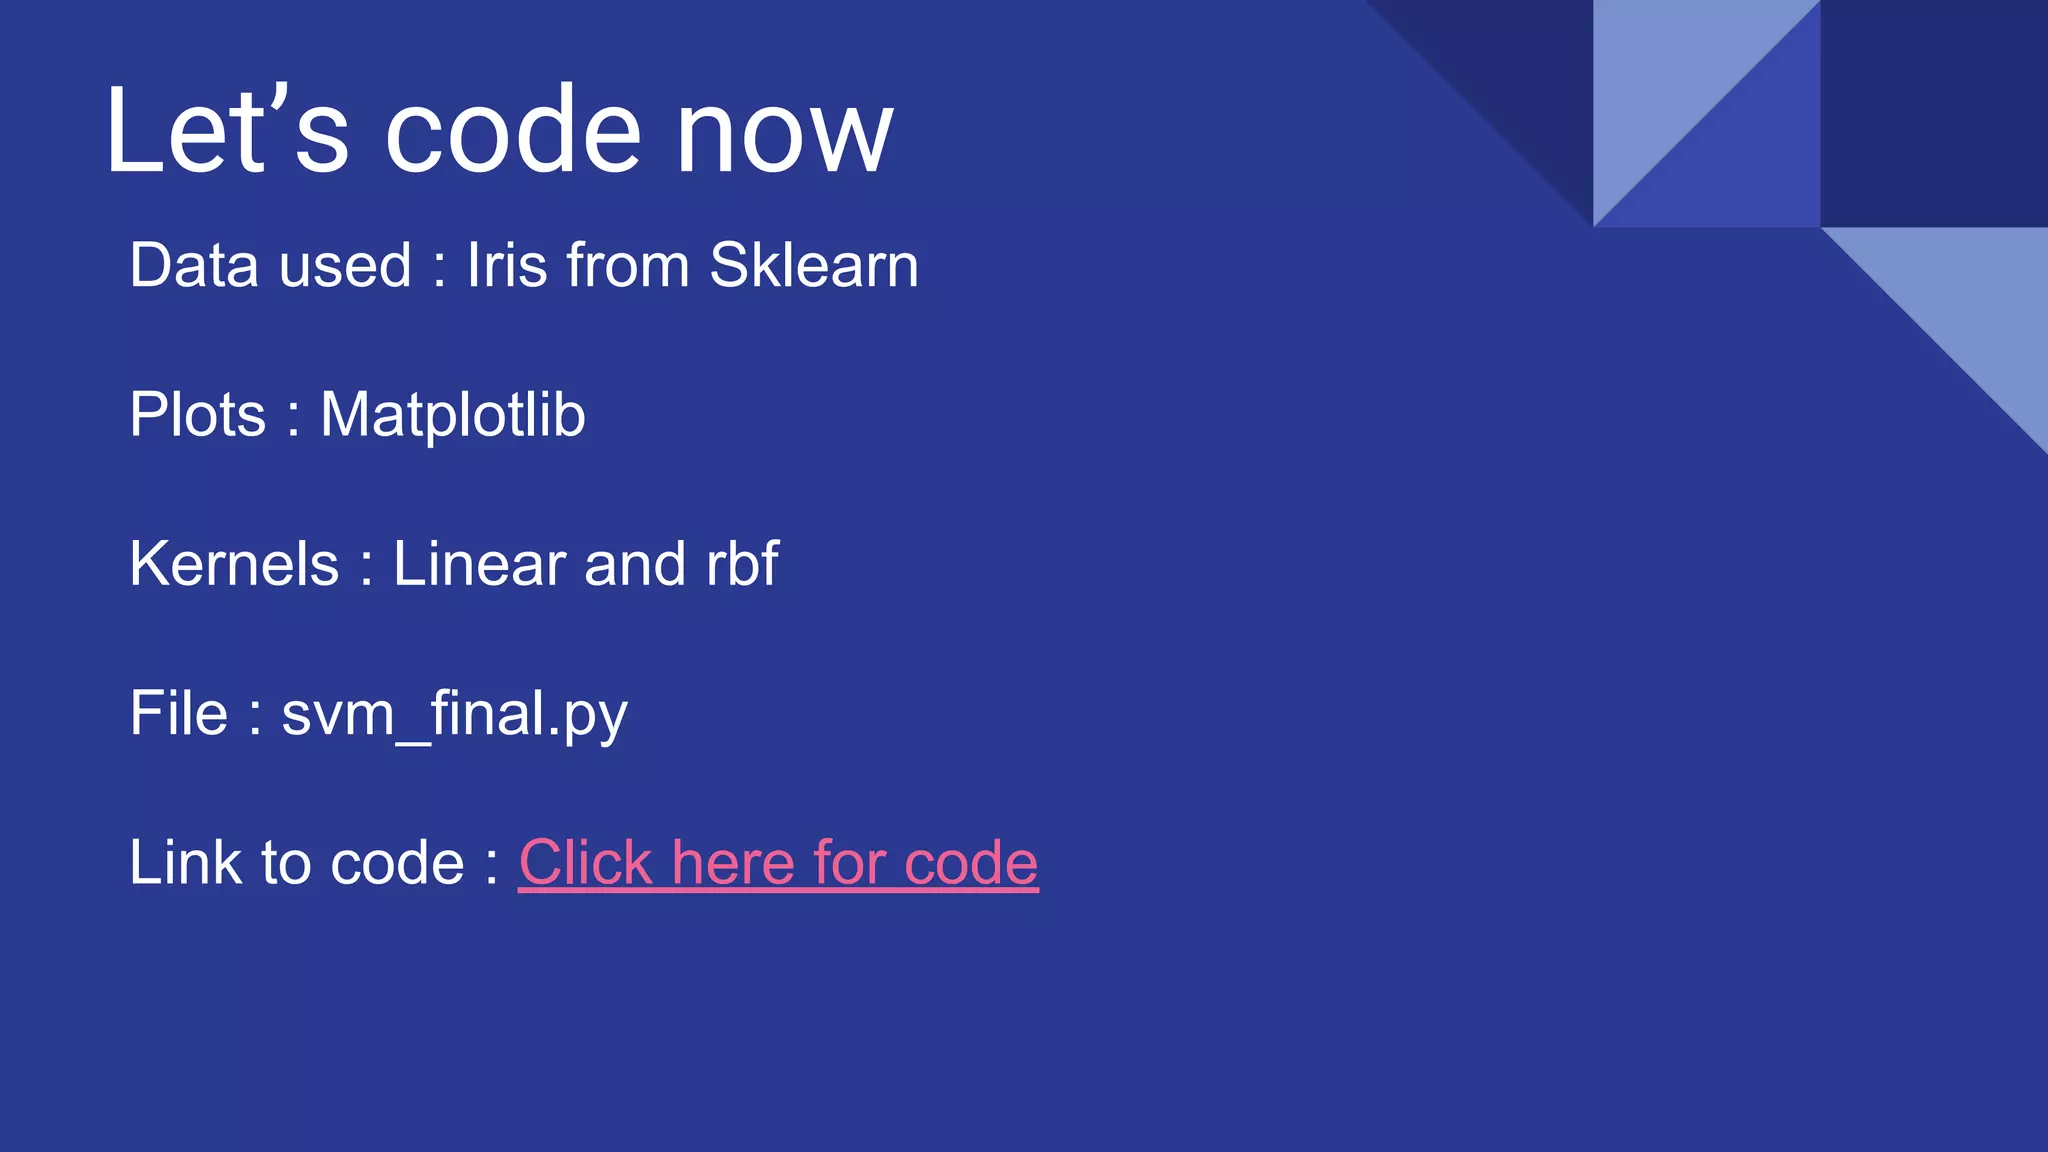
Let’s code now
Dataused : Iris from Sklearn
Plots : Matplotlib
Kernels : Linear and rbf
File : svm_final.py
Link to code : Click here for code


![SVM[Support vector Machine] Machine learning](https://cdn.slidesharecdn.com/ss_thumbnails/svm-250403184638-1cd9afdb-thumbnail.jpg?width=640&height=640&fit=bounds)


